Financial Planning
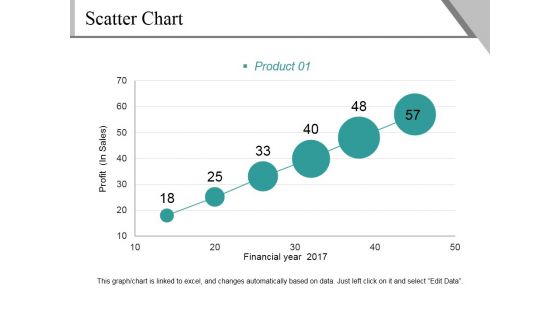
Scatter Chart Ppt PowerPoint Presentation File Background Image
This is a scatter chart ppt powerpoint presentation file background image. This is a six stage process. The stages in this process are profit, financial year, product, growth, success.
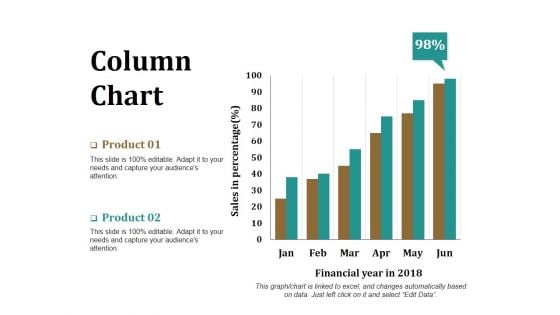
Column Chart Ppt PowerPoint Presentation Model Graphics Download
This is a column chart ppt powerpoint presentation model graphics download. This is a two stage process. The stages in this process are product, financial year, sales in percentage, bar graph, success.
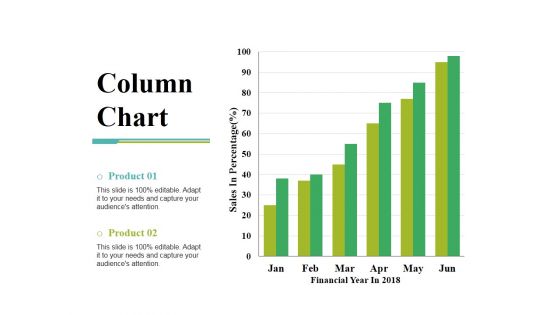
Column Chart Ppt PowerPoint Presentation Gallery Slide Portrait
This is a column chart ppt powerpoint presentation gallery slide portrait. This is a two stage process. The stages in this process are sales in percentage, financial year, product, bar graph, growth.
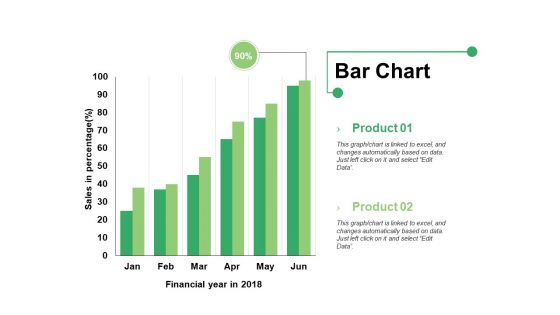
Bar Chart Ppt PowerPoint Presentation Infographics Format Ideas
This is a bar chart ppt powerpoint presentation infographics format ideas. This is a two stage process. The stages in this process are bar graph, product, financial year, sales in percentage.
Market Management Customer Service Powerpoint Topics
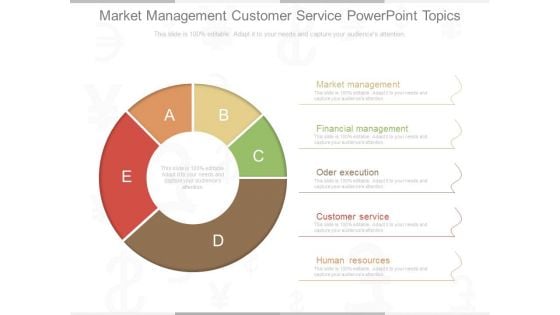
This is a market management customer service powerpoint topics. This is a five stage process. The stages in this process are market management, financial management, oder execution, customer service, human resources.
Corporate Structuring Diagram Presentation Backgrounds
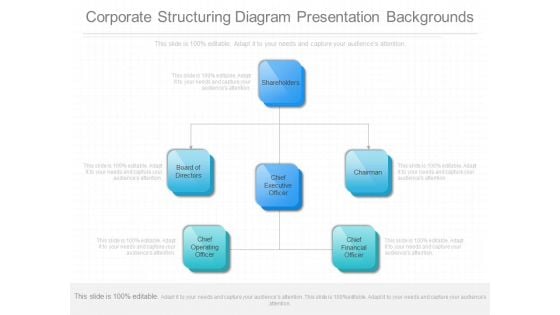
This is a corporate structuring diagram presentation backgrounds. This is a three stage process. The stages in this process are shareholders, board of directors, chief executive officer, chairman, chief operating officer, chief financial officer.
Automated Invoice Process Management Reporting Flow Diagram Slides PDF
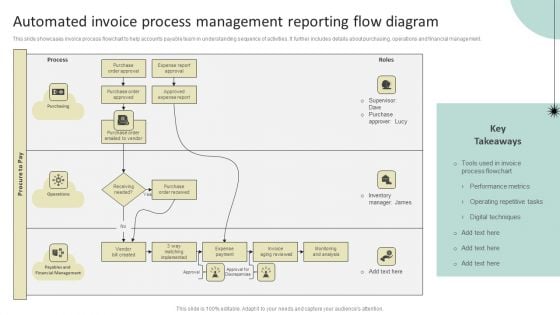
This slide showcases invoice process flowchart to help accounts payable team in understanding sequence of activities. It further includes details about purchasing, operations and financial management. Pitch your topic with ease and precision using this Automated Invoice Process Management Reporting Flow Diagram Slides PDF. This layout presents information on Process, Purchasing, Operations, Payables Financial Management. It is also available for immediate download and adjustment. So, changes can be made in the color, design, graphics or any other component to create a unique layout.
Marketing Promotion Channels Ppt Slide Examples
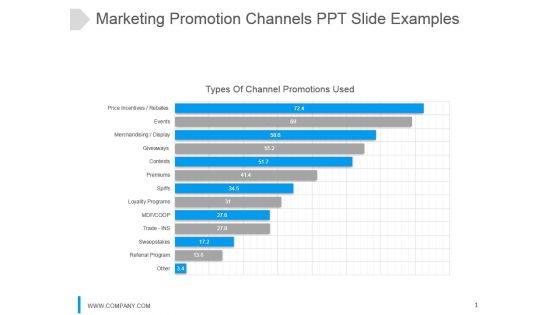
This is a marketing promotion channels ppt slide examples. This is a thirteen stage process. The stages in this process are types of channel promotions used, price incentives, rebates, events, merchandising, display, giveaways, contests, premiums, spiffs, loyalty programs, mdf, co op, trade ins, sweepstakes, referral, loyality programs, other.

Save Your Money On Tax Returns PowerPoint Templates Ppt Backgrounds For Slides 0513
Put yourself in a dominant position. Our Save Your Money On Tax Returns PowerPoint Templates PPT Backgrounds For Slides will confirm your superiority. Dominate proceedings with your ideas. Our clocks PowerPoint Templates will empower your thoughts. Our time planning PowerPoint Templates have a domino effect. Your ideas will generate one after another. Be a change management expert with our Save Your Money On Tax Returns PowerPoint Templates Ppt Backgrounds For Slides 0513. They will make you look good.
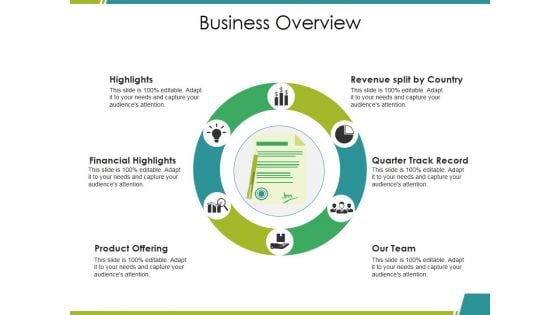
Business Overview Ppt PowerPoint Presentation File Graphics Pictures
This is a business overview ppt powerpoint presentation file graphics pictures. This is a six stage process. The stages in this process are highlights, financial highlights, product offering, our team, quarter track record.
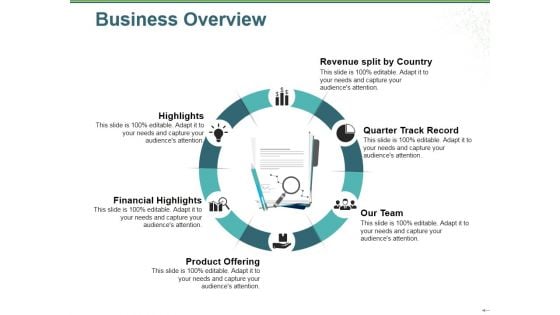
Business Overview Ppt PowerPoint Presentation Ideas Background Image
This is a business overview ppt powerpoint presentation ideas background image. This is a six stage process. The stages in this process are highlights, financial highlights, product offering, our team, quarter track record.

Business Network Growth Finance PowerPoint Themes And PowerPoint Slides 0411
Microsoft PowerPoint Theme and Slide with business financial growth and network concept Develop a winning strategy with our Business Network Growth Finance PowerPoint Themes And PowerPoint Slides 0411. You will come out on top.
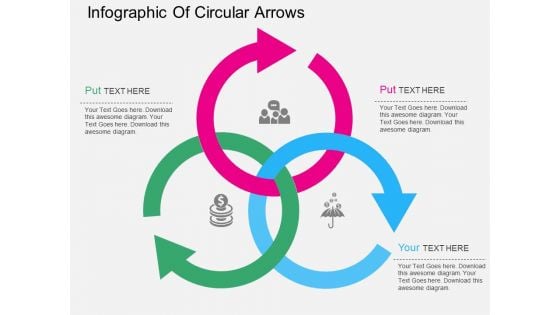
Infographic Of Circular Arrows Powerpoint Templates
This PPT slide has been designed with intersecting circular arrows. This PowerPoint template is suitable to present financial strategy for business. This professional slide helps in making an instant impact on viewers.
Four Tags With Finance And Growth Icons Powerpoint Template
Our above business diagram has been designed with graphics of four text tags with icons. This business may be used to display financial strategy. Use this PowerPoint template to present your work in a more smart and precise manner.
Four Staged Colored Tags And Finance Icons Powerpoint Template
Our above business diagram has been designed with graphics of four text tags with icons. This business may be used to display financial strategy. Use this PowerPoint template to present your work in a more smart and precise manner.
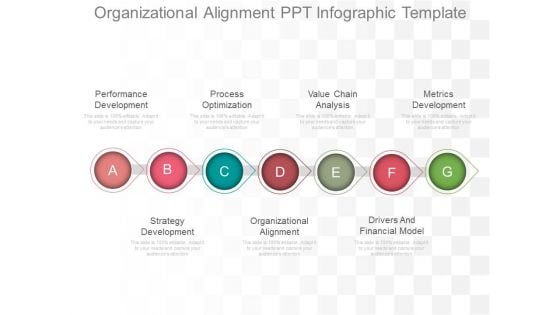
Organizational Alignment Ppt Infographic Template
This is a organizational alignment ppt infographic template. This is a seven stage process. The stages in this process are performance development, process optimization, value chain analysis, metrics development, strategy development, organizational alignment, drivers and financial model.
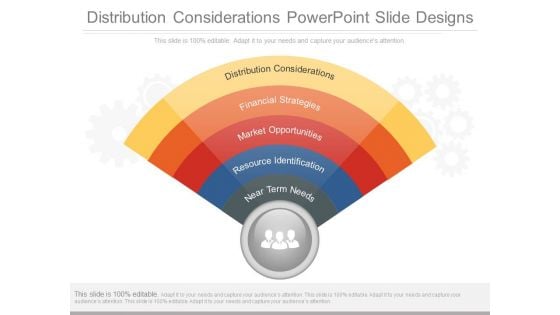
Distribution Considerations Powerpoint Slide Designs
This is a distribution considerations powerpoint slide designs. This is a five stage process. The stages in this process are distribution considerations, financial strategies, market opportunities, resource identification, near term needs.
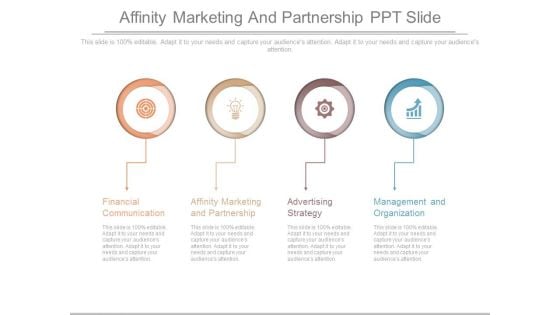
Affinity Marketing And Partnership Ppt Slide
This is a affinity marketing and partnership ppt slide. This is a four stage process. The stages in this process are financial communication, affinity marketing and partnership, advertising strategy, management and organization.
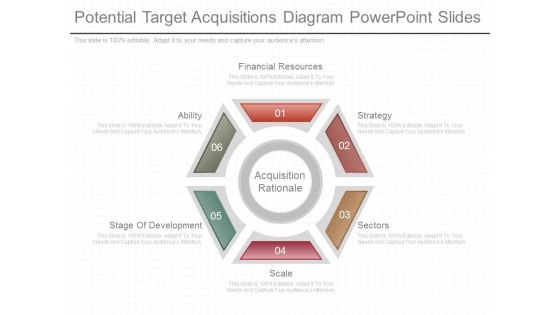
Potential Target Acquisitions Diagram Powerpoint Slides
This is a potential target acquisitions diagram powerpoint slides. This is a six stage process. The stages in this process are acquisition rationale, financial resources, strategy, sectors, scale, stage of development, ability.
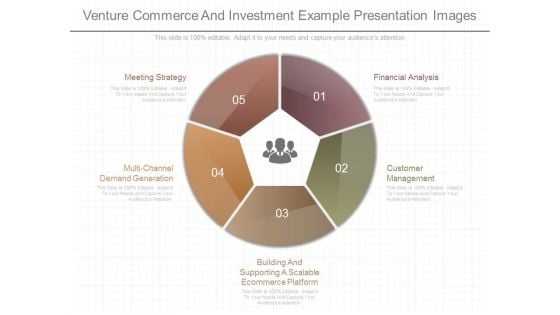
Venture Commerce And Investment Example Presentation Images
This is a venture commerce and investment example presentation images. This is a five stage process. The stages in this process are meeting strategy, multi channel demand generation, building and supporting a scalable ecommerce platform, customer management, financial analysis.
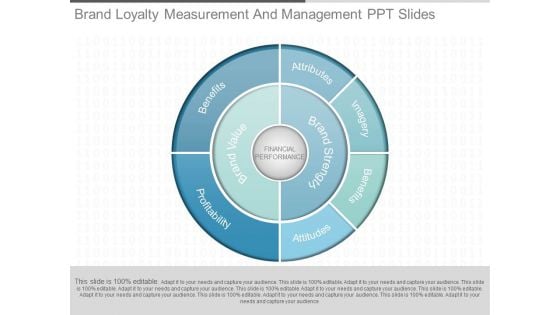
Brand Loyalty Measurement And Management Ppt Slides
This is a brand loyalty measurement and management ppt slides. This is a six stage process. The stages in this process are financial performance, brand value, brand strategy, benefits, profitability, imagery, attributes, attitudes.
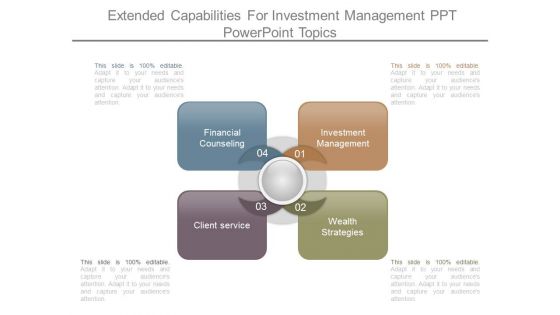
Extended Capabilities For Investment Management Ppt Powerpoint Topics
This is a extended capabilities for investment management ppt powerpoint topics. This is a four stage process. The stages in this process are financial counseling, investment management, wealth strategies, client service.
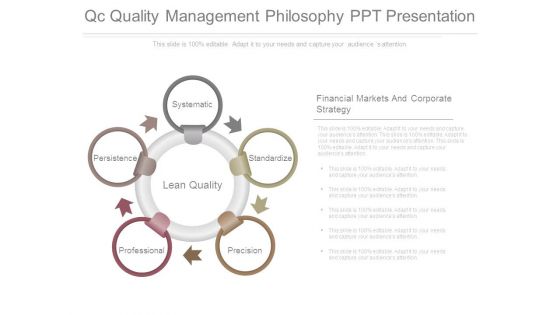
Qc Quality Management Philosophy Ppt Presentation
This is a qc quality management philosophy ppt presentation. This is a five stage process. The stages in this process are systematic, standardize, precision, professional, persistence, lean quality, financial markets and corporate strategy.
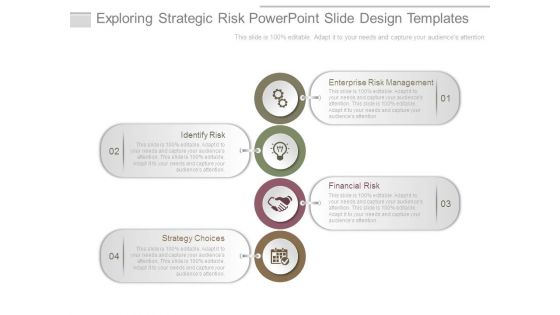
Exploring Strategic Risk Powerpoint Slide Design Templates
This is a exploring strategic risk powerpoint slide design templates. This is a four stage process. The stages in this process are enterprise risk management, identify risk, financial risk, strategy choices.
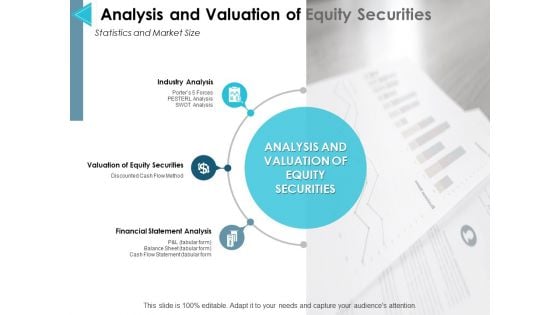
Analysis And Valuation Of Equity Securities Ppt PowerPoint Presentation Show Infographics
This is a analysis and valuation of equity securities ppt powerpoint presentation show infographics. This is a three stage process. The stages in this process are industry analysis, financial statement analysis, management, marketing, business, strategy.
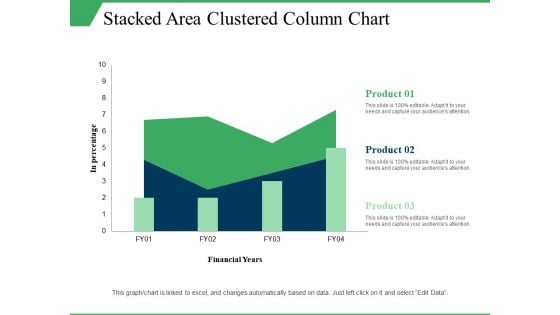
Stacked Area Clustered Column Chart Ppt PowerPoint Presentation Visual Aids Model
This is a stacked area clustered column chart ppt powerpoint presentation visual aids model. This is a three stage process. The stages in this process are in percentage, product, financial years, growth, column chart.
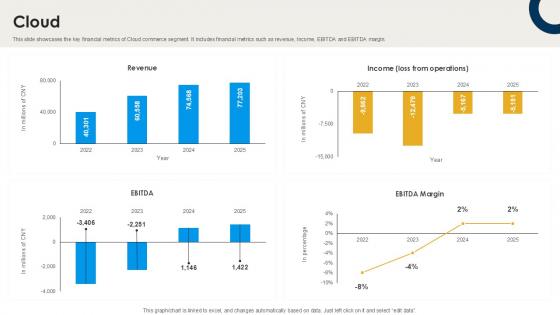
Cloud International Trade Of Products And Services PPT Sample CP SS V
This slide showcases the key financial metrics of Cloud commerce segment. It includes financial metrics such as revenue, Income, EBITDA and EBITDA margin. Do you have to make sure that everyone on your team knows about any specific topic I yes, then you should give Cloud International Trade Of Products And Services PPT Sample CP SS V a try. Our experts have put a lot of knowledge and effort into creating this impeccable Cloud International Trade Of Products And Services PPT Sample CP SS V. You can use this template for your upcoming presentations, as the slides are perfect to represent even the tiniest detail. You can download these templates from the Slidegeeks website and these are easy to edit. So grab these today This slide showcases the key financial metrics of Cloud commerce segment. It includes financial metrics such as revenue, Income, EBITDA and EBITDA margin.
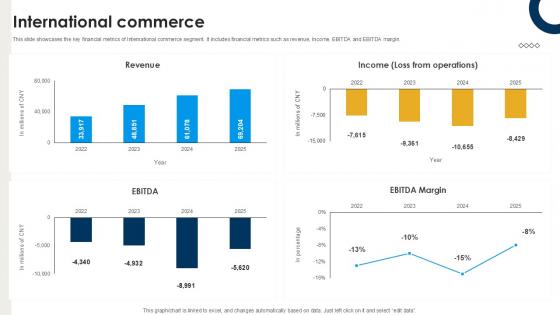
International Commerce International Trade Of Products And Services PPT Presentation CP SS V
This slide showcases the key financial metrics of International commerce segment. It includes financial metrics such as revenue, Income, EBITDA and EBITDA margin. Coming up with a presentation necessitates that the majority of the effort goes into the content and the message you intend to convey. The visuals of a PowerPoint presentation can only be effective if it supplements and supports the story that is being told. Keeping this in mind our experts created International Commerce International Trade Of Products And Services PPT Presentation CP SS V to reduce the time that goes into designing the presentation. This way, you can concentrate on the message while our designers take care of providing you with the right template for the situation. This slide showcases the key financial metrics of International commerce segment. It includes financial metrics such as revenue, Income, EBITDA and EBITDA margin.
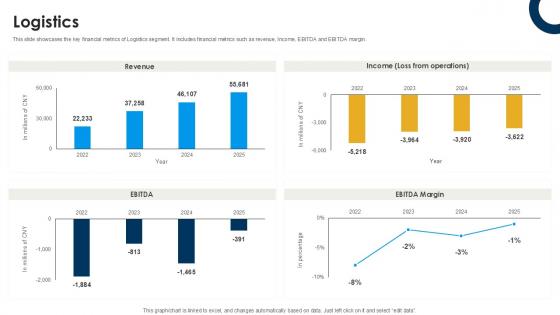
Logistics International Trade Of Products And Services PPT Sample CP SS V
This slide showcases the key financial metrics of Logistics segment. It includes financial metrics such as revenue, Income, EBITDA and EBITDA margin. Explore a selection of the finest Logistics International Trade Of Products And Services PPT Sample CP SS V here. With a plethora of professionally designed and pre-made slide templates, you can quickly and easily find the right one for your upcoming presentation. You can use our Logistics International Trade Of Products And Services PPT Sample CP SS V to effectively convey your message to a wider audience. Slidegeeks has done a lot of research before preparing these presentation templates. The content can be personalized and the slides are highly editable. Grab templates today from Slidegeeks. This slide showcases the key financial metrics of Logistics segment. It includes financial metrics such as revenue, Income, EBITDA and EBITDA margin.
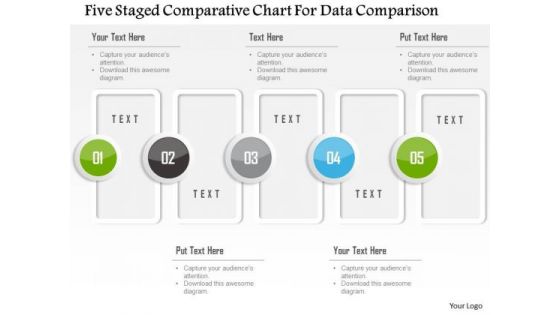
Business Diagram Five Staged Comparative Chart For Data Comparison Presentation Template
Five staged comparative chart has been used to design this power point template. This PPT contains the concept of data comparison. Use this PPT for your business and finance based data comparison in any financial presentation.
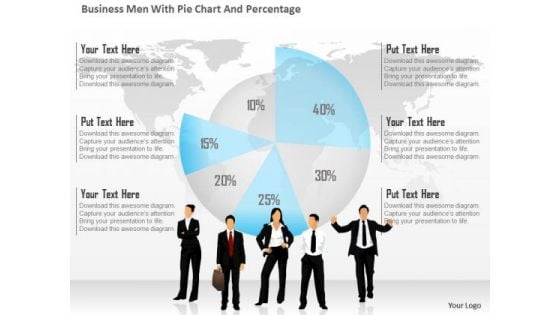
Business Diagram Business Men With Pie Chart And Percentage Presentation Template
This business diagram has been designed with graphic of business people and pie chart with percentage. This diagram is designed to depict team meeting on financial matter. This diagram offers a way for your audience to visually conceptualize the process.
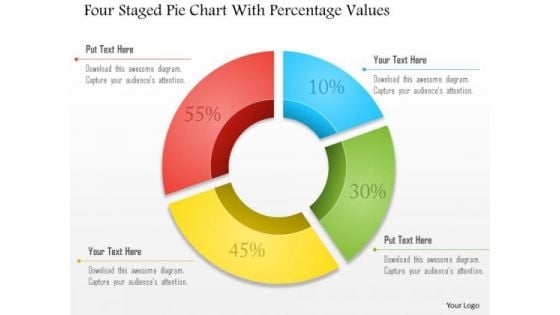
Business Diagram Four Staged Pie Chart With Percentage Values Presentation Template
Four staged pie chart and percentage values are used to design this business slide. Download this diagram to make business and financial reports. Use our above diagram to express information in a visual way.
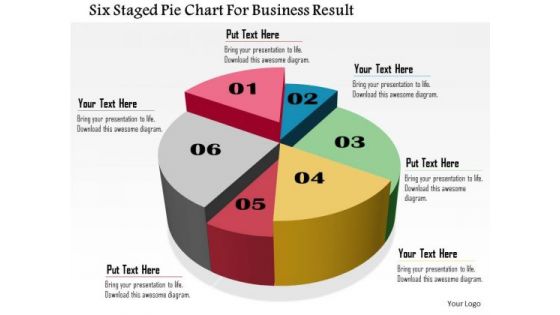
Business Daigram Six Staged Pie Chart For Business Result Presentation Templets
Six staged pie chart is used to design this business slide. Download this diagram to make business and financial reports. Use our above diagram to express information in a visual way.
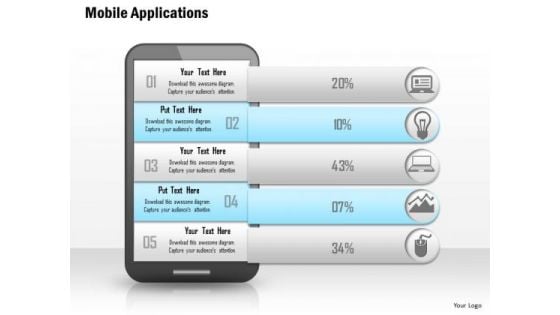
Business Diagram Mobile Applications Vector Illustration Concept Presentation Template
As mobile have become an indispensible part of our daily lives. This amazing mobile application icons will also add great value to your ideas and presentations in the fields of telecommunications, travelling, banks and financial institutions, e-Learning etc.
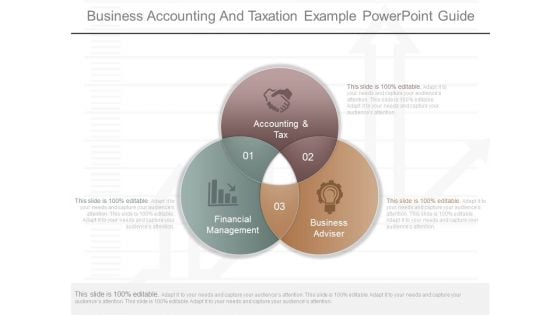
Business Accounting And Taxation Example Powerpoint Guide
This is a business accounting and taxation example powerpoint guide. This is a three stage process. The stages in this process are accounting and tax, financial management, business adviser.
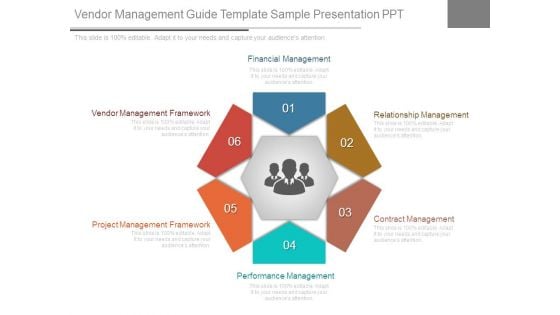
Vendor Management Guide Template Sample Presentation Ppt
This is a vendor management guide template sample presentation ppt. This is a six stage process. The stages in this process are financial management, relationship management, contract management, performance management, project management framework, vendor management framework.
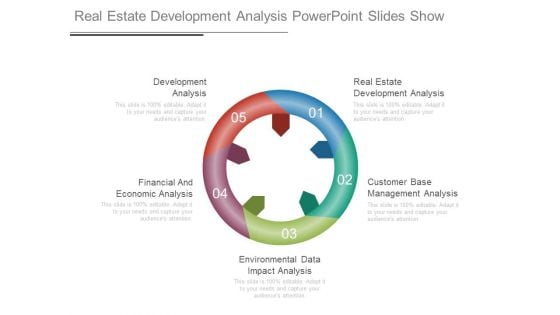
Real Estate Development Analysis Powerpoint Slides Show
This is a real estate development analysis powerpoint slides show. This is a five stage process. The stages in this process are development analysis, financial and economic analysis, environmental data impact analysis, customer base management analysis, real estate development analysis.
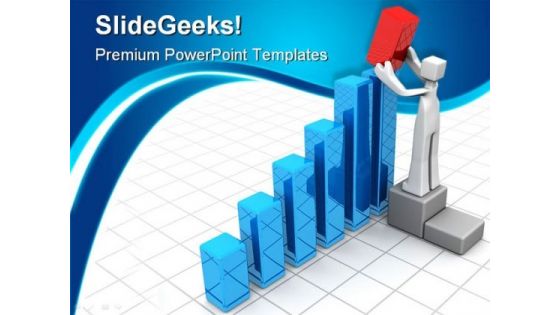
Growth Graph Finance PowerPoint Templates And PowerPoint Backgrounds 0511
Microsoft PowerPoint Template and Background with businessman adding a red bar chart to increase financial growth Transition to a better presentation with our Growth Graph Finance PowerPoint Templates And PowerPoint Backgrounds 0511. Download without worries with our money back guaranteee.

Business Bar Graph Arrow Success PowerPoint Templates And PowerPoint Backgrounds 0511
Microsoft PowerPoint Template and Background with a business chart/graph showing the decline of the financial money market Make the event with our Business Bar Graph Arrow Success PowerPoint Templates And PowerPoint Backgrounds 0511. Your thoughts will be really happening.
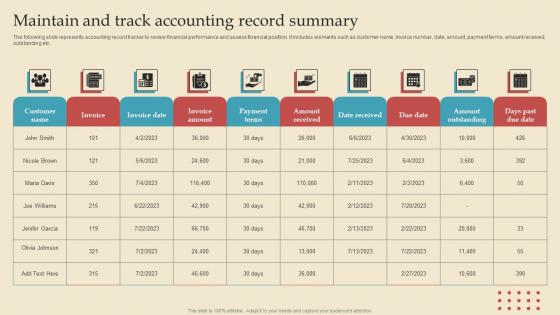
Maintain Track Accounting Describing Business Performance Administration Goals Sample Pdf
The following slide represents accounting record tracker to review financial performance and assess financial position. It includes elements such as customer name, invoice number, date, amount, payment terms, amount received, outstanding etc. Want to ace your presentation in front of a live audience Our Maintain Track Accounting Describing Business Performance Administration Goals Sample Pdf can help you do that by engaging all the users towards you. Slidegeeks experts have put their efforts and expertise into creating these impeccable powerpoint presentations so that you can communicate your ideas clearly. Moreover, all the templates are customizable, and easy to edit and downloadable. Use these for both personal and commercial use. The following slide represents accounting record tracker to review financial performance and assess financial position. It includes elements such as customer name, invoice number, date, amount, payment terms, amount received, outstanding etc.
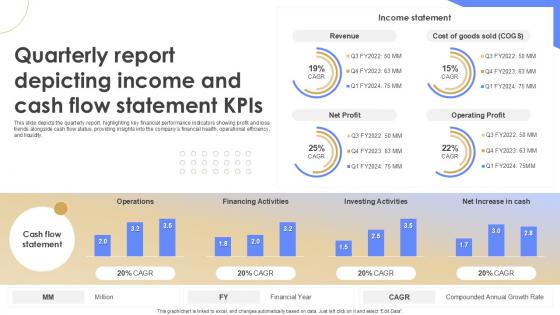
Quarterly Report Depicting Income And Cash Flow Statement KPIS Quarterly Report Ppt Example
This slide depicts the quarterly report, highlighting key financial performance indicators showing profit and loss trends alongside cash flow status, providing insights into the companys financial health, operational efficiency, and liquidity. Do you have an important presentation coming up Are you looking for something that will make your presentation stand out from the rest Look no further than Quarterly Report Depicting Income And Cash Flow Statement KPIS Quarterly Report Ppt Example With our professional designs, you can trust that your presentation will pop and make delivering it a smooth process. And with Slidegeeks, you can trust that your presentation will be unique and memorable. So why wait Grab Quarterly Report Depicting Income And Cash Flow Statement KPIS Quarterly Report Ppt Example today and make your presentation stand out from the rest This slide depicts the quarterly report, highlighting key financial performance indicators showing profit and loss trends alongside cash flow status, providing insights into the companys financial health, operational efficiency, and liquidity.
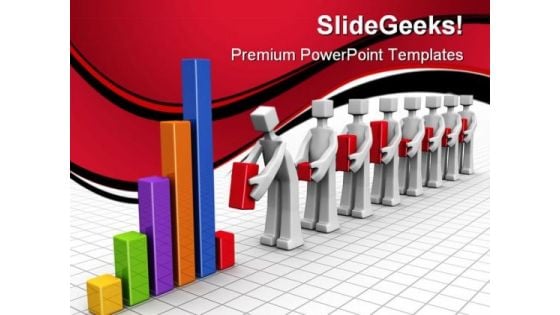
Teamwork Concept Business PowerPoint Templates And PowerPoint Backgrounds 0511
Microsoft PowerPoint Template and Background with business team adding individual performance bar chart to annual financial chart Get the right fabric for your thoughts. Our Teamwork Concept Business PowerPoint Templates And PowerPoint Backgrounds 0511 will provide a fitting color.
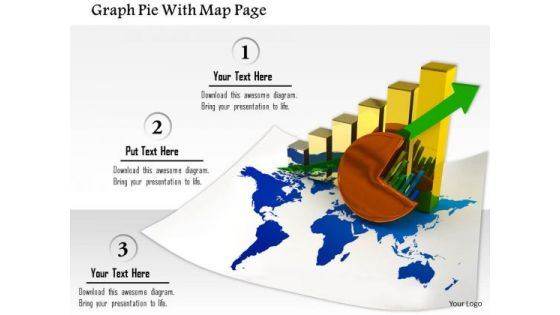
Stock Photo Graph Pie With Map Page PowerPoint Slide
This image slide contains business charts on world map. This image is designed with bar graph and pie chart on world map depicting global economy. Use this image slide to represent financial growth in any business presentation.
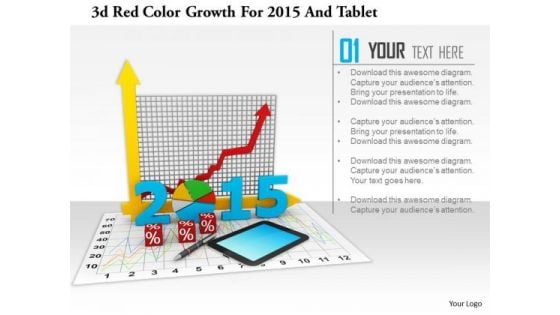
Stock Photo 3d Red Color Growth For 2015 And Tablet PowerPoint Slide
This image slide has graphics of financial charts and reports. This contains bar graph and pie chart to present business reports. Build an innovative presentation using this professional image slide.
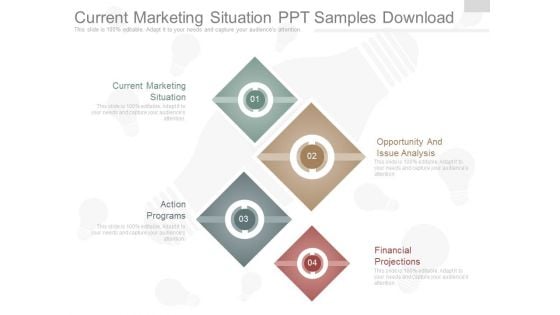
Current Marketing Situation Ppt Samples Download
This is a current marketing situation ppt samples download. This is a four stage process. The stages in this process are current marketing situation, action programs, opportunity and issue analysis, financial projections.
Improve Business Performance Template Ppt Examples Slides
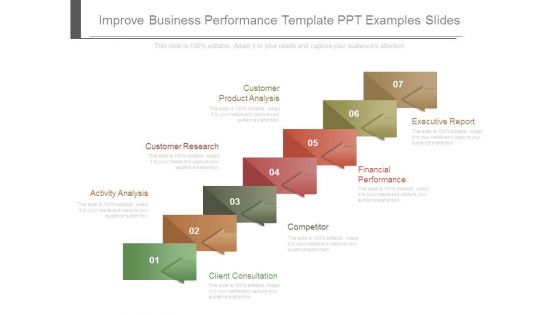
This is a improve business performance template ppt examples slides. This is a seven stage process. The stages in this process are customer product analysis, customer research, activity analysis, executive report, financial performance, competitor, client consultation.
Partner Management Techniques And Their Impact On Strategies Infographics PDF
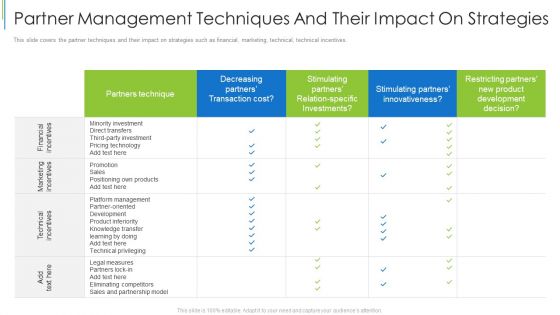
This slide covers the partner techniques and their impact on strategies such as financial, marketing, technical, technical incentives. Deliver an awe inspiring pitch with this creative partner management techniques and their impact on strategies infographics pdf bundle. Topics like technical incentives, marketing incentives, financial incentives can be discussed with this completely editable template. It is available for immediate download depending on the needs and requirements of the user.

Travel Internet Globe PowerPoint Template 0910
Financial success concept: retro golden compass with growing bar chart from golden coins Get the best backing available. It'll be difficult to beat your thoughts and our Travel Internet Globe PowerPoint Template 0910.

Stock Market Business PowerPoint Backgrounds And Templates 1210
Microsoft PowerPoint Template and Background with Financial market charts on display forex candlesticks Index your ascent with our Stock Market Business PowerPoint Backgrounds And Templates 1210. Illustrate every step of the way.

Graph01 Finance PowerPoint Templates And PowerPoint Backgrounds 0511
Microsoft PowerPoint Template and Background with financial computing deskto computer with bar chart Delve on the cold facts in detail. Explain the factual analysis on our Graph01 Finance PowerPoint Templates And PowerPoint Backgrounds 0511.
Growth Graph Finance PowerPoint Themes And PowerPoint Slides 0511
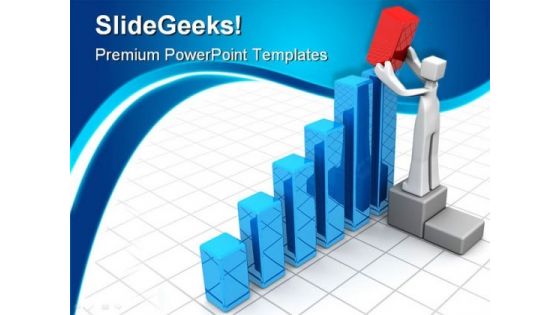
Microsoft PowerPoint Theme and Slide with businessman adding a red bar chart to increase financial growth Our Growth Graph Finance PowerPoint Themes And PowerPoint Slides 0511 empower educators. Conveying concepts and ideas becomes easier.
Clustered Column Line Ppt PowerPoint Presentation Icon Good
This is a clustered column line ppt powerpoint presentation icon good. This is a three stage process. The stages in this process are product, financial year, bar graph, business, growth.
Bar Diagram Ppt PowerPoint Presentation Gallery Structure
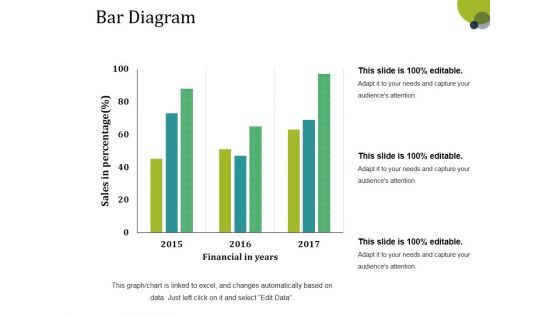
This is a bar diagram ppt powerpoint presentation gallery structure. This is a three stage process. The stages in this process are financial in years, sales in percentage, bar graph, growth, success.
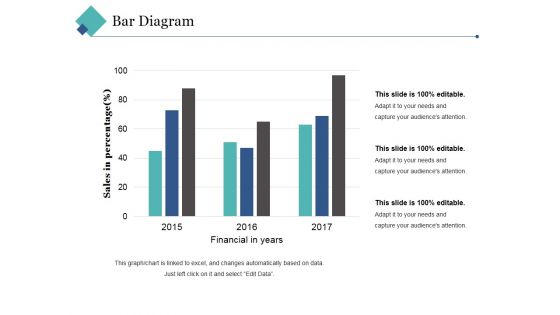
Bar Diagram Ppt PowerPoint Presentation Pictures Background Image
This is a bar diagram ppt powerpoint presentation pictures background image. This is a three stage process. The stages in this process are financial in years, sales in percentage, bar graph, growth, success.
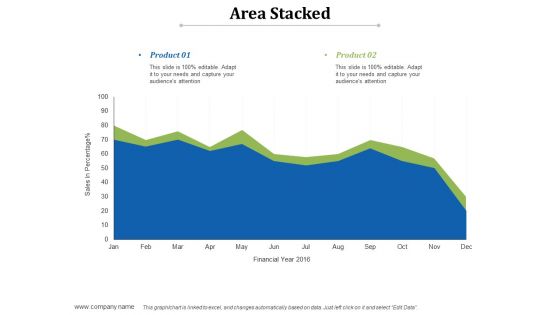
Area Stacked Ppt PowerPoint Presentation Infographics Shapes
This is a area stacked ppt powerpoint presentation infographics shapes. This is a two stage process. The stages in this process are product, area stacked, sales in percentage, financial year.
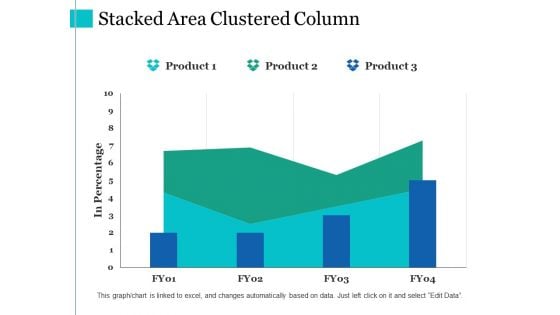
Stacked Area Clustered Column Ppt PowerPoint Presentation Summary Slides
This is a stacked area clustered column ppt powerpoint presentation summary slides. This is a three stage process. The stages in this process are product, in percentage, financial year, bar graph.
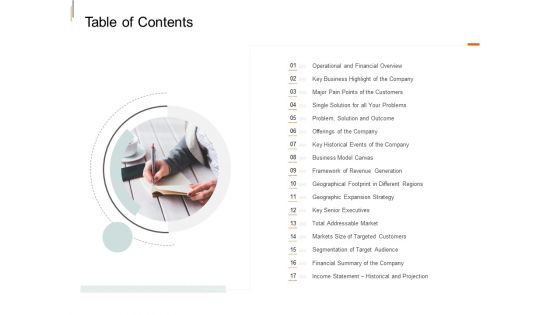
Equity Crowd Investing Table Of Contents Ppt File Example Topics PDF
Presenting equity crowd investing table of contents ppt file example topics pdf to provide visual cues and insights. Share and navigate important information on one stage that need your due attention. This template can be used to pitch topics like operational and financial overview, business highlight company, historical events company, framework revenue generation, financial summary company. In addtion, this PPT design contains high-resolution images, graphics, etc, that are easily editable and available for immediate download.
Project Expenditure Management For Operations Managers Ppt Icon Ideas PDF
The following slide highlights the project cost management for operations managers illustrating key headings which includes financial management, project estimation and cost control Presenting Project Expenditure Management For Operations Managers Ppt Icon Ideas PDF to dispense important information. This template comprises three stages. It also presents valuable insights into the topics including Financial Management, Project Estimation, Cost Control. This is a completely customizable PowerPoint theme that can be put to use immediately. So, download it and address the topic impactfully.
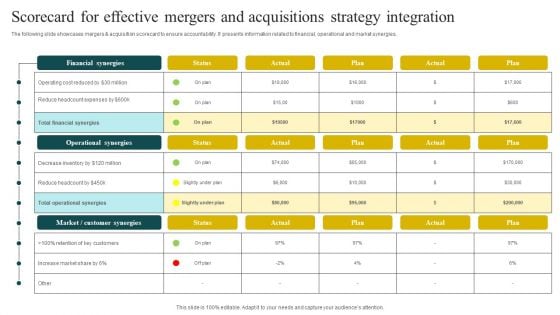
Scorecard For Effective Mergers And Acquisitions Strategy Integration Download PDF
The following slide showcases mergers and acquisition scorecard to ensure accountability. It presents information related to financial, operational and market synergies. Showcasing this set of slides titled Scorecard For Effective Mergers And Acquisitions Strategy Integration Download PDF. The topics addressed in these templates are Financial Synergies, Operational Synergies, Customer Synergies. All the content presented in this PPT design is completely editable. Download it and make adjustments in color, background, font etc. as per your unique business setting.
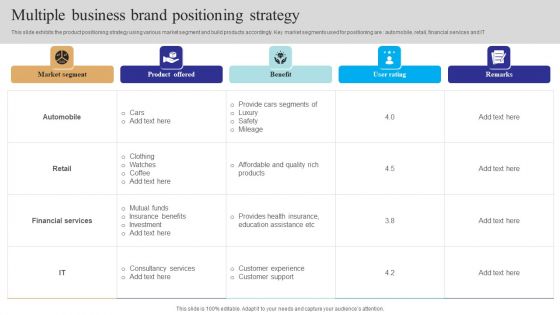
Multiple Business Brand Positioning Strategy Brochure PDF
This slide exhibits the product positioning strategy using various market segment and build products accordingly. Key market segments used for positioning are automobile, retail, financial services and IT. Pitch your topic with ease and precision using this Multiple Business Brand Positioning Strategy Brochure PDF. This layout presents information on Financial Services, Market Segment, Quality. It is also available for immediate download and adjustment. So, changes can be made in the color, design, graphics or any other component to create a unique layout.


 Continue with Email

 Home
Home


