Financial Planning
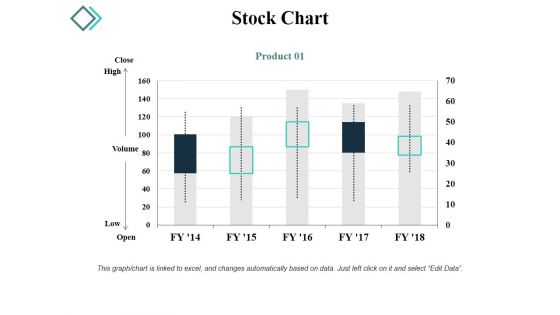
Stock Chart Ppt PowerPoint Presentation Gallery Graphic Images
This is a stock chart ppt powerpoint presentation gallery graphic images. This is a five stage process. The stages in this process are close, high, volume, low, open.
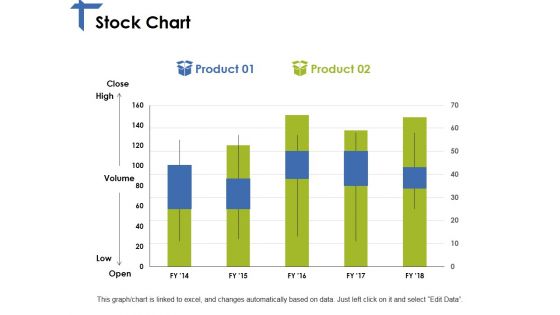
Stock Chart Ppt PowerPoint Presentation Slides Graphics Pictures
This is a stock chart ppt powerpoint presentation slides graphics pictures. This is a two stage process. The stages in this process are product, high, volume, low, open.
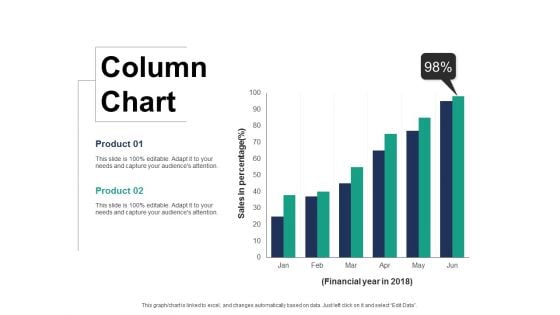
Column Chart Finance Ppt PowerPoint Presentation Layouts Display
This is a column chart finance ppt powerpoint presentation layouts display. This is a two stage process. The stages in this process are finance, marketing, management, investment, analysis.
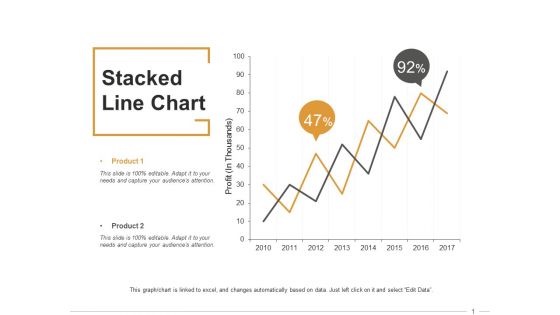
Stacked Line Chart Ppt PowerPoint Presentation Inspiration Format
This is a stacked line chart ppt powerpoint presentation inspiration format. This is a two stage process. The stages in this process are finance, marketing, management, investment, analysis.
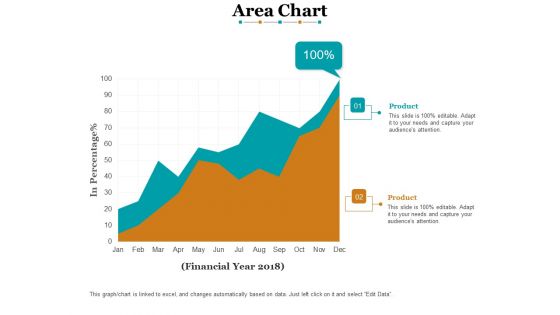
Area Chart Finance Ppt PowerPoint Presentation Model Ideas
This is a area chart finance ppt powerpoint presentation model ideas. This is a two stage process. The stages in this process are finance, marketing, analysis, business, investment.
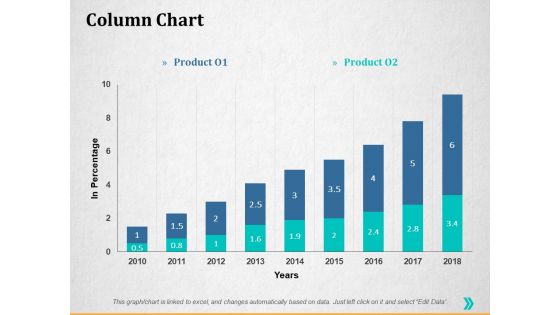
Column Chart Ppt PowerPoint Presentation Infographics Graphics Template
This is a column chart ppt powerpoint presentation infographics graphics template. This is a two stage process. The stages in this process are percentage, product, business, management, marketing.
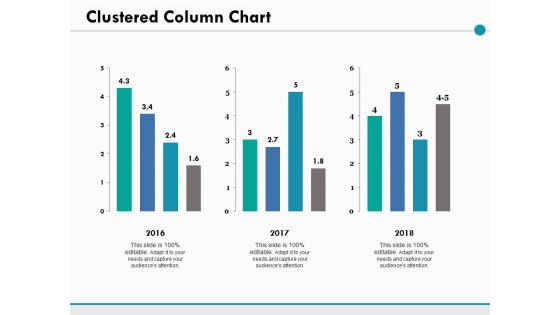
Clustered Column Chart Ppt PowerPoint Presentation Ideas Picture
This is a clustered column chart ppt powerpoint presentation ideas picture. This is a three stage process. The stages in this process are percentage, product, management, marketing.
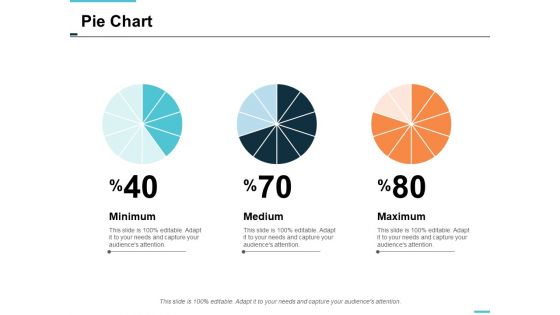
pie chart finance ppt powerpoint presentation styles skills
This is a pie chart finance ppt powerpoint presentation styles skills. This is a three stage process. The stages in this process are finance, marketing, management, investment, analysis.

Combo Chart Finance Ppt PowerPoint Presentation Portfolio Guidelines
This is a combo chart finance ppt powerpoint presentation portfolio guidelines. This is a three stage process. The stages in this process are finance, marketing, management, investment, analysis.
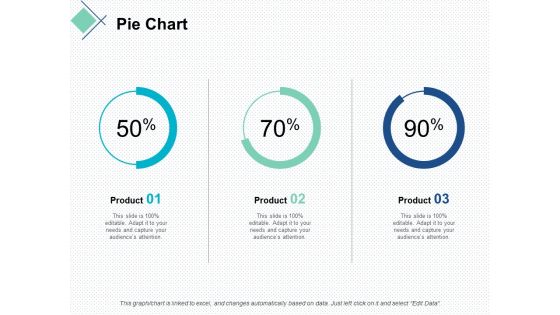
pie chart finance marketing ppt powerpoint presentation slides demonstration
This is a pie chart finance marketing ppt powerpoint presentation slides demonstration. This is a stage process. The stages in this process are finance, marketing, management, investment, analysis.
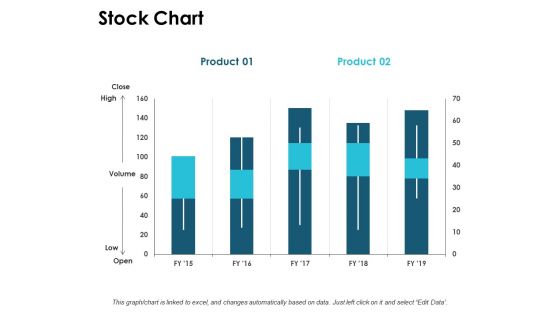
Stock Chart Graph Ppt PowerPoint Presentation Ideas Demonstration
This is a stock chart graph ppt powerpoint presentation ideas demonstration. This is a three stage process. The stages in this process are finance, marketing, management, investment, analysis.
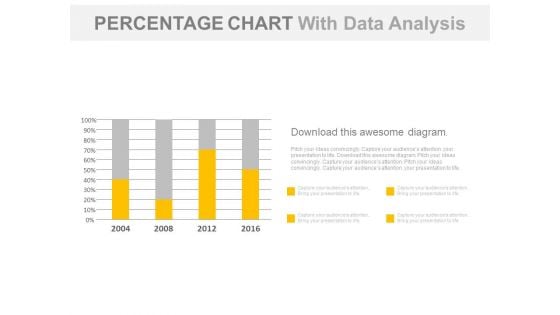
Year Based Chart With Percentage Data Analysis Powerpoint Slides
Our above business slide contains year based statistical chart. This PowerPoint template can be used to display percentage data analysis. Capture the attention of your audience with this slide.
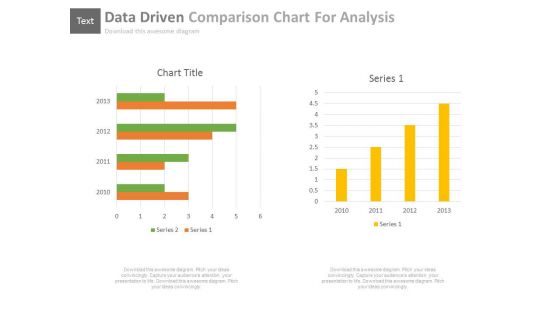
Data Driven Comparison Charts For Analysis Powerpoint Slides
You can download this PowerPoint template to display statistical data and analysis. This PPT slide contains data driven comparison charts. Draw an innovative business idea using this professional diagram.
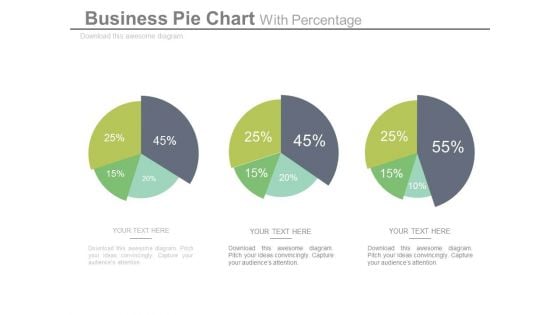
Pie Charts For Relative Comparison Study Powerpoint Slides
This power point template illustrates diagram of three pie charts with percentage values. This business slide can be used for relative comparison study. Present your views and ideas with this impressive slide.
Six Steps Circular Chart With Icons Powerpoint Slides
This PowerPoint template has been designed with six steps circular chart with icons. This PPT slide may be used to display business and management functions. Download this slide to build unique presentation.

Scatter Bubble Chart Ppt PowerPoint Presentation Infographics Backgrounds
This is a scatter bubble chart ppt powerpoint presentation infographics backgrounds. This is a five stage process. The stages in this process are highest sale, in price, growth, success, business.
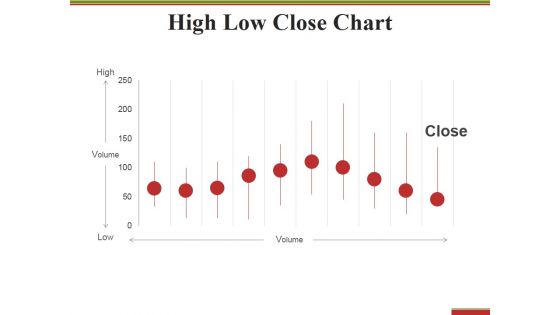
High Low Close Chart Ppt PowerPoint Presentation Styles Display
This is a high low close chart ppt powerpoint presentation styles display. This is a ten stage process. The stages in this process are high, volume, low, close, finance.
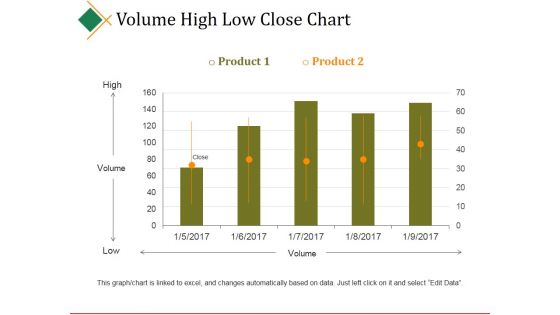
Volume High Low Close Chart Ppt PowerPoint Presentation Gallery Shapes
This is a volume high low close chart ppt powerpoint presentation gallery shapes. This is a five stage process. The stages in this process are high, volume, low, close, finance.
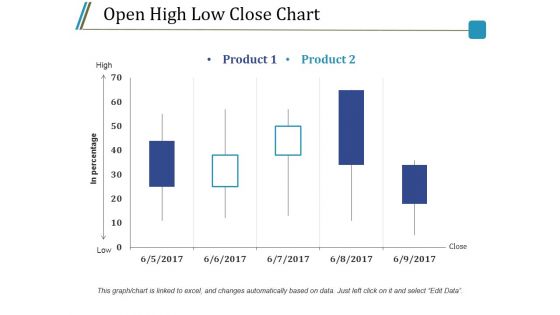
Open High Low Close Chart Ppt PowerPoint Presentation Styles Model
This is a open high low close chart ppt powerpoint presentation styles model. This is a five stage process. The stages in this process are product, high, low, in percentage, close.
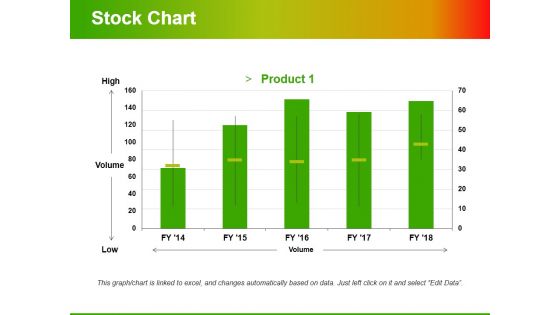
Stock Chart Template 2 Ppt PowerPoint Presentation Infographic Template Styles
This is a stock chart template 2 ppt powerpoint presentation infographic template styles. This is a one stage process. The stages in this process are high, volume, low, product, volume.
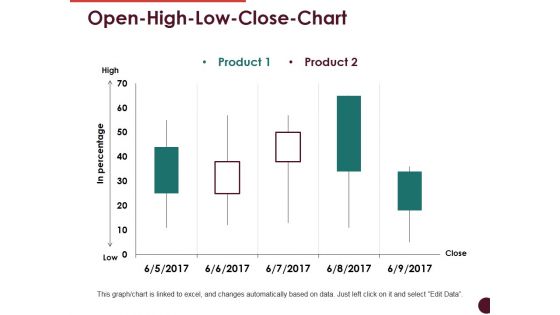
Open High Low Close Chart Ppt PowerPoint Presentation Professional Visuals
This is a open high low close chart ppt powerpoint presentation professional visuals. This is a two stage process. The stages in this process are high, low, in percentage, product, close.
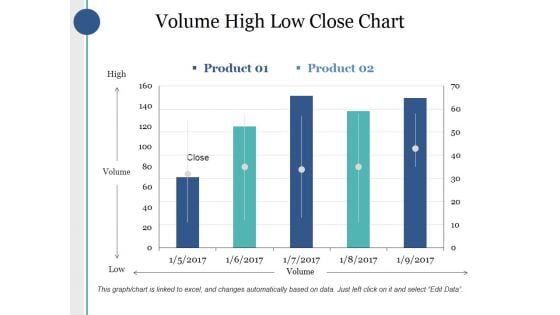
Volume High Low Close Chart Ppt PowerPoint Presentation Infographics Good
This is a volume high low close chart ppt powerpoint presentation infographics good. This is a two stage process. The stages in this process are high, volume, low, product, close.
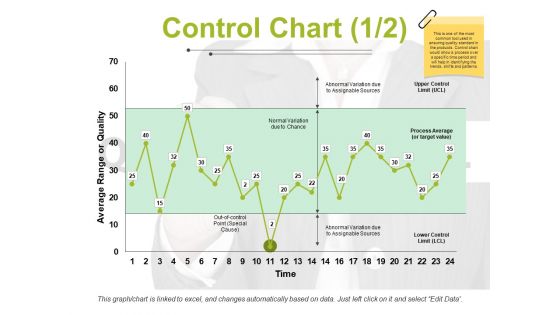
Control Chart Template 1 Ppt PowerPoint Presentation Ideas Images
This is a control chart template 1 ppt powerpoint presentation ideas images. This is a two stage process. The stages in this process are average range or quality, upper control limit, lower control limit, time, process average.
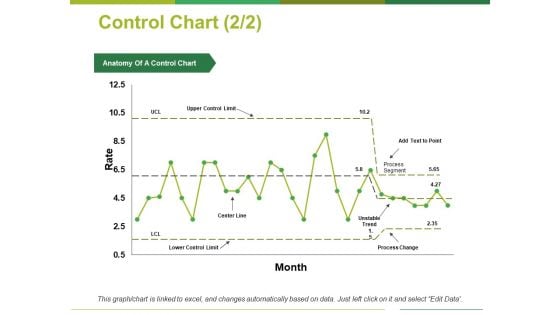
Control Chart Template 2 Ppt PowerPoint Presentation Portfolio Summary
This is a control chart template 2 ppt powerpoint presentation portfolio summary. This is a one stage process. The stages in this process are upper control limit, process segment, process change, unstable trend, lower control limit.
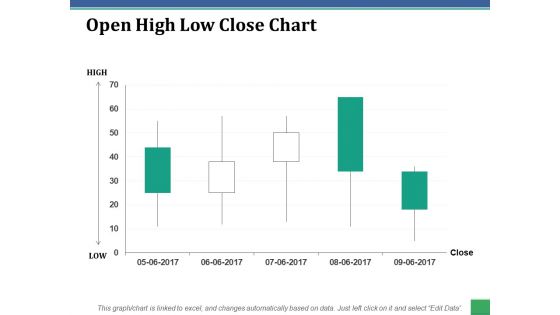
Open High Low Close Chart Ppt PowerPoint Presentation Professional Inspiration
This is a open high low close chart ppt powerpoint presentation professional inspiration. This is a five stage process. The stages in this process are high, low, close, business, finance.
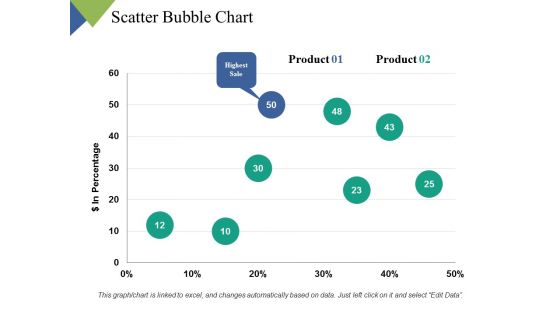
Scatter Bubble Chart Ppt PowerPoint Presentation Inspiration Graphics Tutorials
This is a scatter bubble chart ppt powerpoint presentation inspiration graphics tutorials. This is a two stage process. The stages in this process are finance, marketing, management, investment, analysis.
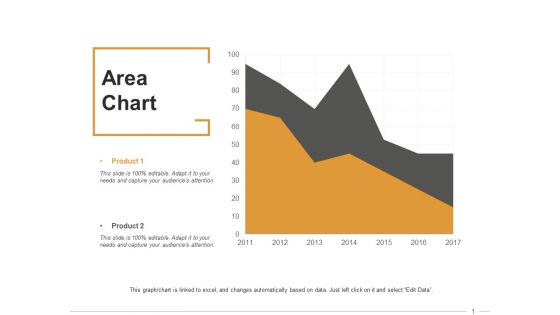
Area Chart Ppt PowerPoint Presentation Infographic Template Clipart Images
This is a area chart ppt powerpoint presentation infographic template clipart images. This is a two stage process. The stages in this process are finance, marketing, management, investment, analysis.
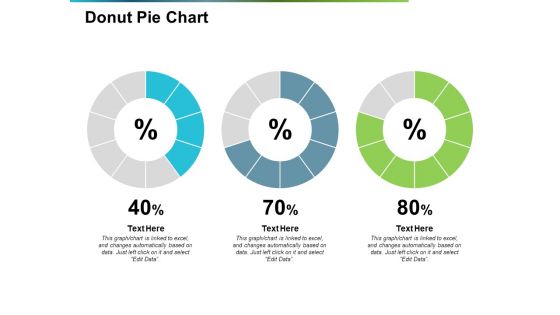
Donut Pie Chart Ppt PowerPoint Presentation Show Graphics Download
This is a donut pie chart ppt powerpoint presentation show graphics download. This is a three stage process. The stages in this process are percentage, finance, donut, business, marketing.
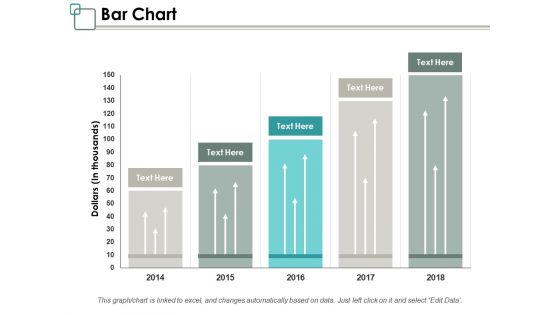
Bar Chart Ppt PowerPoint Presentation Infographic Template Graphics Design
This is a bar chart ppt powerpoint presentation infographic template graphics design. This is a five stage process. The stages in this process are management, marketing, business, percentage, product.
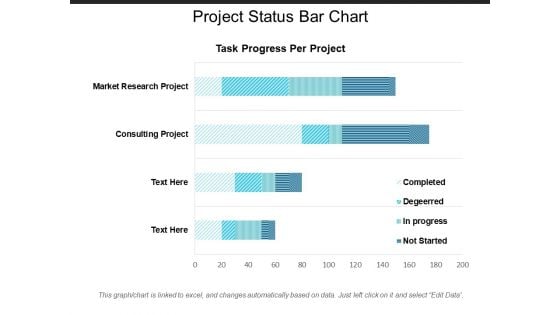
Project Status Bar Chart Ppt PowerPoint Presentation Ideas Objects
This is a project status bar chart ppt powerpoint presentation ideas objects. This is a four stage process. The stages in this process are project management, project progress, project growth.
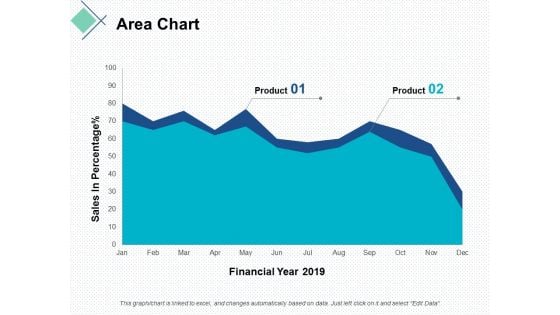
area chart finance ppt powerpoint presentation portfolio graphics download
This is a area chart finance ppt powerpoint presentation portfolio graphics download. This is a two stage process. The stages in this process are finance, marketing, management, investment, analysis.
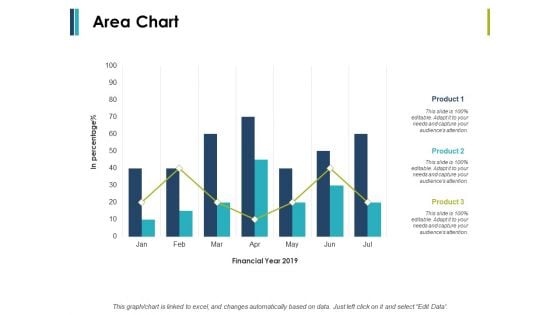
Area Chart Finance Ppt PowerPoint Presentation Infographic Template Model
This is a area chart finance ppt powerpoint presentation infographic template model. This is a two stage process. The stages in this process are finance, marketing, management, investment, analysis.
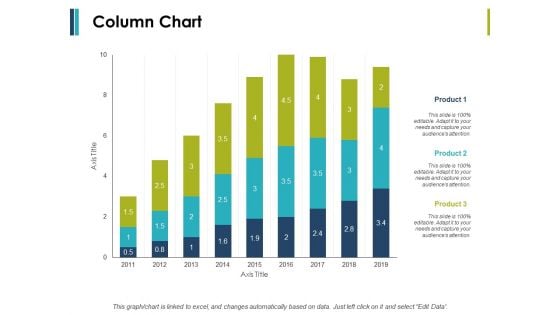
Column Chart And Graph Ppt PowerPoint Presentation File Introduction
This is a column chart and graph ppt powerpoint presentation file introduction. This is a three stage process. The stages in this process are finance, marketing, management, investment, analysis.
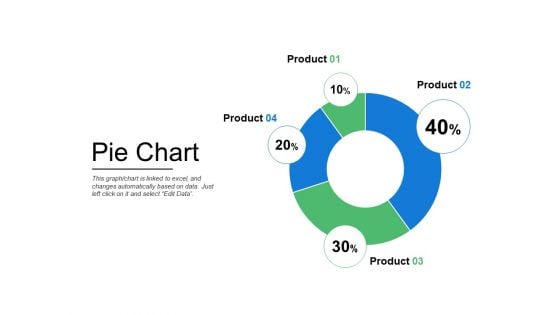
Pie Chart Finance Ppt PowerPoint Presentation Infographics Mockup
This is a pie chart finance ppt powerpoint presentation infographics mockup . This is a four stage process. The stages in this process are finance, marketing, management, investment, analysis.
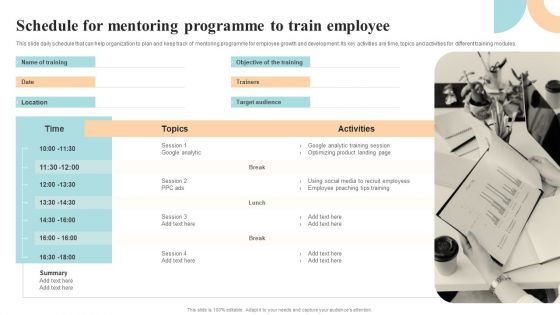
Workforce Growth And Improvement Schedule For Mentoring Programme To Train Employee Pictures PDF
This slide daily schedule that can help organization to plan and keep track of mentoring programme for employee growth and development. Its key activities are time, topics and activities for different training modules. Take your projects to the next level with our ultimate collection of Workforce Growth And Improvement Schedule For Mentoring Programme To Train Employee Pictures PDF. Slidegeeks has designed a range of layouts that are perfect for representing task or activity duration, keeping track of all your deadlines at a glance. Tailor these designs to your exact needs and give them a truly corporate look with your own brand colors theyll make your projects stand out from the rest.
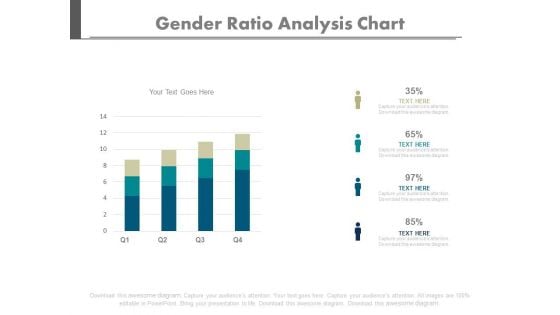
Four Bars Gender Population Ratio Chart Powerpoint Slides
Create dynamic presentations with our creative template of bar graph. This diagram may be used to present gender population. Download this template to leave permanent impression on your audience.

Business 2013 New Year Success PowerPoint Templates And PowerPoint Themes 0712
Business 2013 New Year Success PowerPoint Templates And PowerPoint Themes Business Power Points-Microsoft Powerpoint Templates and Background with financial and business chart Establish control with our Business 2013 New Year Success PowerPoint Templates And PowerPoint Themes 0712. Let your thoughts take the reins.
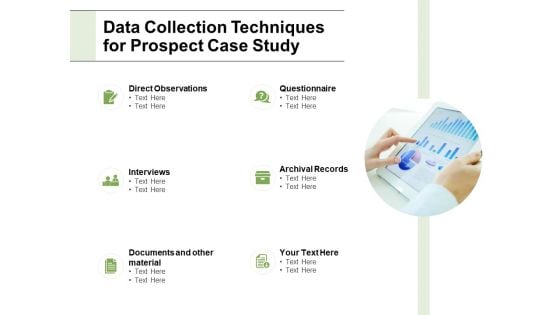
Data Collection Techniques For Prospect Case Study Ppt PowerPoint Presentation File Graphics Design
Presenting this set of slides with name data collection techniques for prospect case study ppt powerpoint presentation file graphics design. This is a six stage process. The stages in this process are techniques, questionnaire, observations, material, documents. This is a completely editable PowerPoint presentation and is available for immediate download. Download now and impress your audience.

Donation Based Crowdfunding Ppt PowerPoint Presentation Pictures Guide
This is a donation based crowdfunding ppt powerpoint presentation pictures guide. This is a five stage process. The stages in this process are art, music and recording art, films and performing art.
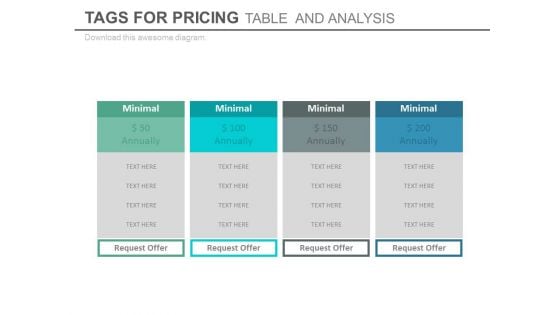
Pricing Comparison Table For Analysis Powerpoint Slides
This PowerPoint template has been designed with pricing comparison table. This PowerPoint template may be used to present pricing strategy. Prove the viability of your ideas using this impressive slide.
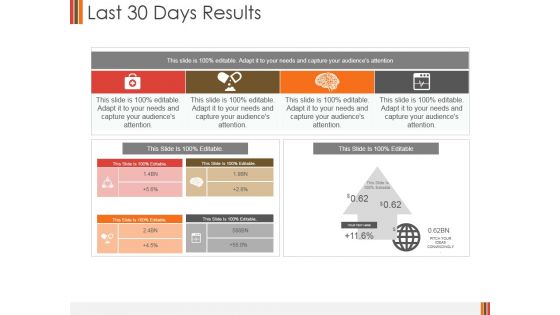
Last 30 Days Results Ppt PowerPoint Presentation Layouts Shapes
This is a last 30 days results ppt powerpoint presentation layouts shapes. This is a four stage process. The stages in this process are business, finance, management, analysis, strategy, success.
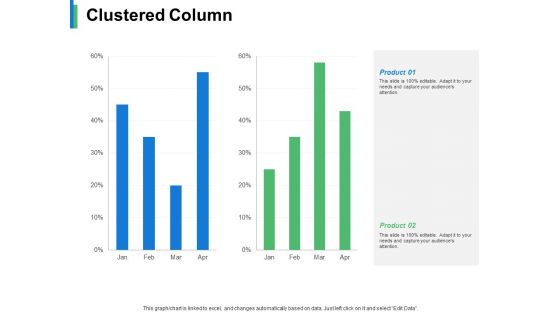
Clustered Column Product Ppt PowerPoint Presentation Inspiration Infographic Template
This is a clustered column product ppt powerpoint presentation inspiration infographic template. This is a two stage process. The stages in this process are business, management, marketing, strategy, sales.
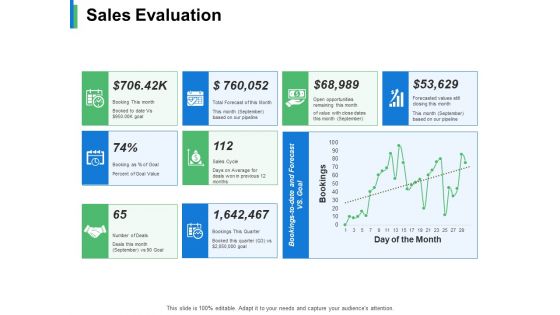
Sales Evaluation Ppt PowerPoint Presentation Infographic Template Format Ideas
This is a sales evaluation ppt powerpoint presentation infographic template format ideas. This is a three stage process. The stages in this process are business, management, strategy, finance, icons.
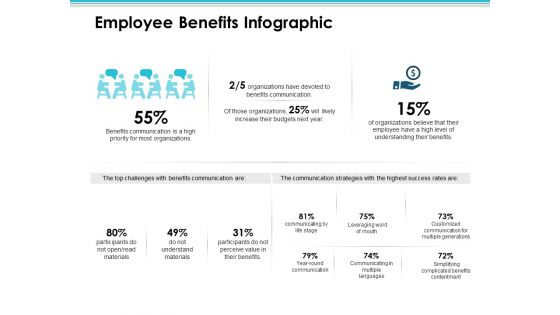
Employee Benefits Infographic Employee Value Proposition Ppt PowerPoint Presentation Styles Diagrams
This is a employee benefits infographic employee value proposition ppt powerpoint presentation styles diagrams. This is a three stage process. The stages in this process are business, management, strategy, analysis, marketing.
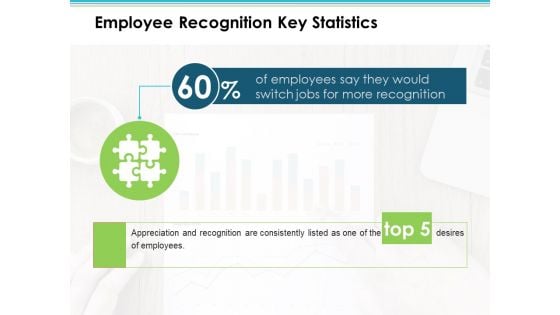
Employee Recognition Key Statistics Employee Value Proposition Ppt PowerPoint Presentation Layouts Mockup
This is a employee recognition key statistics employee value proposition ppt powerpoint presentation layouts mockup. This is a one stage process. The stages in this process are business, management, strategy, analysis, marketing.
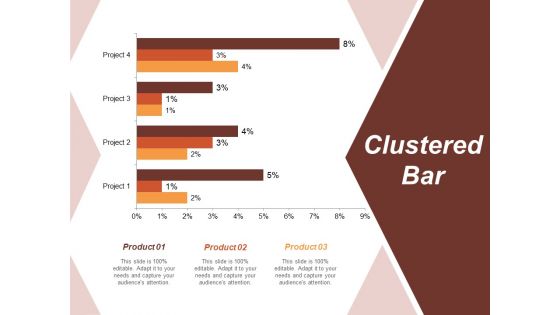
Clustered Bar Risk Estimator Ppt PowerPoint Presentation Layouts Mockup
This is a clustered bar risk estimator ppt powerpoint presentation layouts mockup. This is a four stage process. The stages in this process are business, management, strategy, analysis, marketing.
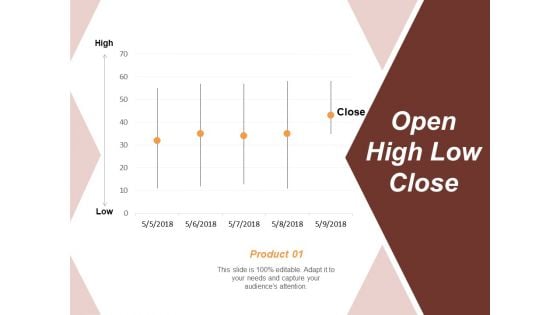
Open High Low Close Risk Estimator Ppt PowerPoint Presentation Infographics Vector
This is a open high low close risk estimator ppt powerpoint presentation infographics vector. This is a five stage process. The stages in this process are business, management, strategy, analysis, marketing.
Quantitative Risk Analysis Risk Estimator Ppt PowerPoint Presentation Icon Designs
This is a quantitative risk analysis risk estimator ppt powerpoint presentation icon designs. This is a four stage process. The stages in this process are business, management, strategy, analysis, marketing.
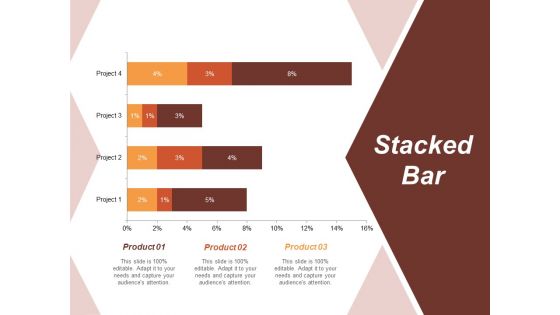
Stacked Bar Risk Estimator Ppt PowerPoint Presentation Gallery Design Templates
This is a stacked bar risk estimator ppt powerpoint presentation gallery design templates. This is a four stage process. The stages in this process are business, management, strategy, analysis, marketing.
Clustered Column Contribution Ppt PowerPoint Presentation Icon Graphics Design
This is a clustered column contribution ppt powerpoint presentation icon graphics design. This is a three stage process. The stages in this process are finance, business, management, strategy, analysis.
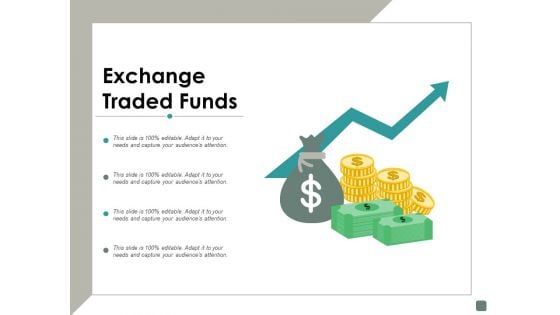
Exchange Traded Funds Contribution Ppt PowerPoint Presentation Infographics Tips
This is a exchange traded funds contribution ppt powerpoint presentation infographics tips. This is a four stage process. The stages in this process are finance, business, management, strategy, analysis.

Fastest Growing Etfs To Invest In Contribution Ppt PowerPoint Presentation Show Layout Ideas
This is a fastest growing etfs to invest in contribution ppt powerpoint presentation show layout ideas. This is a four stage process. The stages in this process are finance, business, management, strategy, analysis.
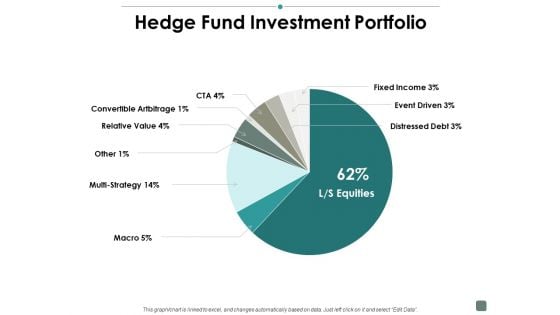
Hedge Fund Investment Portfolio Contribution Ppt PowerPoint Presentation Inspiration Clipart
This is a hedge fund investment portfolio contribution ppt powerpoint presentation inspiration clipart. This is a nine stage process. The stages in this process are finance, business, management, strategy, analysis.

Stocks Best And Worst Performance Contribution Ppt PowerPoint Presentation Gallery Tips
This is a stocks best and worst performance contribution ppt powerpoint presentation gallery tips. This is a two stage process. The stages in this process are finanace, marketing, business, management, strategy.
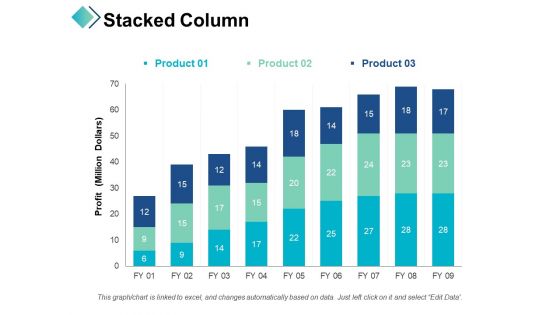
Stacked Column Profit Business Ppt PowerPoint Presentation Infographics Master Slide
This is a stacked column profit business ppt powerpoint presentation infographics master slide. This is a three stage process. The stages in this process are finance, strategy, analysis, business, marketing.
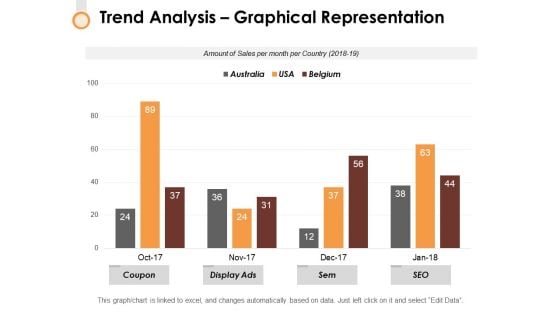
Trend Analysis Graphical Representation Ppt PowerPoint Presentation Portfolio Images
This is a trend analysis graphical representation ppt powerpoint presentation portfolio images. This is a three stage process. The stages in this process are finance, strategy, marketing, management, business.
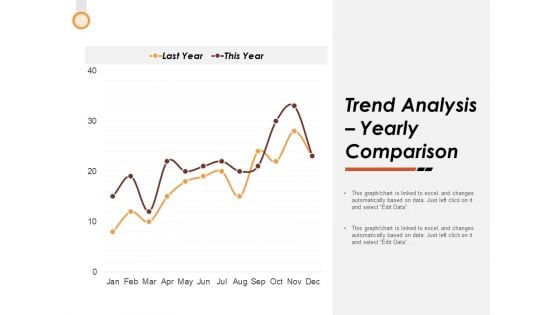
Trend Analysis Yearly Comparison Ppt PowerPoint Presentation Summary Visual Aids
This is a trend analysis yearly comparison ppt powerpoint presentation summary visual aids. This is a two stage process. The stages in this process are finance, strategy, marketing, management, business.
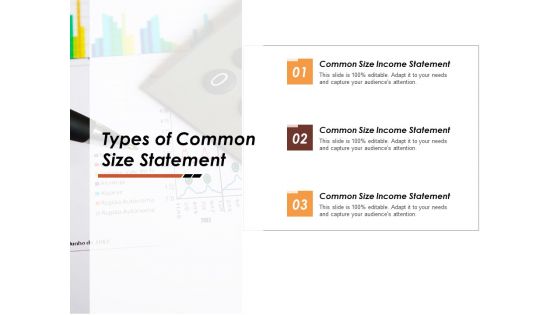
Types Of Common Size Statement Ppt PowerPoint Presentation Model Example
This is a types of common size statement ppt powerpoint presentation model example. This is a three stage process. The stages in this process are business, management, analysis, strategy, marketing.
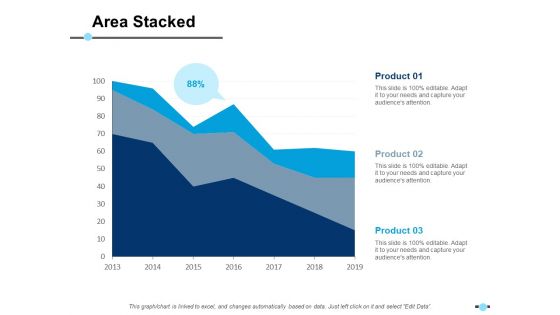
Area Stacked Product Finance Ppt PowerPoint Presentation Ideas Skills
This is a area stacked product finance ppt powerpoint presentation ideas skills. This is a three stage process. The stages in this process are finance, management, strategy, analysis, marketing.
Clustered Column Line Product Finance Ppt PowerPoint Presentation Icon Infographics
This is a clustered column line product finance ppt powerpoint presentation icon infographics. This is a three stage process. The stages in this process are finance, management, strategy, analysis, marketing.


 Continue with Email

 Home
Home


