Financial
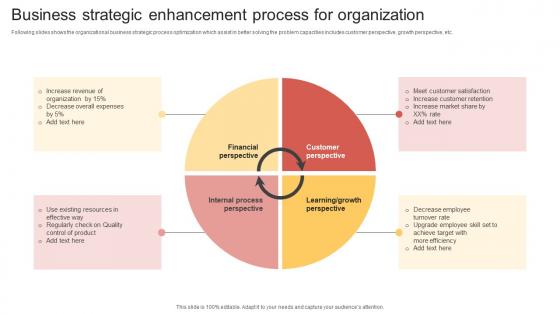
Business Strategic Enhancement Process For Organization Infographics Pdf
Following slides shows the organizational business strategic process optimization which assist in better solving the problem capacities includes customer perspective, growth perspective, etc. Pitch your topic with ease and precision using this Business Strategic Enhancement Process For Organization Infographics Pdf. This layout presents information on Financial Perspective, Customer Perspective, Growth Perspective. It is also available for immediate download and adjustment. So, changes can be made in the color, design, graphics or any other component to create a unique layout. Following slides shows the organizational business strategic process optimization which assist in better solving the problem capacities includes customer perspective, growth perspective, etc.

Contact Us Healthy And Nutrition Provider Company Investor Funding Elevator Pitch Deck
From laying roadmaps to briefing everything in detail, our templates are perfect for you. You can set the stage with your presentation slides. All you have to do is download these easy-to-edit and customizable templates. Financial Healthy And Nutrition Provider Company Investor Funding Elevator Pitch Deck will help you deliver an outstanding performance that everyone would remember and praise you for. Do download this presentation today. Our Contact Us Healthy And Nutrition Provider Company Investor Funding Elevator Pitch Deck are topically designed to provide an attractive backdrop to any subject. Use them to look like a presentation pro.
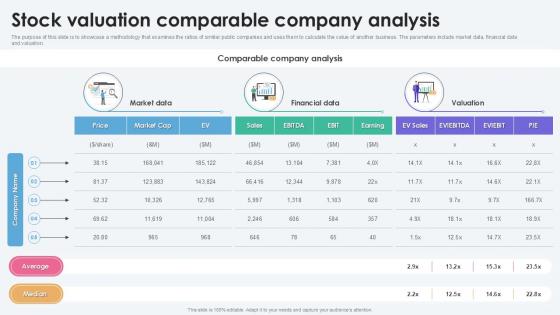
Stock Valuation Comparable Company Analysis
Present like a pro with Stock Valuation Comparable Company Analysis. Create beautiful presentations together with your team, using our easy-to-use presentation slides. Share your ideas in real-time and make changes on the fly by downloading our templates. So whether you are in the office, on the go, or in a remote location, you can stay in sync with your team and present your ideas with confidence. With Slidegeeks presentation got a whole lot easier. Grab these presentations today. The purpose of slide is to represent methodology that evaluate ratios of similar public companies and utilize them to calculate value of another business. The parameters involves market data, financial data and valuation.
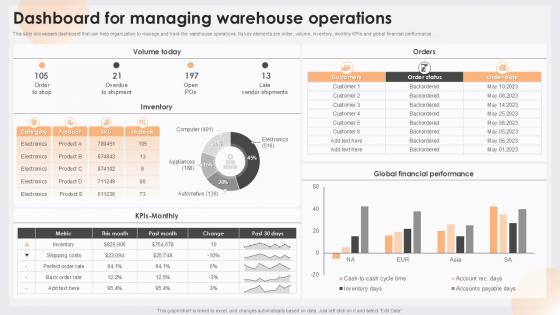
Dashboard For Managing Warehouse Determining Ideal Quantity To Procure Inventor
The best PPT templates are a great way to save time, energy, and resources. Slidegeeks have 100 percent editable powerpoint slides making them incredibly versatile. With these quality presentation templates, you can create a captivating and memorable presentation by combining visually appealing slides and effectively communicating your message. Download Dashboard For Managing Warehouse Determining Ideal Quantity To Procure Inventor from Slidegeeks and deliver a wonderful presentation. This slide depicts a dashboard for managing and tracking warehouse operations. It includes key elements such as order, volume, inventory, monthly KPIs, and global financial performance
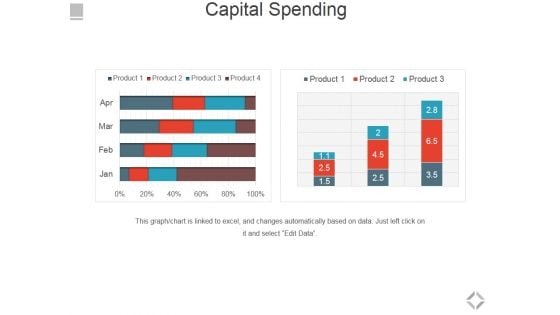
Capital Spending Ppt PowerPoint Presentation Infographics Show
This is a capital spending ppt powerpoint presentation infographics show. This is a two stage process. The stages in this process are capital spending, financials, business, marketing, growth.
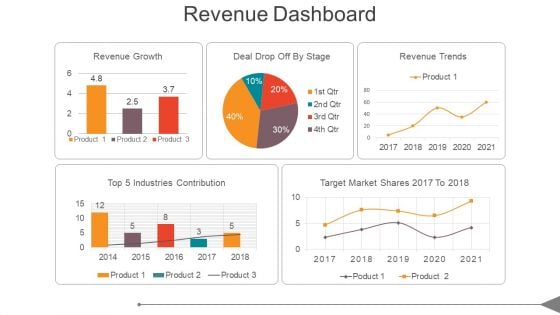
Revenue Dashboard Ppt PowerPoint Presentation Show
This is a revenue dashboard ppt powerpoint presentation show. This is a five stage process. The stages in this process are top 5 industries contribution, revenue growth, deal drop off by stage, revenue trends, target market shares 2017 to 2018.
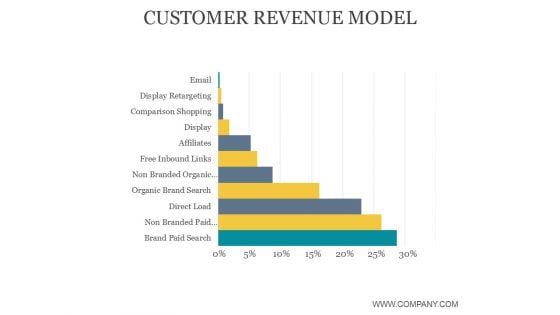
Customer Revenue Model Ppt PowerPoint Presentation Gallery
This is a customer revenue model ppt powerpoint presentation gallery. This is a seven stage process. The stages in this process are brand paid search, display, business, email, display retargeting.
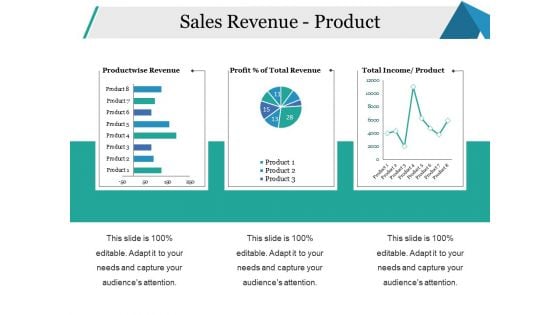
Sales Revenue Product Ppt PowerPoint Presentation Styles Skills
This is a sales revenue product ppt powerpoint presentation styles skills. This is a three stage process. The stages in this process are productwise revenue, income product, business, percentage, strategy.

Improving Business Revenue Bar Graph Ppt PowerPoint Presentation Infographic Template
This is a improving business revenue bar graph ppt powerpoint presentation infographic template. This is a six stage process. The stages in this process are graph, arrow, finance, percentage, success.
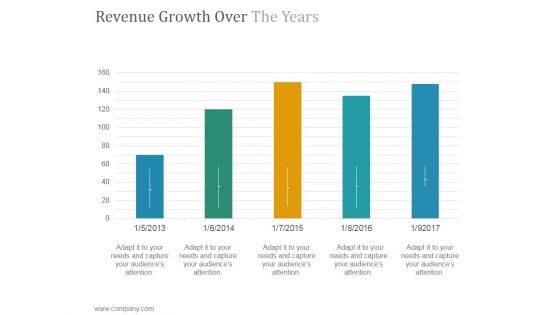
Revenue Growth Over The Years Ppt PowerPoint Presentation Example 2015
This is a revenue growth over the years ppt powerpoint presentation example 2015. This is a five stage process. The stages in this process are success, product, growth, graph, business.
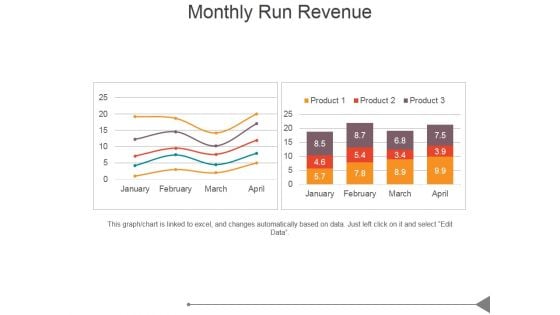
Monthly Run Revenue Ppt PowerPoint Presentation Design Ideas
This is a monthly run revenue ppt powerpoint presentation design ideas. This is a two stage process. The stages in this process are business, marketing, success, bar graph, growth.
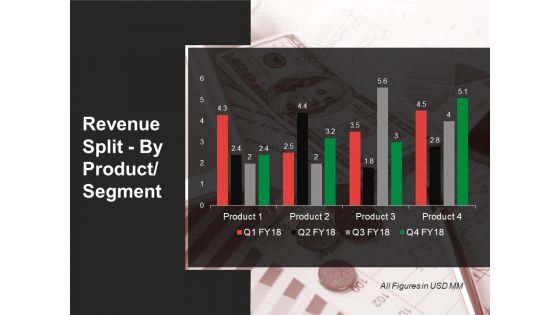
Revenue Split By Product Segment Template 2 Ppt PowerPoint Presentation Infographic Template Smartart
This is a revenue split by product segment template 2 ppt powerpoint presentation infographic template smartart. This is a four stage process. The stages in this process are Product, Business, Marketing, Strategy, Management.
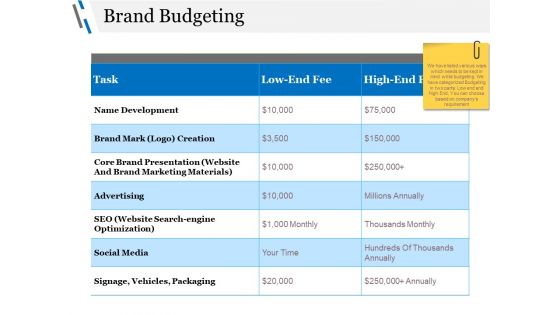
Brand Budgeting Ppt PowerPoint Presentation Model Clipart
This is a brand budgeting ppt powerpoint presentation model clipart. This is a three stage process. The stages in this process are brand mark, advertising, social media, core brand presentation, business.

Budgeting Planned Actual Comparison Ppt PowerPoint Presentation Shapes
This is a budgeting planned actual comparison ppt powerpoint presentation shapes. This is a three stage process. The stages in this process are planned cost, actual cost, value difference, finance, timeline.
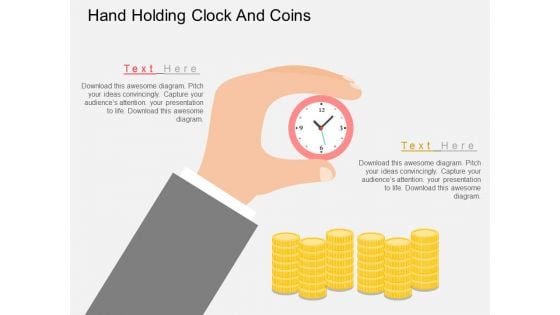
Hand Holding Clock And Coins Powerpoint Template
Our professionally designed business diagram is as an effective tool for communicating business ideas and strategies for corporate planning. It contains graphics of hand holding clock and coins. Download this template to build interactive presentation.
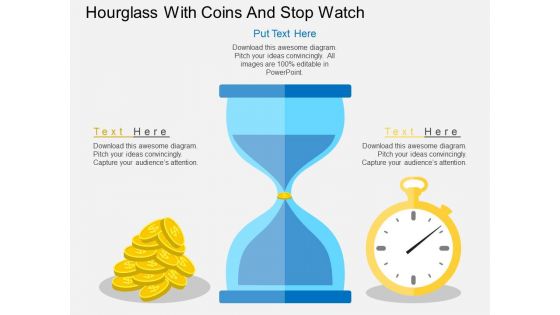
Hourglass With Coins And Stop Watch Powerpoint Template
Our professionally designed business diagram is as an effective tool for communicating business ideas and strategies for corporate planning. It contains graphics of hourglass with coins and stop watch. Download this template to build interactive presentation.
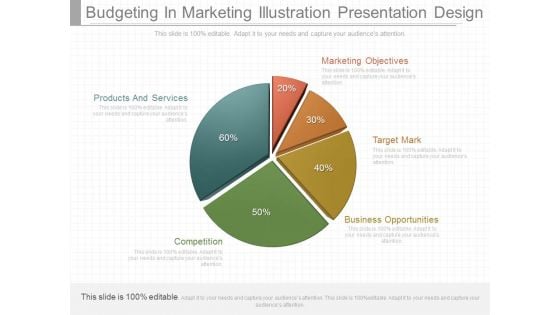
Budgeting In Marketing Illustration Presentation Design
This is a budgeting in marketing illustration presentation design. This is a five stage process. The stages in this process are products and services, marketing objectives, target mark, business opportunities, competition.
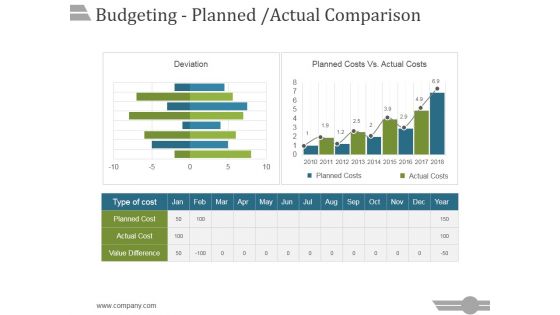
Budgeting Planned Actual Comparison Ppt PowerPoint Presentation Portfolio
This is a budgeting planned actual comparison ppt powerpoint presentation portfolio. This is a three stage process. The stages in this process are business, strategy, marketing, analysis, success, bar graph.
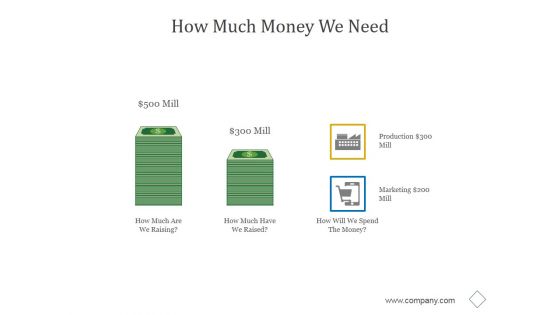
How Much Money We Need Ppt PowerPoint Presentation Pictures
This is a how much money we need ppt powerpoint presentation pictures. This is a two stage process. The stages in this process are business, marketing, management, production, planning.
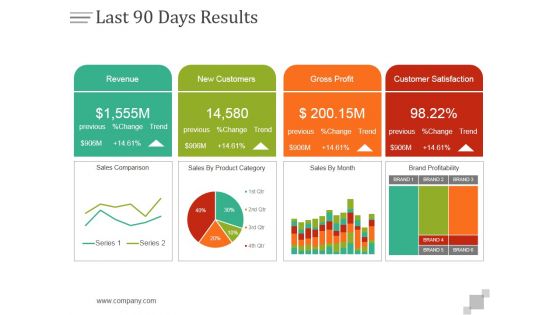
Last 90 Days Results Ppt PowerPoint Presentation Design Templates
This is a last 90 days results ppt powerpoint presentation design templates. This is a four stage process. The stages in this process are revenue, new customers, gross profit, customer satisfaction.

Sales Performance Dashboard Ppt PowerPoint Presentation Good
This is a sales performance dashboard ppt powerpoint presentation good. This is a four stage process. The stages in this process are lead sources revenue share, total sales by month, opportunities total sales by probability, win loss ratio.
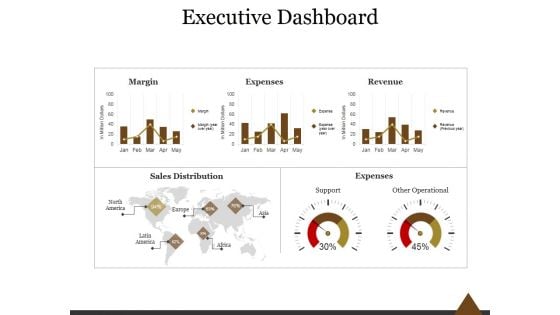
Executive Dashboard Ppt PowerPoint Presentation Professional
This is a executive dashboard ppt powerpoint presentation professional. This is a five stage process. The stages in this process are margin, expenses, revenue, sales distribution, expenses, support, other operational.
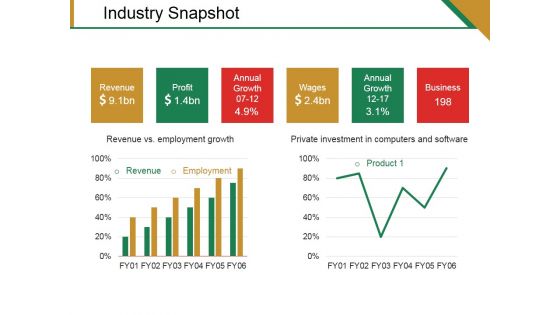
Industry Snapshot Template 1 Ppt PowerPoint Presentation Gallery Design Ideas
This is a industry snapshot template 1 ppt powerpoint presentation gallery design ideas. This is a three stage process. The stages in this process are revenue, profit, annual growth, wages, business.
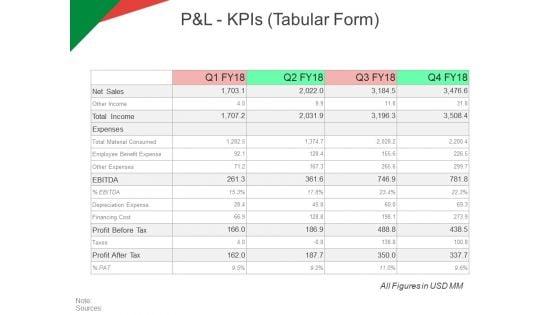
P And L Kpis Tabular Form Ppt PowerPoint Presentation Model Ideas
This is a p and l kpis tabular form ppt powerpoint presentation model ideas. This is a four stage process. The stages in this process are revenue, operating profit, cogs, net profit.
Sales Product Performance Dashboard Ppt PowerPoint Presentation Summary Icon
This is a sales product performance dashboard ppt powerpoint presentation infographics samples. This is a four stage process. The stages in this process are top products in revenue, incremental sales campaign, sales product performance, cost of goods sold.
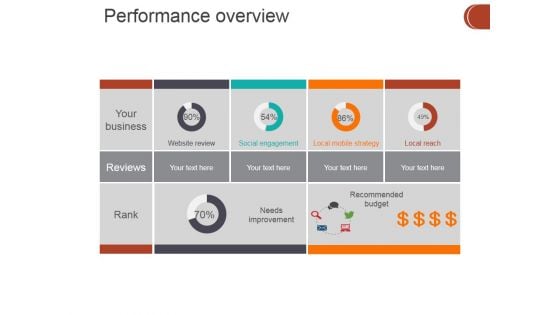
Performance Overview Ppt PowerPoint Presentation Pictures Vector
This is a performance overview ppt powerpoint presentation pictures vector. This is a five stage process. The stages in this process are website review, social engagement, local mobile strategy, local reach, needs improvement , recommended budget.
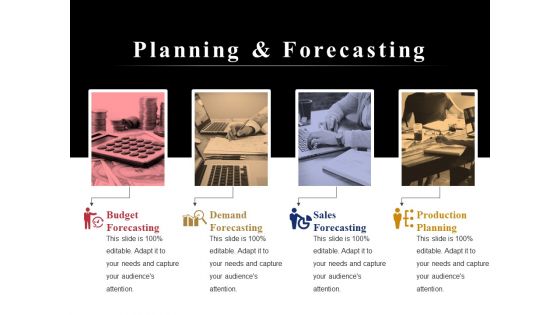
Planning And Forecasting Ppt PowerPoint Presentation Infographic Template Graphics Tutorials
This is a planning and forecasting ppt powerpoint presentation infographic template graphics tutorials. This is a four stage process. The stages in this process are budget forecasting, demand forecasting, sales forecasting, production planning.
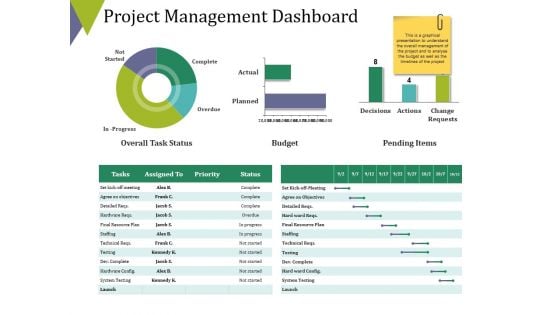
Project Management Dashboard Ppt PowerPoint Presentation Outline Summary
This is a project management dashboard ppt powerpoint presentation outline summary. This is a three stage process. The stages in this process are overall task status, budget, pending items, complete, overdue.
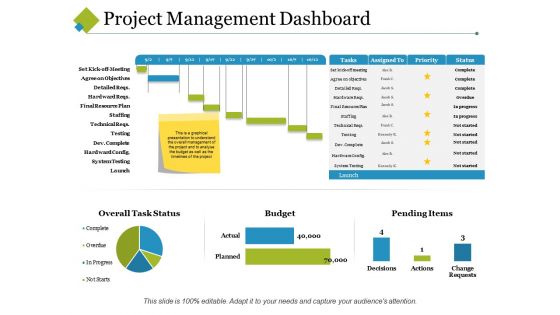
Project Management Dashboard Ppt PowerPoint Presentation Model Graphics Template
This is a project management dashboard ppt powerpoint presentation model graphics template. This is a four stage process. The stages in this process are assigned to, task, priority, cost, budget.
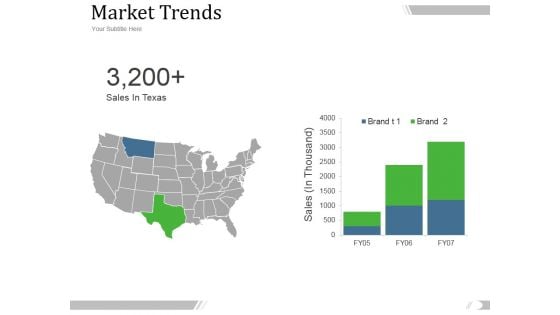
Market Trends Ppt PowerPoint Presentation Sample
This is a market trends ppt powerpoint presentation sample. This is a two stage process. The stages in this process are sales in taxes, sales in thousand, brand, fy.
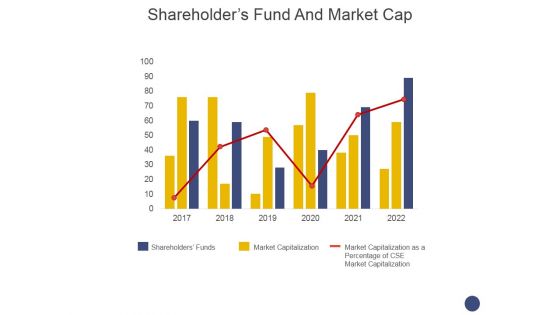
Shareholders Fund And Market Cap Ppt PowerPoint Presentation Show Background Image
This is a shareholders fund and market cap ppt powerpoint presentation show background image. This is a three stage process. The stages in this process are shareholders funds, market capitalization, market capitalization as a percentage of cse market capitalization.
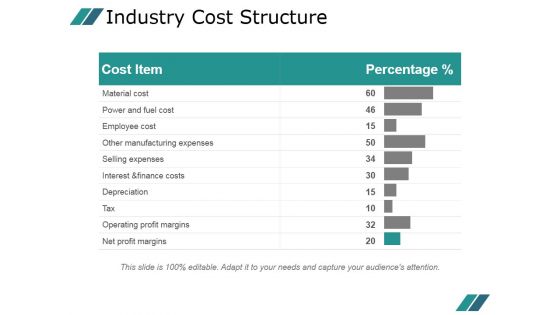
Industry Cost Structure Template 2 Ppt PowerPoint Presentation Topics
This is a industry cost structure template 2 ppt powerpoint presentation topics. This is a ten stage process. The stages in this process are material cost, power and fuel cost, employee cost, other manufacturing expenses, selling expenses, interest and finance costs, depreciation, tax, operating profit margins, net profit margins.
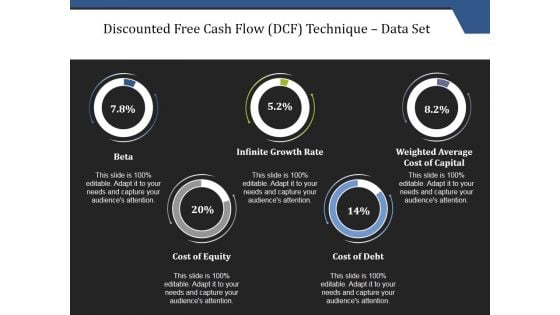
Discounted Free Cash Flow Dcf Technique Data Set Ppt PowerPoint Presentation File Inspiration
This is a discounted free cash flow dcf technique data set ppt powerpoint presentation file inspiration. This is a five stage process. The stages in this process are beta, infinite growth rate, weighted average cost of capital, cost of equity, cost of debt.
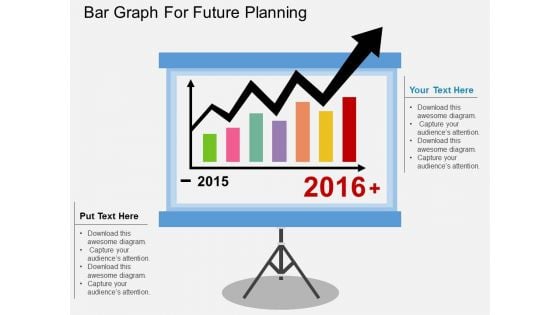
Bar Graph For Future Planning Powerpoint Template
This business diagram display bar graph for years 2015 and 2016. You may use this slide to display statistical analysis. This diagram provides an effective way of displaying information you can edit text, color, shade and style as per you need.

3D Men Icon With Percentage Values Powerpoint Templates
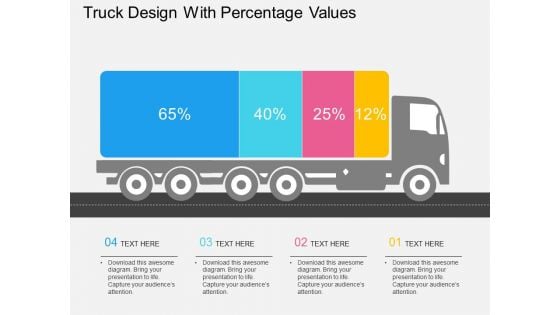
Truck Design With Percentage Values Powerpoint Template
Our compelling template consists with truck design with percentage values. This PPT slide has been professionally designed to exhibit transport and logistics concepts. This template offers an excellent background to build impressive presentation.
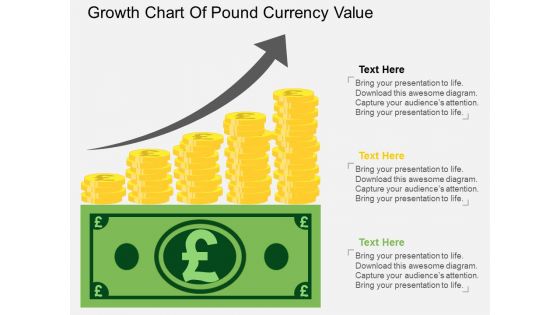
Growth Chart Of Pound Currency Value Powerpoint Template
The above PPT template displays growth chart of Pound currency. This diagram helps to exhibit Pound currency value growth. Adjust the above diagram in your business presentations to visually support your content.
Four Human Hand Icons With Circles Powerpoint Templates
This business slide provides background of four human hands. Display the options, business steps or workflow using this diagram as a tool. You can present your opinions using this impressive slide.
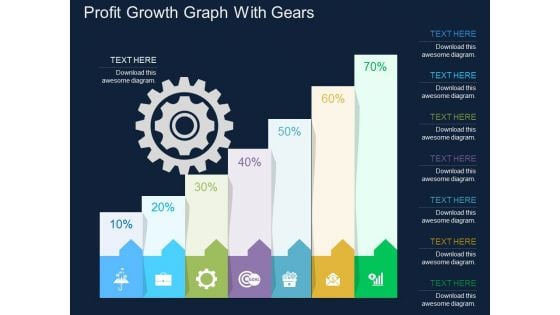
Profit Growth Graph With Gears Powerpoint Template
This business slide contains profit growth graph with gears. This PowerPoint template helps to display outline of business plan. Use this diagram to impart more clarity to data and to create more sound impact on viewers.
Hand Holding Hammer Over A Piggy Bank Powerpoint Templates
Our above business diagram displays vertical process infographic layout. This slide is suitable for to depict marketing and sales steps. Use this business diagram to present your work in a more smart and precise manner.
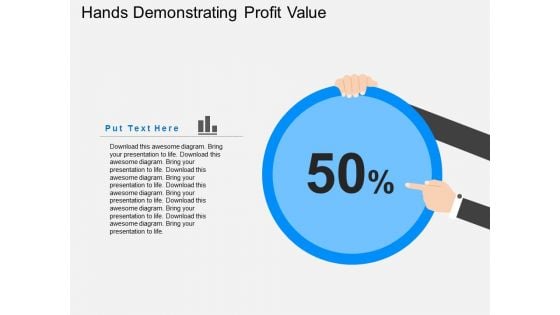
Hands Demonstrating Profit Value Powerpoint Templates
Our above slide contains diagram of zigzag arrow on monitor. It helps to display growth analysis and management. Use this diagram to impart more clarity to information and to create more sound impact on viewers.

Strategy Marketing Pyramid Corporate Strategy Ppt Sample
This is a strategy marketing pyramid corporate strategy ppt sample. This is a four stages process. The stage in this process are circle charts, marketing, business, Finance.\n\n .\n
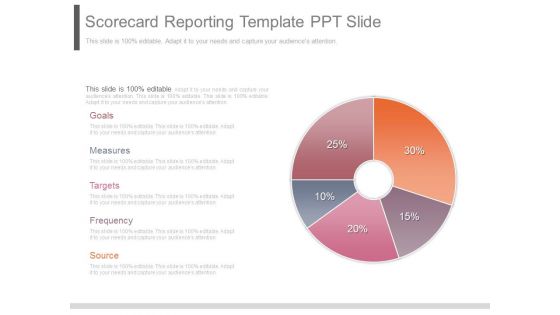
Scorecard Reporting Template Ppt Slide
This is a scorecard reporting template ppt slide. This is a five stage process. The stages in this process are goals, measures, targets, frequency, source.
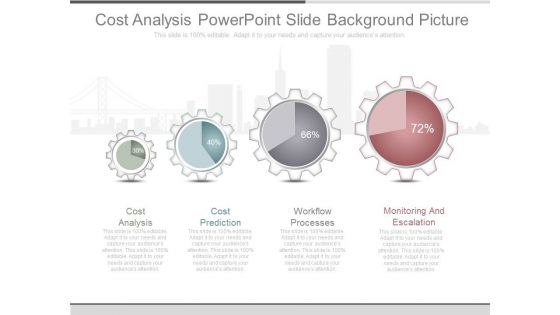
Cost Analysis Powerpoint Slide Background Picture
This is a cost analysis powerpoint slide background picture. This is a four stage process. The stages in this process are cost analysis, cost prediction, workflow processes, monitoring and escalation.
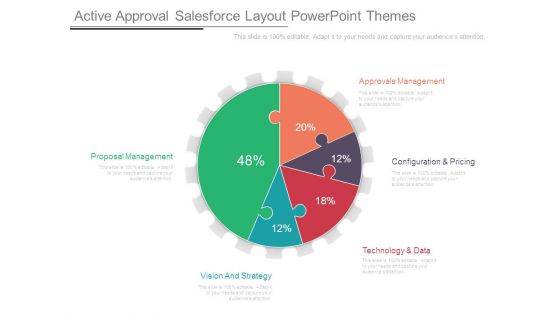
Active Approval Salesforce Layout Powerpoint Themes
This is a active approval salesforce layout powerpoint themes. This is a five stage process. The stages in this process are proposal management, vision and strategy, technology and data, configuration and pricing, approvals management.
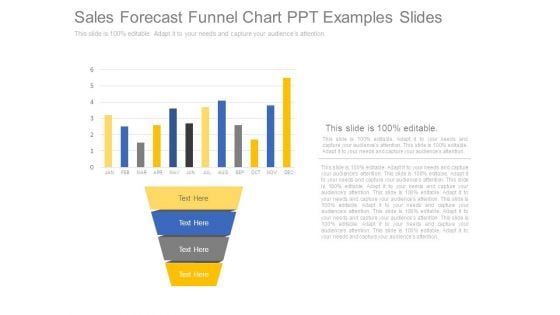
Sales Forecast Funnel Chart Ppt Examples Slides
This is a sales forecast funnel chart ppt examples slides. This is a four stage process. The stages in this process are jan, feb, mar, apr, may, jun, jul, aug, sep, oct, nov, dec.
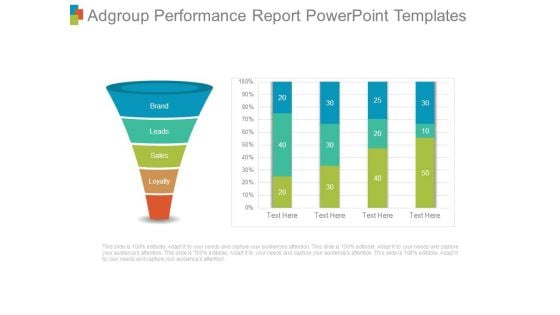
Adgroup Performance Report Powerpoint Templates
This is a adgroup performance report powerpoint templates. This is a four stage process. The stages in this process are brand, leads, sales, loyalty.
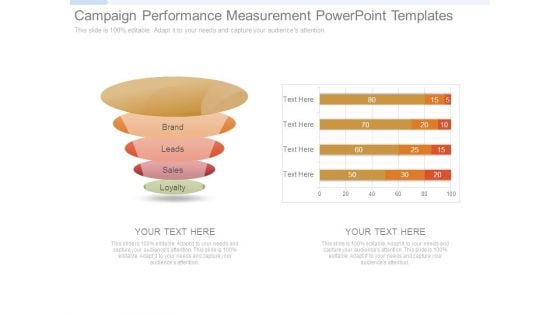
Campaign Performance Measurement Powerpoint Templates
This is a campaign performance measurement powerpoint templates. This is a four stage process. The stages in this process are brand, leads, sales, loyalty.
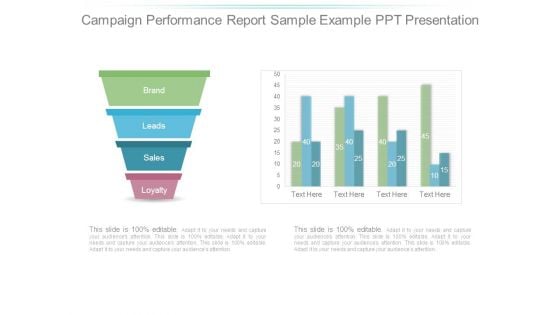
Campaign Performance Report Sample Example Ppt Presentation
This is a campaign performance report sample example ppt presentation. This is a four stage process. The stages in this process are brand, leads, sales, loyalty.
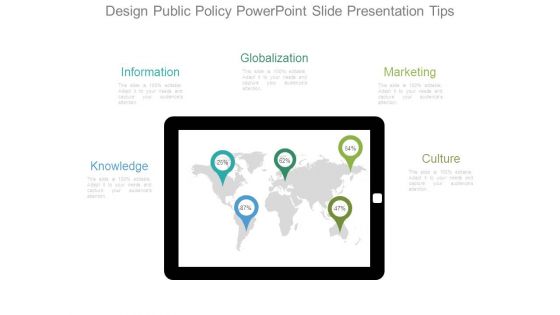
Design Public Policy Powerpoint Slide Presentation Tips
This is a design public policy powerpoint slide presentation tips. This is a five stage process. The stages in this process are target groups, create orders, deliver products, accompany customer, analyse customer, analyse processes.
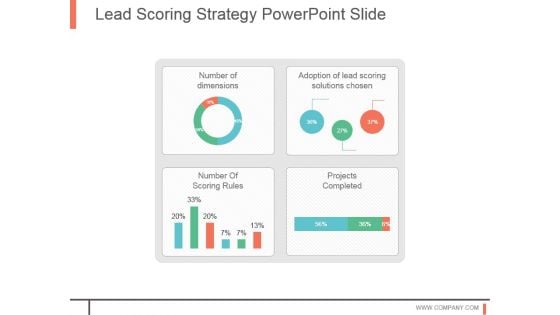
Lead Scoring Strategy Powerpoint Slide
This is a lead scoring strategy powerpoint slide. This is a four stage process. The stages in this process are adoption of lead scoring solutions chosen, projects completed, number of scoring rules, number of dimensions.
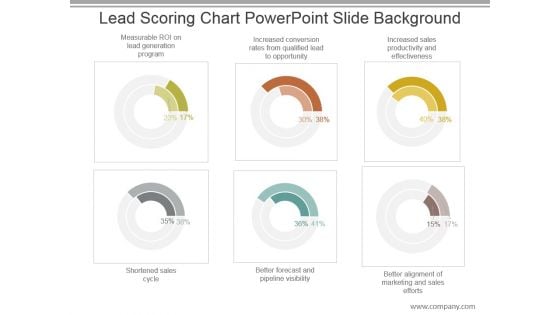
Lead Scoring Chart Powerpoint Slide Background
This is a lead scoring chart powerpoint slide background. This is a six stage process. The stages in this process are measurable roi on lead generation program, increased conversion rates from qualified lead to opportunity, increased sales productivity and effectiveness, shortened sales cycle, better forecast and pipeline visibility, better alignment of marketing and sales efforts.
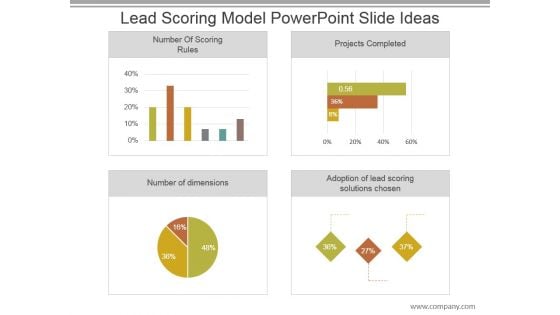
Lead Scoring Model Powerpoint Slide Ideas
This is a lead scoring model powerpoint slide ideas. This is a four stage process. The stages in this process are number of scoring rules, projects completed, number of dimensions, adoption of lead scoring solutions chosen.
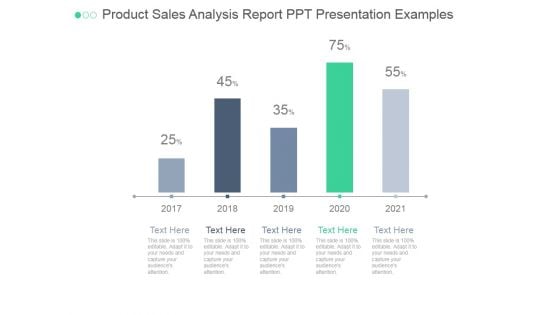
Product Sales Analysis Report Ppt PowerPoint Presentation Good
This is a product sales analysis report ppt powerpoint presentation good. This is a five stage process. The stages in this process are analysis, business, marketing, strategy, success, management, growth.
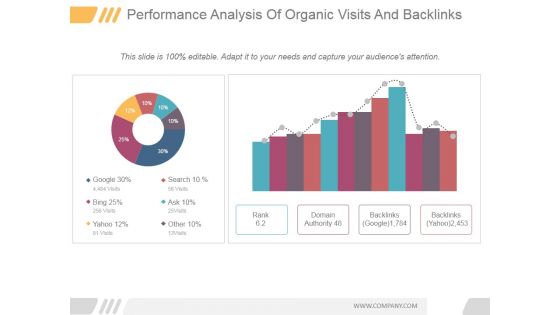
Performance Analysis Of Organic Visits And Backlinks Ppt PowerPoint Presentation Ideas
This is a performance analysis of organic visits and backlinks ppt powerpoint presentation ideas. This is a two stage process. The stages in this process are rank, domain authority, backlinks google, backlinks yahoo, google, bing.
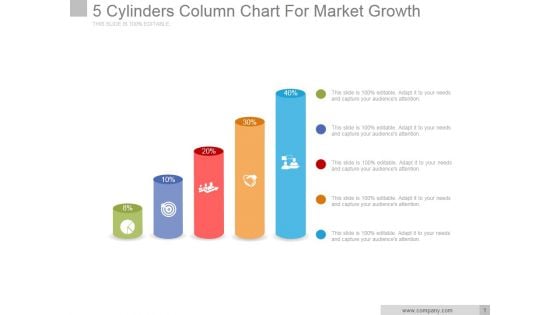
5 Cylinders Column Chart For Market Growth Ppt PowerPoint Presentation Outline
This is a 5 cylinders column chart for market growth ppt powerpoint presentation outline. This is a five stage process. The stages in this process are business, marketing, icons, growth, finance.
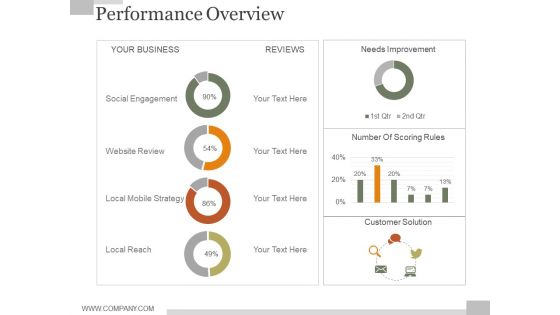
Performance Overview Ppt PowerPoint Presentation Diagrams
This is a performance overview ppt powerpoint presentation diagrams. This is a four stage process. The stages in this process are your business, social engagement, website review, local mobile strategy, local reach, reviews.
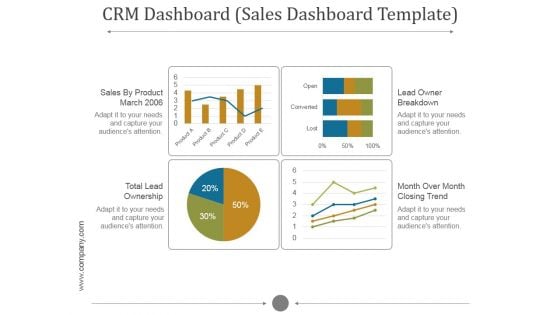
Crm Dashboard Sales Dashboard Template Ppt PowerPoint Presentation Inspiration
This is a crm dashboard sales dashboard template ppt powerpoint presentation inspiration. This is a five stage process. The stages in this process are sales by product march, lead owner breakdown, total lead ownership, month over month closing trend.
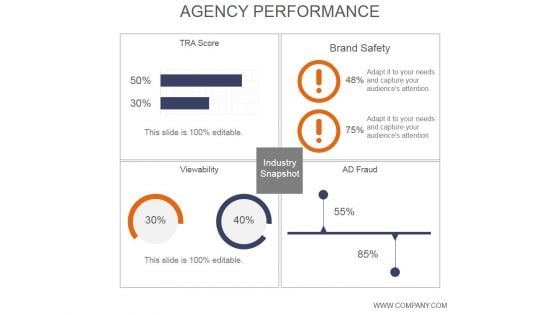
Agency Performance Ppt PowerPoint Presentation Layout
This is a agency performance ppt powerpoint presentation layout. This is a four stage process. The stages in this process are tra score, viewability, industry snapshot, brand safety, ad fraud.
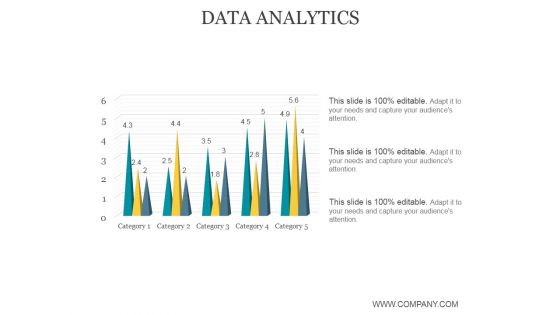
Data Analytics Ppt PowerPoint Presentation Guide
This is a data analytics ppt powerpoint presentation guide. This is a five stage process. The stages in this process are data analysis, business, marketing, success, graph.


 Continue with Email

 Home
Home


