Forecast
Client Requirement And Potential Portfolio Options Investment Fund PPT Slides
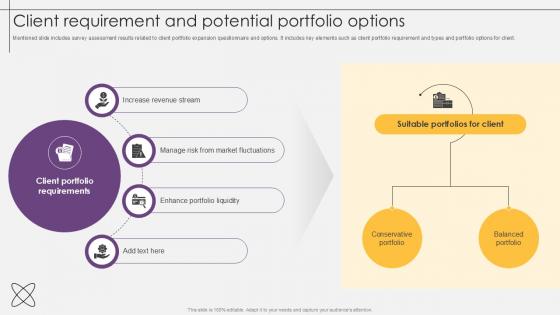
Mentioned slide includes survey assessment results related to client portfolio expansion questionnaire and options.It includes key elements such as client portfolio requirement and types and portfolio options for client. From laying roadmaps to briefing everything in detail, our templates are perfect for you. You can set the stage with your presentation slides. All you have to do is download these easy to edit and customizable templates. Client Requirement And Potential Portfolio Options Investment Fund PPT Slides will help you deliver an outstanding performance that everyone would remember and praise you for. Do download this presentation today. Mentioned slide includes survey assessment results related to client portfolio expansion questionnaire and options.It includes key elements such as client portfolio requirement and types and portfolio options for client.

Stakeholder Concern Analysis For Team Restructuring Business Growth Ppt Sample
This slide mentions the conduct of stakeholder analysis to know their interests and concerns. various elements included are purpose, outcomes, and methods for analysis such as surveys, follow-ups, etc. Want to ace your presentation in front of a live audience Our Stakeholder Concern Analysis For Team Restructuring Business Growth Ppt Sample can help you do that by engaging all the users towards you. Slidegeeks experts have put their efforts and expertise into creating these impeccable powerpoint presentations so that you can communicate your ideas clearly. Moreover, all the templates are customizable, and easy-to-edit and downloadable. Use these for both personal and commercial use. This slide mentions the conduct of stakeholder analysis to know their interests and concerns. various elements included are purpose, outcomes, and methods for analysis such as surveys, follow ups, etc.
Customer Support Software To Minimize Improving Customer Retention PPT Presentation
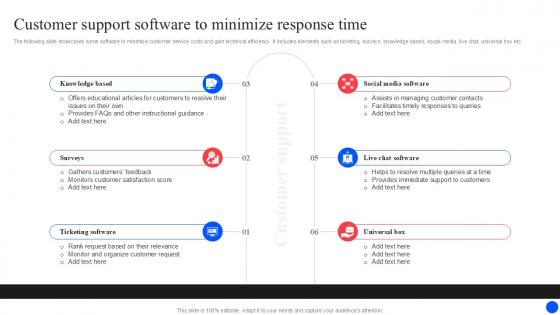
The following slide showcases some software to minimize customer service costs and gain technical efficiency. It includes elements such as ticketing, surveys, knowledge based, social media, live chat, universal box etc. Whether you have daily or monthly meetings, a brilliant presentation is necessary. Customer Support Software To Minimize Improving Customer Retention PPT Presentation can be your best option for delivering a presentation. Represent everything in detail using Customer Support Software To Minimize Improving Customer Retention PPT Presentation and make yourself stand out in meetings. The template is versatile and follows a structure that will cater to your requirements. All the templates prepared by Slidegeeks are easy to download and edit. Our research experts have taken care of the corporate themes as well. So, give it a try and see the results. The following slide showcases some software to minimize customer service costs and gain technical efficiency. It includes elements such as ticketing, surveys, knowledge based, social media, live chat, universal box etc.
Summarizing Food Quality Issues Effective Strategies For Strengthening Food Ppt Template
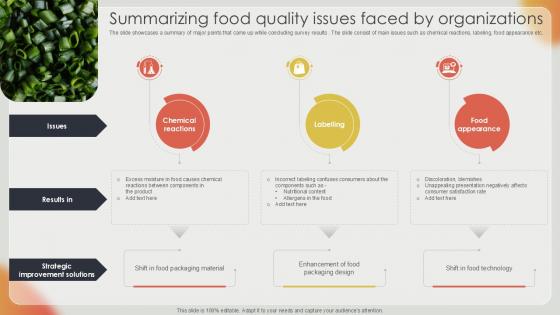
The slide showcases a summary of major points that came up while concluding survey results . The slide consist of main issues such as chemical reactions, labeling, food appearance etc. Get a simple yet stunning designed Summarizing Food Quality Issues Effective Strategies For Strengthening Food Ppt Template. It is the best one to establish the tone in your meetings. It is an excellent way to make your presentations highly effective. So, download this PPT today from Slidegeeks and see the positive impacts. Our easy-to-edit Summarizing Food Quality Issues Effective Strategies For Strengthening Food Ppt Template can be your go-to option for all upcoming conferences and meetings. So, what are you waiting for Grab this template today. The slide showcases a summary of major points that came up while concluding survey results . The slide consist of main issues such as chemical reactions, labeling, food appearance etc.
Tactics To Improve Efficiency Of Effective Strategies To Succeed At Virtual Ppt Slide SA SS V
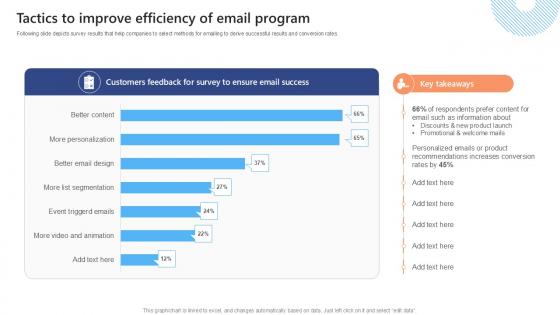
Following slide depicts survey results that help companies to select methods for emailing to derive successful results and conversion rates. This Tactics To Improve Efficiency Of Effective Strategies To Succeed At Virtual Ppt Slide SA SS V from Slidegeeks makes it easy to present information on your topic with precision. It provides customization options, so you can make changes to the colors, design, graphics, or any other component to create a unique layout. It is also available for immediate download, so you can begin using it right away. Slidegeeks has done good research to ensure that you have everything you need to make your presentation stand out. Make a name out there for a brilliant performance. Following slide depicts survey results that help companies to select methods for emailing to derive successful results and conversion rates.
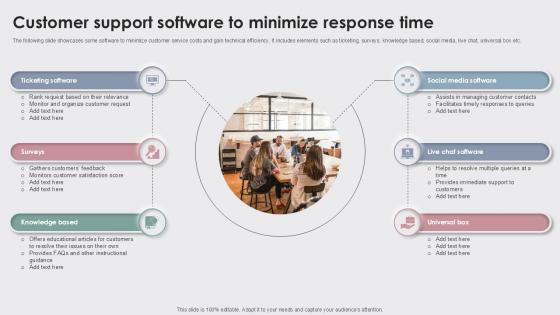
Customer Support Software To Enhancing Customer Experience Ppt Sample
The following slide showcases some software to minimize customer service costs and gain technical efficiency. It includes elements such as ticketing, surveys, knowledge based, social media, live chat, universal box etc. Whether you have daily or monthly meetings, a brilliant presentation is necessary. Customer Support Software To Enhancing Customer Experience Ppt Sample can be your best option for delivering a presentation. Represent everything in detail using Customer Support Software To Enhancing Customer Experience Ppt Sample and make yourself stand out in meetings. The template is versatile and follows a structure that will cater to your requirements. All the templates prepared by Slidegeeks are easy to download and edit. Our research experts have taken care of the corporate themes as well. So, give it a try and see the results. The following slide showcases some software to minimize customer service costs and gain technical efficiency. It includes elements such as ticketing, surveys, knowledge based, social media, live chat, universal box etc.
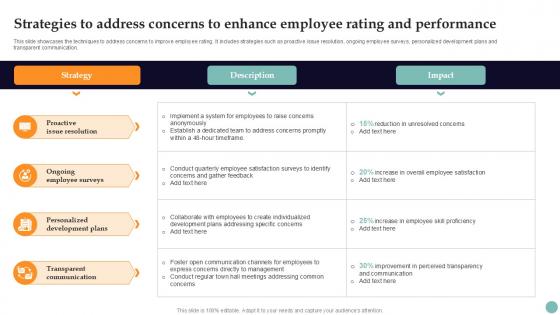
Strategies To Address Concerns Improving Employee Performance PPT Presentation Strategy SS V
This slide showcases the techniques to address concerns to improve employee rating. It includes strategies such as proactive issue resolution, ongoing employee surveys, personalized development plans and transparent communication. Do you know about Slidesgeeks Strategies To Address Concerns Improving Employee Performance PPT Presentation Strategy SS V These are perfect for delivering any kind od presentation. Using it, create PowerPoint presentations that communicate your ideas and engage audiences. Save time and effort by using our pre-designed presentation templates that are perfect for a wide range of topic. Our vast selection of designs covers a range of styles, from creative to business, and are all highly customizable and easy to edit. Download as a PowerPoint template or use them as Google Slides themes. This slide showcases the techniques to address concerns to improve employee rating. It includes strategies such as proactive issue resolution, ongoing employee surveys, personalized development plans and transparent communication.
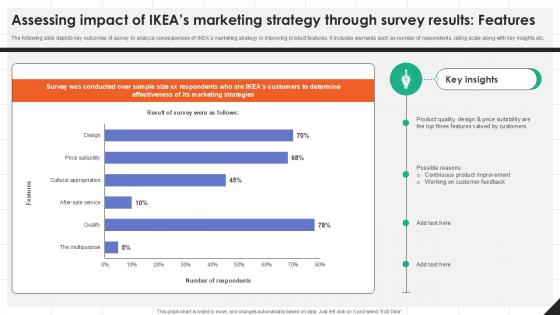
Assessing Impact Of IKEAs Marketing IKEAs Successful Market Expansion PPT Powerpoint Strategy SS V
The following slide depicts key outcomes of survey to analyze consequences of IKEAs marketing strategy in improving product features. It includes elements such as number of respondents, rating scale along with key insights etc. Boost your pitch with our creative Assessing Impact Of IKEAs Marketing IKEAs Successful Market Expansion PPT Powerpoint Strategy SS V. Deliver an awe-inspiring pitch that will mesmerize everyone. Using these presentation templates you will surely catch everyones attention. You can browse the ppts collection on our website. We have researchers who are experts at creating the right content for the templates. So you do not have to invest time in any additional work. Just grab the template now and use them. The following slide depicts key outcomes of survey to analyze consequences of IKEAs marketing strategy in improving product features. It includes elements such as number of respondents, rating scale along with key insights etc.
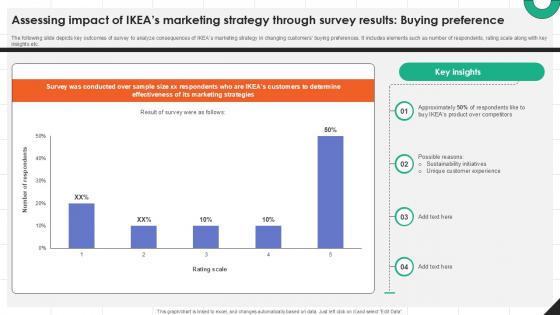
Assessing Impact Of IKEAs Marketing Strategy IKEAs Successful Market Expansion PPT Template Strategy SS V
The following slide depicts key outcomes of survey to analyze consequences of IKEAs marketing strategy in changing customers buying preferences. It includes elements such as number of respondents, rating scale along with key insights etc. Create an editable Assessing Impact Of IKEAs Marketing Strategy IKEAs Successful Market Expansion PPT Template Strategy SS V that communicates your idea and engages your audience. Whether you are presenting a business or an educational presentation, pre-designed presentation templates help save time. Assessing Impact Of IKEAs Marketing Strategy IKEAs Successful Market Expansion PPT Template Strategy SS V is highly customizable and very easy to edit, covering many different styles from creative to business presentations. Slidegeeks has creative team members who have crafted amazing templates. So, go and get them without any delay. The following slide depicts key outcomes of survey to analyze consequences of IKEAs marketing strategy in changing customers buying preferences. It includes elements such as number of respondents, rating scale along with key insights etc.

IKEAs Customer Research Strategy IKEAs Successful Market Expansion PPT Example Strategy SS V
The following slide represents how IKEAs customer research strategy assisted in understanding buyers needs and improving product .It includes elements such as user testing, customer surveys, social listening, data analysis etc. This IKEAs Customer Research Strategy IKEAs Successful Market Expansion PPT Example Strategy SS V from Slidegeeks makes it easy to present information on your topic with precision. It provides customization options, so you can make changes to the colors, design, graphics, or any other component to create a unique layout. It is also available for immediate download, so you can begin using it right away. Slidegeeks has done good research to ensure that you have everything you need to make your presentation stand out. Make a name out there for a brilliant performance. The following slide represents how IKEAs customer research strategy assisted in understanding buyers needs and improving product .It includes elements such as user testing, customer surveys, social listening, data analysis etc.

Approaches To Gather Feedback After Restaurant Opening Strategic Guide To Launching Ppt Presentation
This slide represents key techniques to gather customer feedback after restaurant opening in order to understand customer experience and make necessary changes if needed. It includes comment cards, online surveys, comment box, and staff feedback. Boost your pitch with our creative Approaches To Gather Feedback After Restaurant Opening Strategic Guide To Launching Ppt Presentation. Deliver an awe-inspiring pitch that will mesmerize everyone. Using these presentation templates you will surely catch everyones attention. You can browse the ppts collection on our website. We have researchers who are experts at creating the right content for the templates. So you do not have to invest time in any additional work. Just grab the template now and use them. This slide represents key techniques to gather customer feedback after restaurant opening in order to understand customer experience and make necessary changes if needed. It includes comment cards, online surveys, comment box, and staff feedback.

Domain Shopping E Commerce Technology PowerPoint Templates And PowerPoint Backgrounds 0611
Microsoft PowerPoint Template and Background with the dollar statistic Ascertain goals with our Domain Shopping E Commerce Technology PowerPoint Templates And PowerPoint Backgrounds 0611. Download without worries with our money back guaranteee.

Pie Chart03 Business PowerPoint Templates And PowerPoint Backgrounds 0611
Microsoft PowerPoint Template and Background with businessman holding a blue pie chart for depicting marketing, statistics, presentation and business concepts Your ideas will raise the stocks. Gain equity with our Pie Chart03 Business PowerPoint Templates And PowerPoint Backgrounds 0611.

Golden Bar Graph Business PowerPoint Templates And PowerPoint Backgrounds 0611
Microsoft PowerPoint Template and Background with golden bar graph business statistics mind You will find our Golden Bar Graph Business PowerPoint Templates And PowerPoint Backgrounds 0611 are cut out for it. Designed to draw in audience appreciation.

Lifting The Graph Business PowerPoint Templates And PowerPoint Backgrounds 0611
Microsoft PowerPoint Template and Background with lifting the bar golden business bar graph statistics Spice up the discourse with our Lifting The Graph Business PowerPoint Templates And PowerPoint Backgrounds 0611. Strengthen the flavour of your thoughts.
Performance Chart PowerPoint Icon C
Microsoft PowerPoint Template and Background with business statistics chart in blue color Lighten your workload with our Performance Chart PowerPoint Icon C. Make sure your presentation gets the attention it deserves.
Performance Chart PowerPoint Icon S
Microsoft PowerPoint Template and Background with business statistics chart in blue color Let your audience feed of your thoughts. Dish them out on our Performance Chart PowerPoint Icon S.

Success Man Business PowerPoint Templates And PowerPoint Backgrounds 0711
Microsoft PowerPoint Template and Background with stay on success and rising statistics Verbalize your views with our Success Man Business PowerPoint Templates And PowerPoint Backgrounds 0711. Download without worries with our money back guaranteee.

Pie Chart With Coins Finance PowerPoint Templates And PowerPoint Backgrounds 0811
Microsoft PowerPoint Template and Background with pie chart with coins and statistic data Facilitate your discourse with our Pie Chart With Coins Finance PowerPoint Templates And PowerPoint Backgrounds 0811. Add to the amenities at your command.

Pushing Graph Up Business PowerPoint Templates And PowerPoint Backgrounds 0811
Microsoft PowerPoint Template and Background with business team pushing a statistics chart up showing growth Label your success story with our Pushing Graph Up Business PowerPoint Templates And PowerPoint Backgrounds 0811. Make sure your presentation gets the attention it deserves.

Pie Chart With Coins Finance PowerPoint Themes And PowerPoint Slides 0811
Microsoft PowerPoint Theme and slide with pie chart with coins and statistic data Our Pie Chart With Coins Finance PowerPoint Themes And PowerPoint Slides 0811 are more than just a facelift. They actually add to the depth of your views.

Pushing Graph Up Business PowerPoint Themes And PowerPoint Slides 0811
Microsoft PowerPoint Theme and slide with business team pushing a statistics chart up showing growth Chase down your thoughts with our Pushing Graph Up Business PowerPoint Themes And PowerPoint Slides 0811. They will create a heady concoction.

Success Man Business PowerPoint Themes And PowerPoint Slides 0711
Microsoft PowerPoint Theme and Slide with stay on success and rising statistics Anything extra always attracts. Our Success Man Business PowerPoint Themes And PowerPoint Slides 0711 will leave you absolutely delighted.

Domain Shopping E Commerce Technology PowerPoint Themes And PowerPoint Slides 0611
Microsoft PowerPoint Theme and Slide with the dollar statistic Get enthusiastic with our Domain Shopping E Commerce Technology PowerPoint Themes And PowerPoint Slides 0611. Encourage your team to better performances.
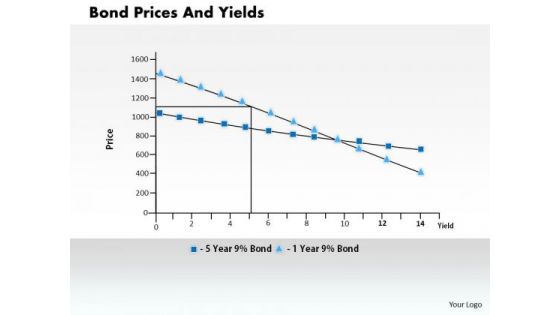
Business Framework Bond Prices And Yields PowerPoint Presentation
This power point diagram slide has been crafted with graphic of statistics of bond price and yields. Display the dependency in-between these two fields with this innovative diagram slide. This slide is very useful for financial presentations.

Business Diagram Business Bar Graph For Data Analysis Presentation Template
This business slide displays pie charts with percentage ratios. This diagram is a data visualization tool that gives you a simple way to present statistical information. This slide helps your audience examines and interprets the data you present.
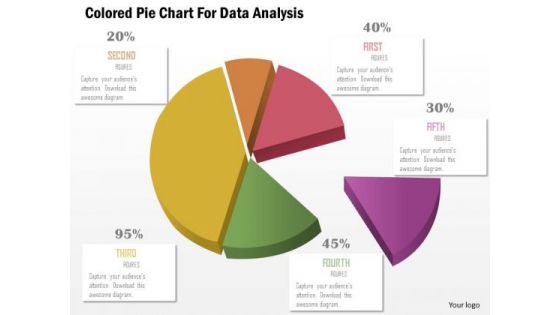
Business Diagram Colored Pie Chart For Data Analysis Presentation Template
This business slide displays pie chart. This diagram is a data visualization tool that gives you a simple way to present statistical information. This slide helps your audience examine and interpret the data you present.
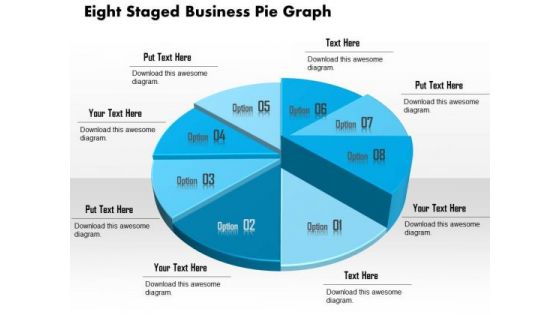
Business Diagram Eight Staged Business Pie Graph Presentation Template
This business slide displays eight staged pie chart. This diagram is a data visualization tool that gives you a simple way to present statistical information. This slide helps your audience examine and interpret the data you present.
Business Diagram Four Staged Triangular Design For Text Display Presentation Template
Four staged triangular design text boxes are used to design this business diagram. This slide can be used to present statistical information in innovative manner Download this slide to earn good impressions from the audience.
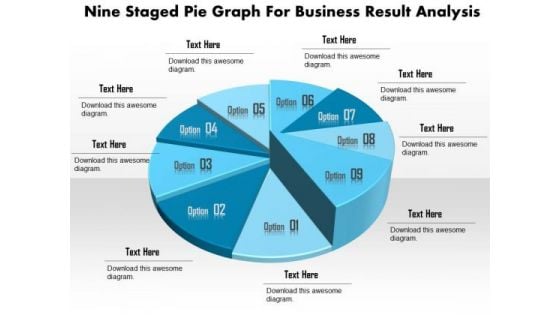
Business Diagram Nine Staged Pie Graph For Business Result Analysis Presentation Template
This business slide displays nine staged pie chart. This diagram is a data visualization tool that gives you a simple way to present statistical information. This slide helps your audience examine and interpret the data you present.
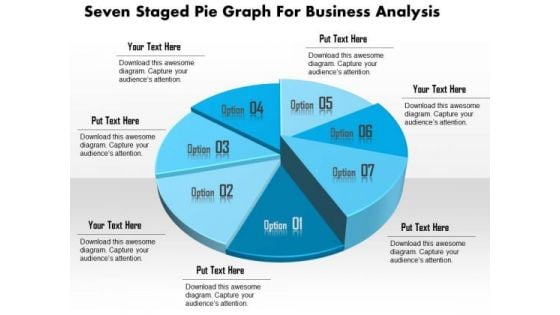
Business Diagram Seven Staged Pie Graph For Business Analysis Presentation Template
This business slide displays seven staged pie chart. This diagram is a data visualization tool that gives you a simple way to present statistical information. This slide helps your audience examine and interpret the data you present.
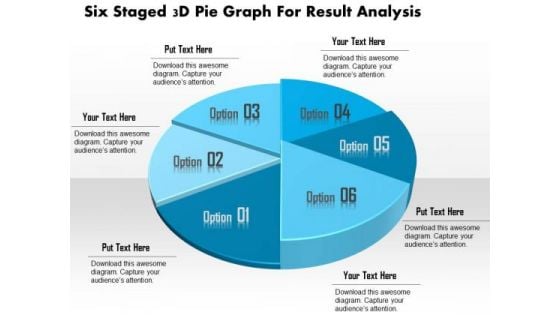
Business Diagram Six Staged 3d Pie Graph For Result Analysis Presentation Template
This business slide displays six staged pie chart. This diagram is a data visualization tool that gives you a simple way to present statistical information. This slide helps your audience examine and interpret the data you present.
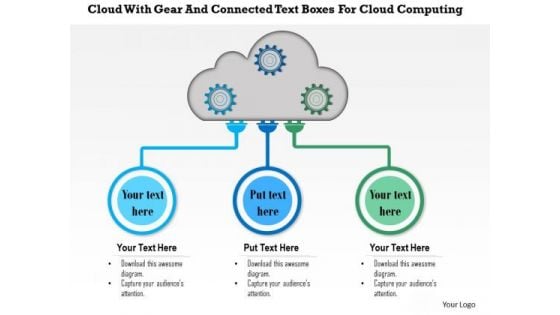
Business Diagram Cloud With Gear And Connected Text Boxes For Cloud Computing Presentation Template
Connected text boxes with clouds and gears are used to design this business diagram. This slide can be used to present statistical information in innovative manner. Download this slide to earn good impressions from the audience.
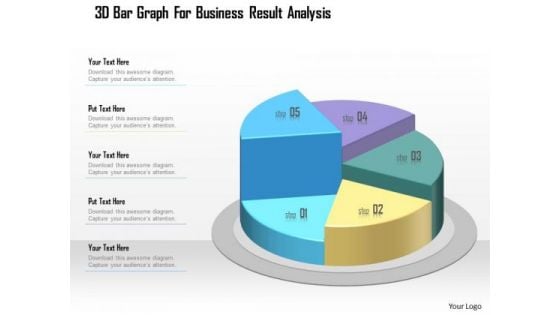
Business Diagram 3d Bar Graph For Business Result Analysis Presentation Template
This business slide displays five staged pie chart. This diagram is a data visualization tool that gives you a simple way to present statistical information. This slide helps your audience examine and interpret the data you present.
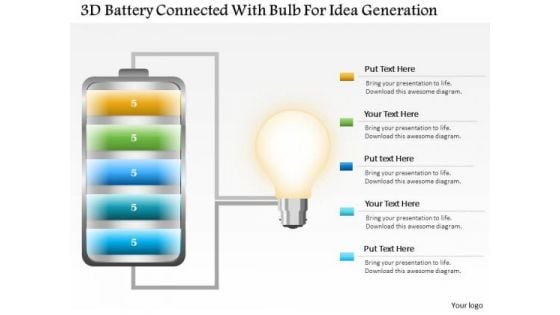
Business Diagram 3d Battery Connected With Bulb For Idea Generation PowerPoint Slide
This business slide displays battery icon connected with bulb. This diagram is a data visualization tool that gives you a simple way to present statistical information. This slide helps your audience examine and interpret the data you present.
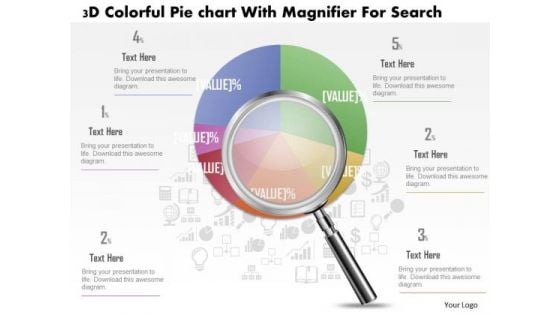
Business Diagram 3d Colorful Pie Graph With Magnifier Data Search PowerPoint Slide
This business slide displays 3d colorful pie graph with magnifier. This diagram is a data visualization tool that gives you a simple way to present statistical information. This slide helps your audience examine and interpret the data you present.
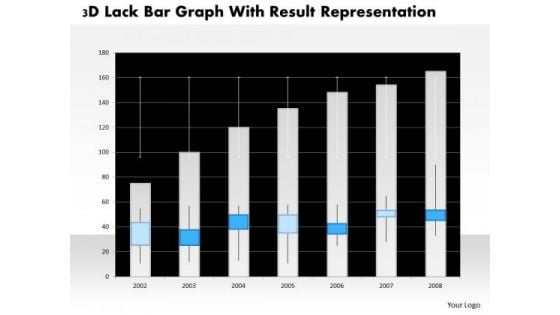
Business Diagram 3d Lack Bar Graph With Result Representation PowerPoint Slide
This business diagram has graphic of 3d lack bar graph. This diagram is a data visualization tool that gives you a simple way to present statistical information. This slide helps your audience examine and interpret the data you present.
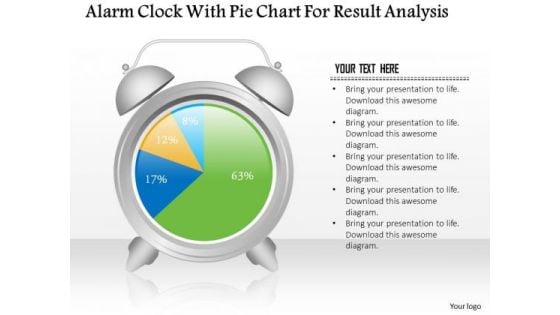
Business Diagram Alarm Clock With Pie Chart For Result Analysis PowerPoint Slide
This business slide displays alarm clock with pie chart. This diagram is a data visualization tool that gives you a simple way to present statistical information. This slide helps your audience examine and interpret the data you present.
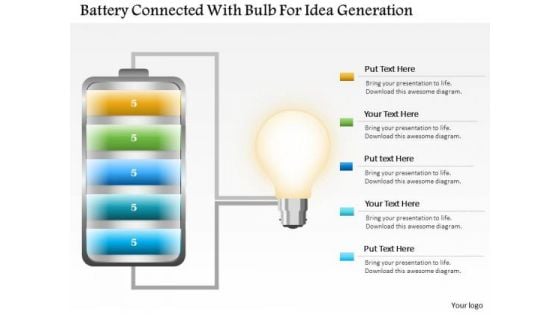
Business Diagram Battery Connected With Bulb For Idea Generation PowerPoint Slide
This business slide displays battery icon connected with bulb. This diagram is a data visualization tool that gives you a simple way to present statistical information. This slide helps your audience examine and interpret the data you present.

Business Diagram Data Driven Bar Graph And Pie Chart For Analysis PowerPoint Slide
This PowerPoint template displays technology gadgets with various business charts. Use this diagram slide, in your presentations to make business reports for statistical analysis. You may use this diagram to impart professional appearance to your presentations.

Business Diagram Data Driven Pie Chart Inside The Magnifier PowerPoint Slide
This business slide displays 3d colorful pie graph with magnifier. This diagram is a data visualization tool that gives you a simple way to present statistical information. This slide helps your audience examine and interpret the data you present.
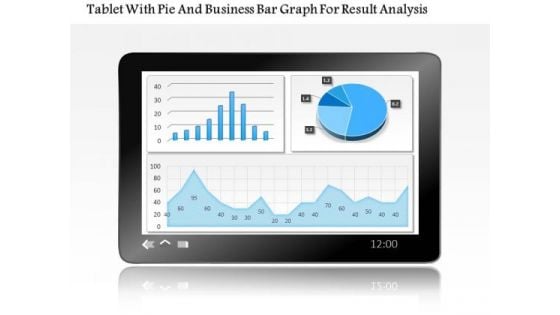
Business Diagram Tablet With Pie And Business Bar Graph For Result Analysis PowerPoint Slide
This PowerPoint template displays technology gadgets with various business charts. Use this diagram slide, in your presentations to make business reports for statistical analysis. You may use this diagram to impart professional appearance to your presentations.
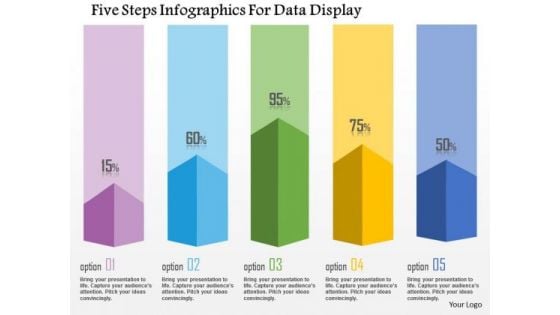
Business Diagram Five Steps Infographics For Data Display Presentation Template
This business diagram has been designed with graphic of five staged info graphics. This diagram can be used to display statistical information. Use this bar graph for your business and sales related presentations.
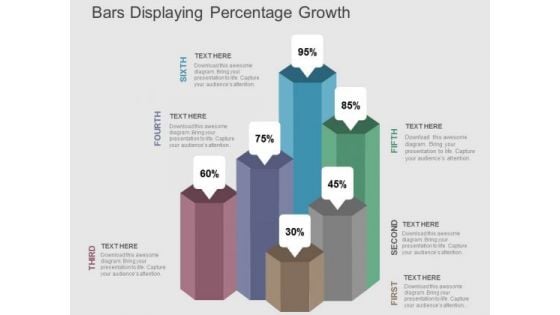
Bars Displaying Percentage Growth PowerPoint Templates
Our above PPT slide contains bar graph displaying percentage growth. This diagram of bar graph helps to depict statistical information. Use this diagram to impart more clarity to data and to create more sound impact on viewers.
Five Options Bar Graph With Icons Powerpoint Template
This PowerPoint slide has been designed with five options bar graph and icons. This slide of bar graph is suitable for statistical analysis. This professional slide helps in making an instant impact on viewers.
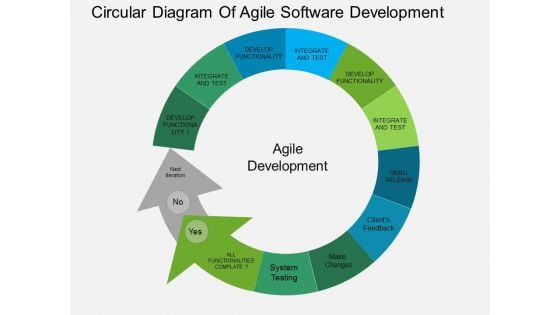
Circular Diagram Of Agile Software Development Powerpoint Templates
This PowerPoint template has been designed with circular diagram This diagram is a data visualization tool that gives you a simple way to present statistical information. This slide helps your audience examine and interpret the data you present.
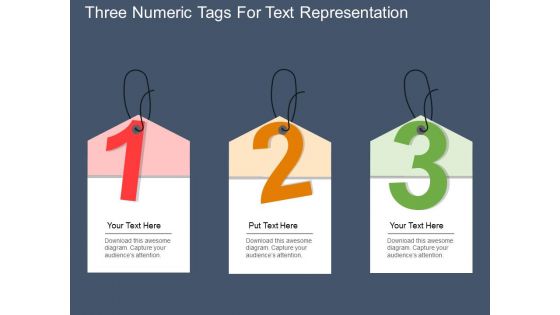
Three Numeric Tags For Text Representation Powerpoint Template
This PPT slide has been designed with graphics of three numeric tags. Download this PowerPoint template to exhibit entrepreneurship statistics. Accelerate the impact of your ideas using this PowerPoint diagram slide.
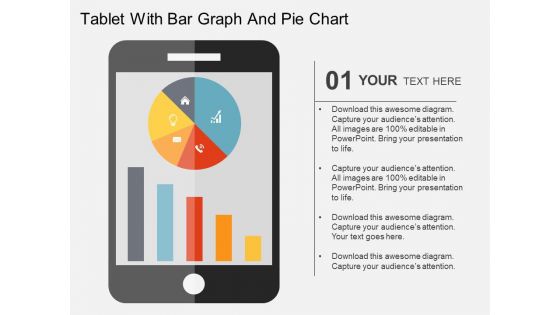
Tablet With Bar Graph And Pie Chart Powerpoint Templates
This business slide has been designed with business graphs on computer tablet. You may download this PPT slide to display statistical analysis. This slide will help you to sequence your thoughts.
Six Unidirectional Arrows With Business Icons Process Flow Powerpoint Templates
This business slide displays spiral road map design with icons. This diagram is a data visualization tool that gives you a simple way to present statistical information. This slide helps your audience examine and interpret the data you present.
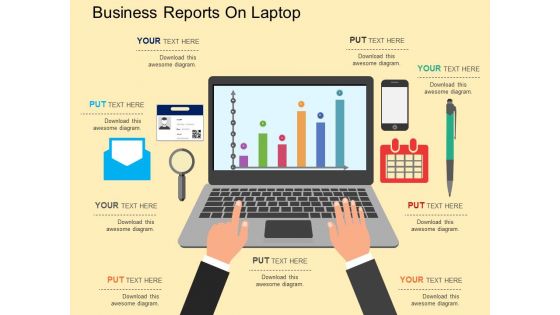
Business Reports On Laptop Powerpoint Template
This PPT slide has been designed with graphics of laptop on office table presenting statistical graph. This business diagram maybe used to exhibit management strategy. Use this diagram to build an exclusive presentation.
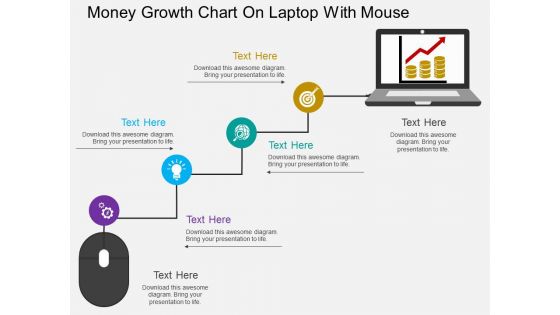
Money Growth Chart On Laptop With Mouse Powerpoint Template
This business slide displays money growth chart on laptop with mouse. This diagram is a data visualization tool that gives you a simple way to present statistical information. This slide helps your audience examine and interpret the data you present.
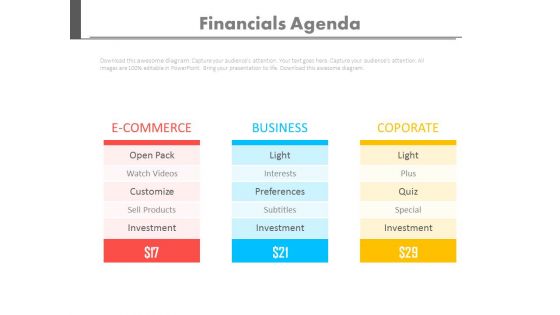
Three Tags For Ecommerce Business And Corporate Concepts Powerpoint Slides
This PowerPoint template contains three tags with numeric data. You may download this slide to display business, corporate and ecommerce statistics. You can easily customize this template to make it more unique as per your need.
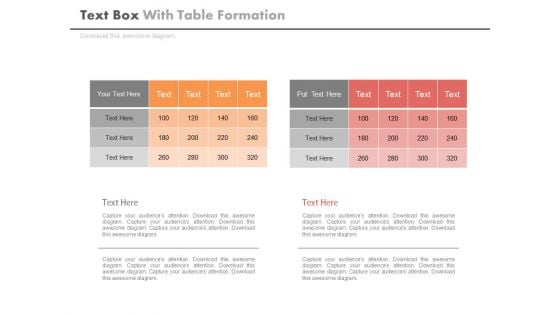
Two Table Charts For Business Data Powerpoint Slides
This PowerPoint template contains two tables chart. You may download this PPT slide to display statistical analysis. You can easily customize this template to make it more unique as per your need.
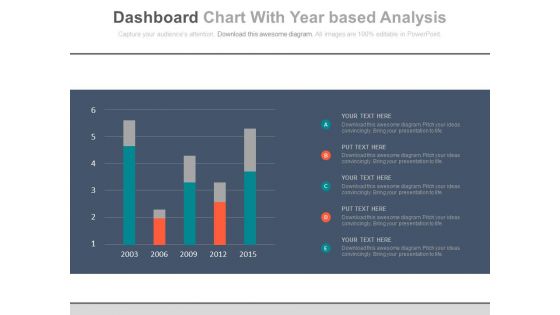
Bar Graph For Year Based Analysis Powerpoint Slides
This PowerPoint template has been designed with year based bar graph. This diagram may be used to display yearly statistical analysis. Use this PPT slide design to make impressive presentations.
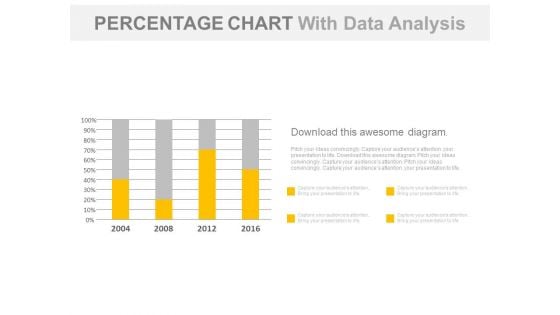
Year Based Chart With Percentage Data Analysis Powerpoint Slides
Our above business slide contains year based statistical chart. This PowerPoint template can be used to display percentage data analysis. Capture the attention of your audience with this slide.
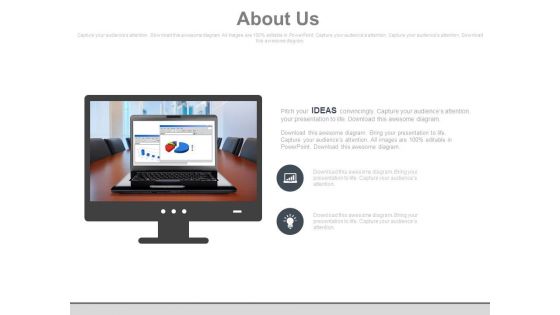
Business Charts About Us Slide Powerpoint Slides
This PowerPoint template has been designed with graphics of business charts. Download this PPT slide to display industry growth statistics. You can easily customize this template to make it more unique as per your need.
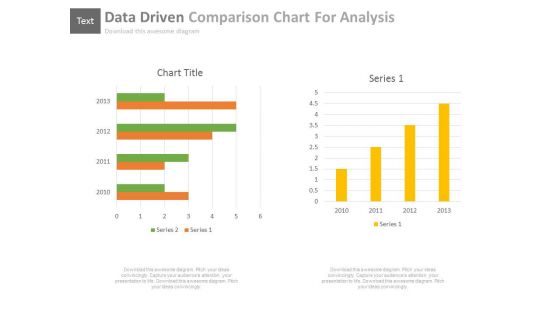
Data Driven Comparison Charts For Analysis Powerpoint Slides
You can download this PowerPoint template to display statistical data and analysis. This PPT slide contains data driven comparison charts. Draw an innovative business idea using this professional diagram.
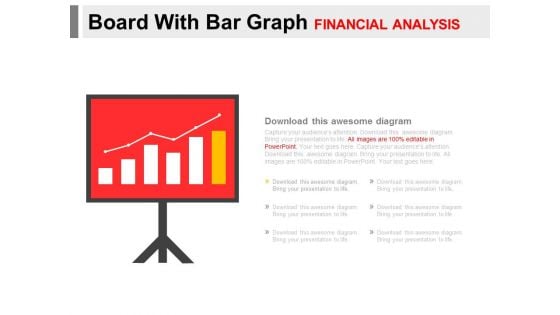
Board With Bar Graph For Financial Analysis Powerpoint Slides
You can download this PowerPoint template to display statistical data and analysis. This PPT slide contains display board with bar graph. Draw an innovative business idea using this professional diagram.
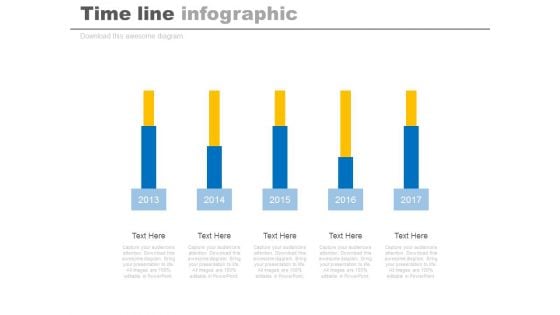
Five Years Planning Timeline Chart Powerpoint Slides
This timeline diagram displays five sequential year steps. This PowerPoint template may be used to display when statistical analysis. This timeline design is most useful for showing important milestones and deadlines.
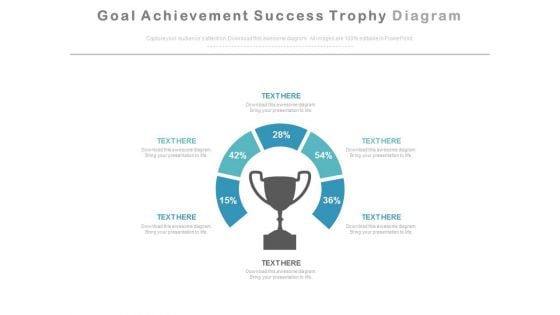
Goal Achievement Success Trophy Diagram Powerpoint Slides
This PPT slide contains circular graphics around trophy. You may download this PowerPoint template to display goal achievement facts, figures and achievement statistics. Impress your audiences by using this PPT slide.


 Continue with Email

 Home
Home


