Graph Trend
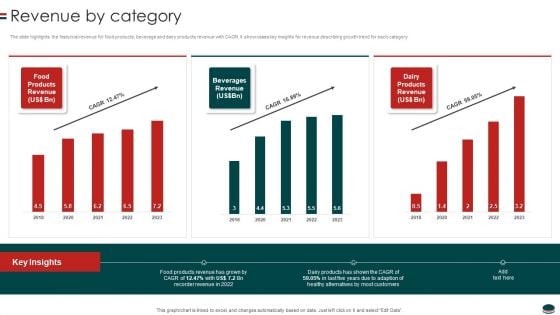
Instant Snacks And Food Firm Details Revenue By Category Clipart PDF
The slide highlights the historical revenue for food products, beverage and dairy products revenue with CAGR. It showcases key insights for revenue describing growth trend for each category.Deliver an awe inspiring pitch with this creative Instant Snacks And Food Firm Details Revenue By Category Clipart PDF bundle. Topics like Products Revenue, Beverages Revenue, Dairy Products can be discussed with this completely editable template. It is available for immediate download depending on the needs and requirements of the user.
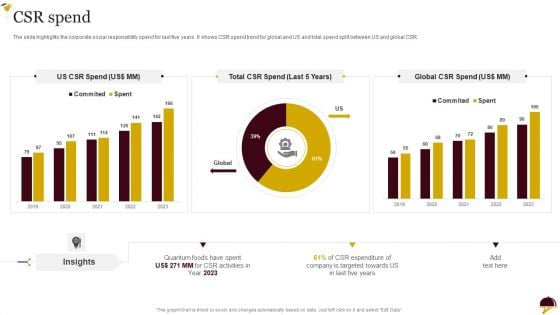
Food Company Overview CSR Spend Brochure PDF
The slide highlights the corporate social responsibility spend for last five years. It shows CSR spend trend for global and US and total spend split between US and global CSR.Deliver and pitch your topic in the best possible manner with this Food Company Overview CSR Spend Brochure PDF. Use them to share invaluable insights on Quantum Foods, Targeted Towards, Insights and impress your audience. This template can be altered and modified as per your expectations. So, grab it now.
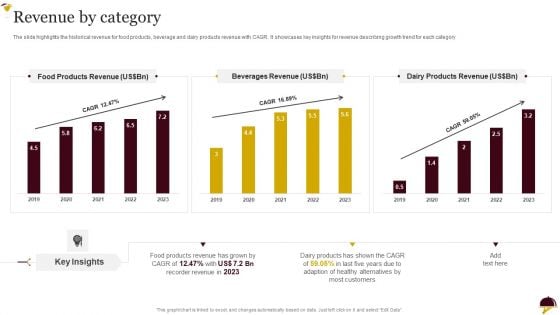
Food Company Overview Revenue By Category Diagrams PDF
The slide highlights the historical revenue for food products, beverage and dairy products revenue with CAGR. It showcases key insights for revenue describing growth trend for each category.Deliver and pitch your topic in the best possible manner with this Food Company Overview Revenue By Category Diagrams PDF Use them to share invaluable insights on Food Products, Beverages Revenue, Healthy Alternatives and impress your audience. This template can be altered and modified as per your expectations. So, grab it now.
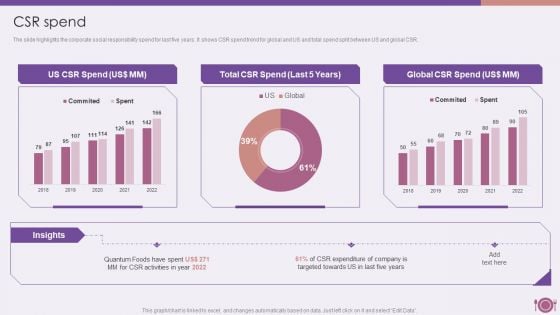
Packaged Food Firm Description CSR Spend Summary PDF
The slide highlights the corporate social responsibility spend for last five years. It shows CSR spend trend for global and US and total spend split between US and global CSR.Deliver and pitch your topic in the best possible manner with this Packaged Food Firm Description CSR Spend Summary PDF. Use them to share invaluable insights on Expenditure Of Company, Targeted Towards, CSR Activities and impress your audience. This template can be altered and modified as per your expectations. So, grab it now.
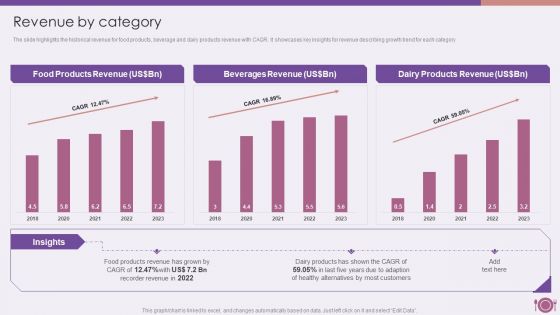
Packaged Food Firm Description Revenue By Category Background PDF
The slide highlights the historical revenue for food products, beverage and dairy products revenue with CAGR. It showcases key insights for revenue describing growth trend for each category.Deliver and pitch your topic in the best possible manner with this Packaged Food Firm Description Revenue By Category Background PDF. Use them to share invaluable insights on Organization Limited, Ultima Bottling, Bottling Partner and impress your audience. This template can be altered and modified as per your expectations. So, grab it now.
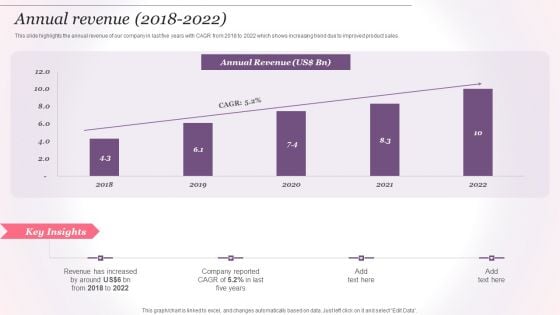
Cosmetics And Skin Care Company Profile Annual Revenue 2018 To2022 Demonstration PDF
This slide highlights the annual revenue of our company in last five years with CAGR from 2018 to 2022 which shows increasing trend due to improved product sales. Deliver an awe inspiring pitch with this creative Cosmetics And Skin Care Company Profile Annual Revenue 2018 To2022 Demonstration PDF bundle. Topics like Annual Revenue, 2018 To 2022, Key Insights can be discussed with this completely editable template. It is available for immediate download depending on the needs and requirements of the user.
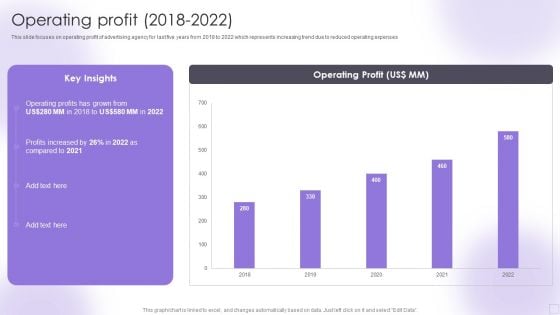
Advertising Services Company Profile Operating Profit 2018 To 2022 Slides PDF
This slide focuses on operating profit of advertising agency for last five years from 2018 to 2022 which represents increasing trend due to reduced operating expenses. Deliver and pitch your topic in the best possible manner with this Advertising Services Company Profile Operating Profit 2018 To 2022 Slides PDF. Use them to share invaluable insights on Operating Profit and impress your audience. This template can be altered and modified as per your expectations. So, grab it now.
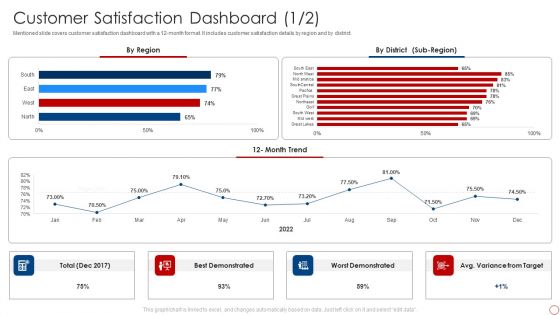
Kpis For Evaluating Business Sustainability Customer Satisfaction Dashboard Clipart PDF
Mentioned slide covers customer satisfaction dashboard with a 12-month format. It includes customer satisfaction details by region and by district. Deliver an awe inspiring pitch with this creative Kpis For Evaluating Business Sustainability Customer Satisfaction Dashboard Clipart PDF bundle. Topics like Best Demonstrated, Worst Demonstrated, 12 Month Trend can be discussed with this completely editable template. It is available for immediate download depending on the needs and requirements of the user.
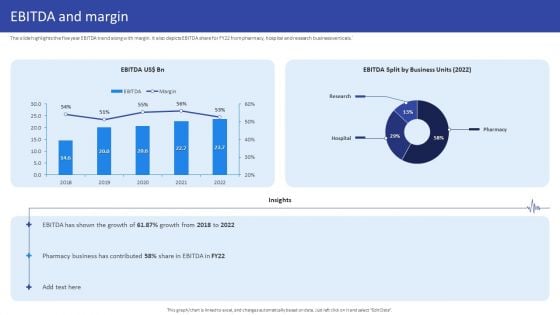
Hospital Medical Research Company Profile EBITDA And Margin Background PDF
The slide highlights the five year EBITDA trend along with margin. It also depicts EBITDA share for FY22 from pharmacy, hospital and research business verticals. Deliver and pitch your topic in the best possible manner with this Hospital Medical Research Company Profile EBITDA And Margin Background PDF.Use them to share invaluable insights on EBITDA US, EBITDA Split, Business Units, 2018 To 2022 and impress your audience. This template can be altered and modified as per your expectations. So, grab it now.
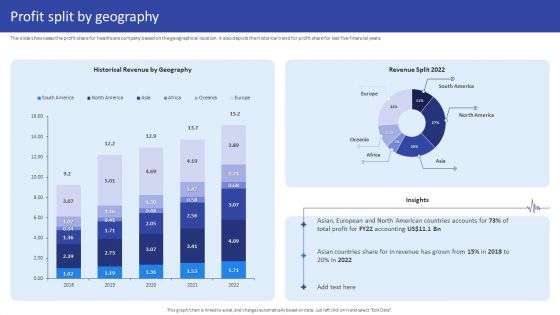
Hospital Medical Research Company Profile Profit Split By Geography Structure PDF
The slide showcases the profit share for healthcare company based on the geographical location. It also depicts the historical trend for profit share for last five financial years. Deliver an awe inspiring pitch with this creative Hospital Medical Research Company Profile Profit Split By Geography Structure PDF bundle. Topics like Shareholding March 2022, FII Shareholding Region, Shareholding March 2022 can be discussed with this completely editable template. It is available for immediate download depending on the needs and requirements of the user.
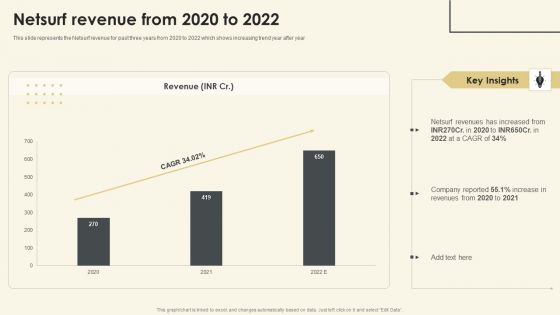
Netsurf Business Profile Netsurf Revenue From 2020 To 2022 Ppt Pictures Format PDF
This slide represents the Netsurf revenue for past three years from 2020 to 2022 which shows increasing trend year after year. Deliver and pitch your topic in the best possible manner with this Netsurf Business Profile Netsurf Revenue From 2020 To 2022 Ppt Pictures Format PDF. Use them to share invaluable insights on Revenue, Netsurf Revenues, 2020 To 2021 and impress your audience. This template can be altered and modified as per your expectations. So, grab it now.
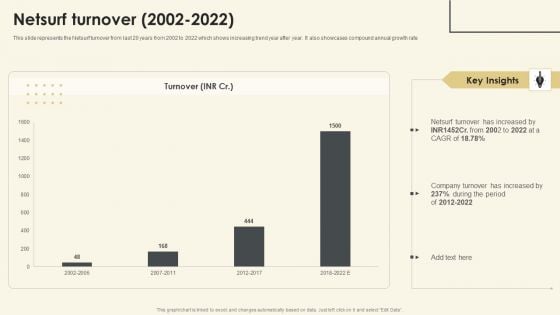
Netsurf Business Profile Netsurf Turnover 2002 To 2022 Ppt Gallery Rules PDF
This slide represents the Netsurf turnover from last 20 years from 2002 to 2022 which shows increasing trend year after year. It also showcases compound annual growth rate. Deliver an awe inspiring pitch with this creative Netsurf Business Profile Netsurf Turnover 2002 To 2022 Ppt Gallery Rules PDF bundle. Topics like Netsurf Turnover, 2002 To 2022, Company Turnover can be discussed with this completely editable template. It is available for immediate download depending on the needs and requirements of the user.
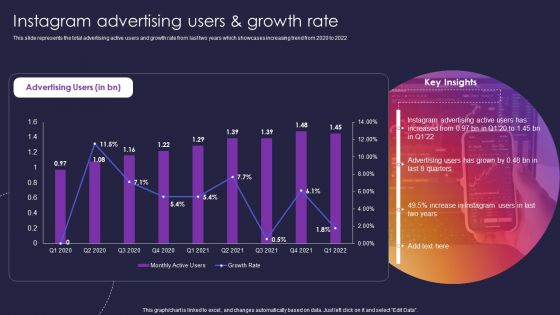
Instagram Company Details Instagram Advertising Users And Growth Rate Clipart PDF
This slide represents the total advertising active users and growth rate from last two years which showcases increasing trend from 2020 to 2022. Deliver an awe inspiring pitch with this creative Instagram Company Details Instagram Advertising Users And Growth Rate Clipart PDF bundle. Topics like Instagram Advertising Users, Growth Rate can be discussed with this completely editable template. It is available for immediate download depending on the needs and requirements of the user.
Instagram Company Details Revenue Growth From 2015 To 2021 Icons PDF
This slide shows the revenue growth of Instagram for last seven years from 2015 to 2021 which represents increasing revenue trend year after year. Deliver an awe inspiring pitch with this creative Instagram Company Details Revenue Growth From 2015 To 2021 Icons PDF bundle. Topics like Revenue Growth, Advertisements can be discussed with this completely editable template. It is available for immediate download depending on the needs and requirements of the user.

Term Life And General Insurance Company Profile Operating Profit And Margin Rules PDF
The slide showcases operating profit trend last five financial years along with profitability margin along with the key insights and reasons impacting operating margin. Deliver and pitch your topic in the best possible manner with this Term Life And General Insurance Company Profile Operating Profit And Margin Rules PDF. Use them to share invaluable insights on Operating Profit, Cost and impress your audience. This template can be altered and modified as per your expectations. So, grab it now.
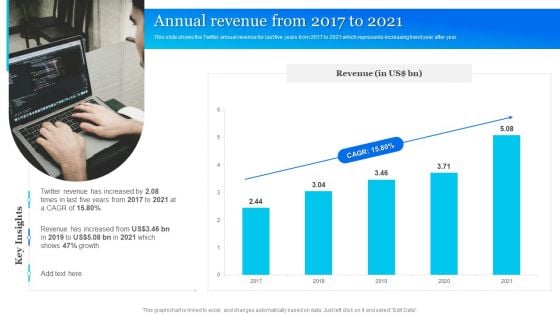
Twitter Company Summary Annual Revenue From 2017 To 2021 Inspiration PDF
This slide shows the Twitter annual revenue for last five years from 2017 to 2021 which represents increasing trend year after year. Deliver and pitch your topic in the best possible manner with this Twitter Company Summary Annual Revenue From 2017 To 2021 Inspiration PDF. Use them to share invaluable insights on Annual Revenue, Growth and impress your audience. This template can be altered and modified as per your expectations. So, grab it now.
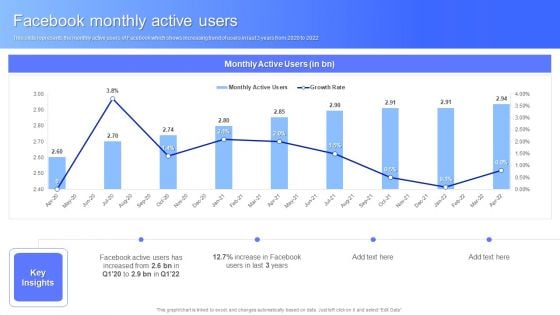
Facebook Monthly Active Users Facebook Business Outline Information PDF
This slide represents the monthly active users of Facebook which shows increasing trend of users in last 3 years from 2020 to 2022. Deliver and pitch your topic in the best possible manner with this Facebook Monthly Active Users Facebook Business Outline Information PDF. Use them to share invaluable insights on Facebook Monthly Active Users and impress your audience. This template can be altered and modified as per your expectations. So, grab it now.
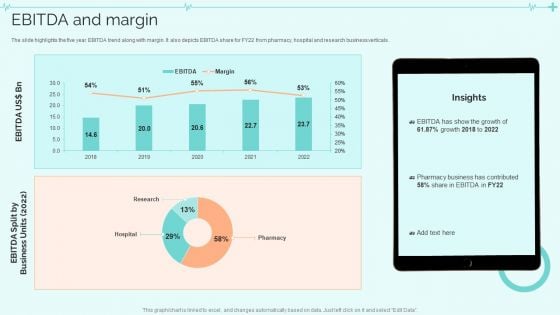
Clinical Services Company Profile Ebitda And Margin Graphics PDF
The slide highlights the five year EBITDA trend along with margin. It also depicts EBITDA share for FY22 from pharmacy, hospital and research business verticals. Deliver and pitch your topic in the best possible manner with this Clinical Services Company Profile Ebitda And Margin Graphics PDF. Use them to share invaluable insights on Growth, Pharmacy Business, Ebitda And Margin and impress your audience. This template can be altered and modified as per your expectations. So, grab it now.
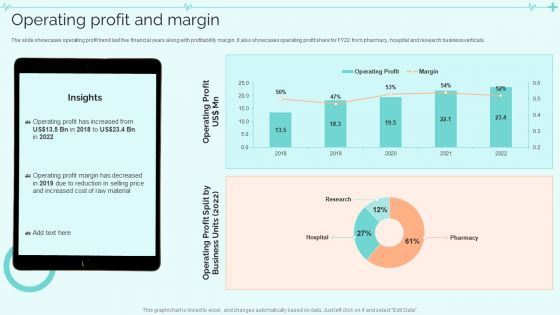
Clinical Services Company Profile Operating Profit And Margin Summary PDF
The slide showcases operating profit trend last five financial years along with profitability margin. It also showcases operating profit share for FY22 from pharmacy, hospital and research business verticals. Deliver an awe inspiring pitch with this creative Clinical Services Company Profile Operating Profit And Margin Summary PDF bundle. Topics like Operating Profit Margin, Cost, Raw Material can be discussed with this completely editable template. It is available for immediate download depending on the needs and requirements of the user.
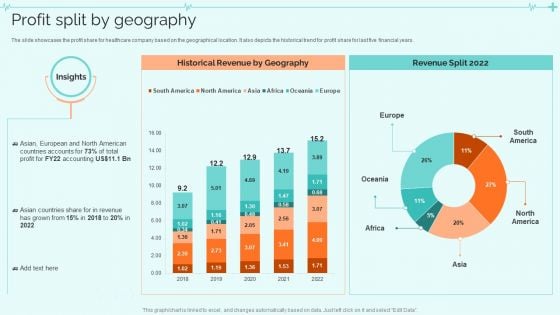
Clinical Services Company Profile Profit Split By Geography Infographics PDF
The slide showcases the profit share for healthcare company based on the geographical location. It also depicts the historical trend for profit share for last five financial years. Deliver and pitch your topic in the best possible manner with this Clinical Services Company Profile Profit Split By Geography Infographics PDF. Use them to share invaluable insights on Historical Revenue By Geography, Revenue Split and impress your audience. This template can be altered and modified as per your expectations. So, grab it now.
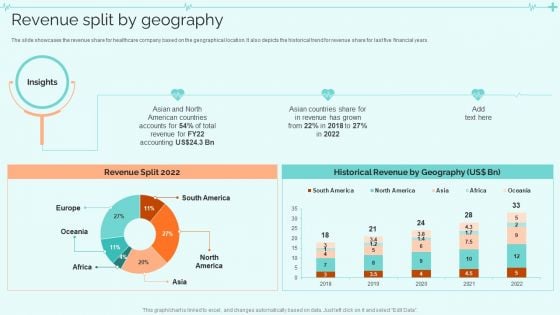
Clinical Services Company Profile Revenue Split By Geography Graphics PDF
The slide showcases the revenue share for healthcare company based on the geographical location. It also depicts the historical trend for revenue share for last five financial years. Deliver an awe inspiring pitch with this creative Clinical Services Company Profile Revenue Split By Geography Graphics PDF bundle. Topics like Revenue Split, Historical Revenue By Geography can be discussed with this completely editable template. It is available for immediate download depending on the needs and requirements of the user.
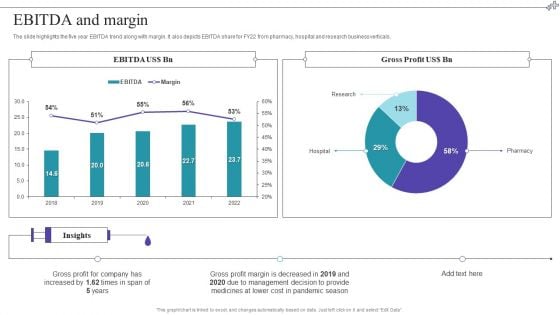
Medical Care Company Overview Ebitda And Margin Structure PDF
The slide highlights the five year EBITDA trend along with margin. It also depicts EBITDA share for FY22 from pharmacy, hospital and research business verticals. Deliver an awe inspiring pitch with this creative Medical Care Company Overview Ebitda And Margin Structure PDF bundle. Topics like Gross Profit, Management can be discussed with this completely editable template. It is available for immediate download depending on the needs and requirements of the user.

Medical Care Company Overview Operating Profit And Margin Demonstration PDF
The slide showcases operating profit trend last five financial years along with profitability margin. It also showcases operating profit share for FY22 from pharmacy, hospital and research business verticals. Deliver and pitch your topic in the best possible manner with this Medical Care Company Overview Operating Profit And Margin Demonstration PDF. Use them to share invaluable insights on Profit Margin, Price, Raw Material and impress your audience. This template can be altered and modified as per your expectations. So, grab it now.
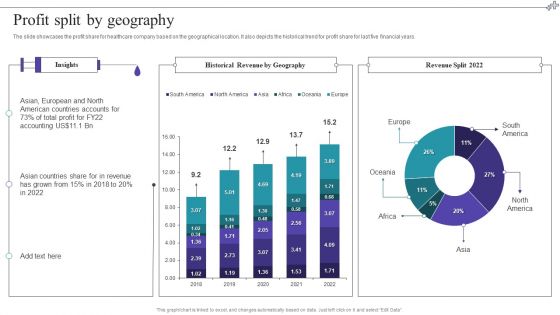
Medical Care Company Overview Profit Split By Geography Inspiration PDF
The slide showcases the profit share for healthcare company based on the geographical location. It also depicts the historical trend for profit share for last five financial years. Deliver an awe inspiring pitch with this creative Medical Care Company Overview Profit Split By Geography Inspiration PDF bundle. Topics like Profit Split By Geography can be discussed with this completely editable template. It is available for immediate download depending on the needs and requirements of the user.
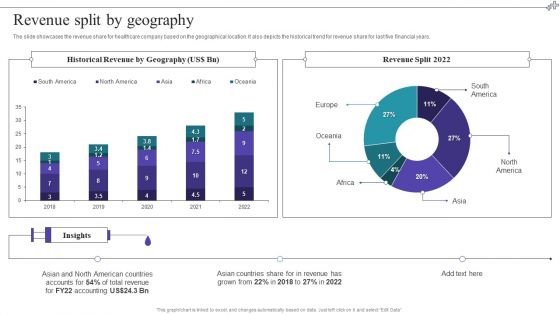
Medical Care Company Overview Revenue Split By Geography Portrait PDF
The slide showcases the revenue share for healthcare company based on the geographical location. It also depicts the historical trend for revenue share for last five financial years. Deliver an awe inspiring pitch with this creative Medical Care Company Overview Revenue Split By Geography Portrait PDF bundle. Topics like Revenue Split By Geography can be discussed with this completely editable template. It is available for immediate download depending on the needs and requirements of the user.
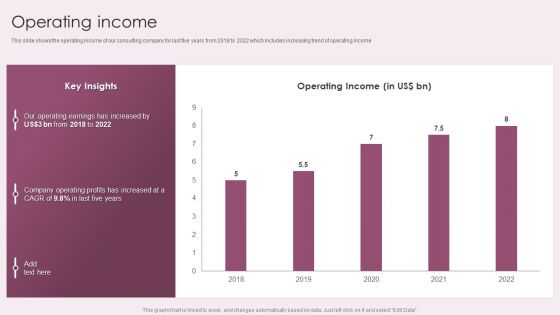
Business Advisory Solutions Company Profile Operating Income Ppt Infographics Slideshow PDF
This slide shows the operating income of our consulting company for last five years from 2018 to 2022 which includes increasing trend of operating income. Deliver an awe inspiring pitch with this creative Business Advisory Solutions Company Profile Operating Income Ppt Infographics Slideshow PDF bundle. Topics like Operating Income, Key Insights, Our Operating Earnings can be discussed with this completely editable template. It is available for immediate download depending on the needs and requirements of the user.
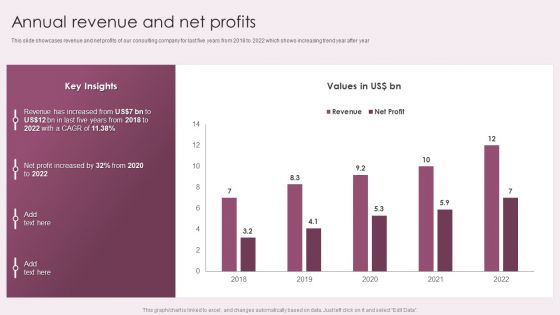
Business Advisory Solutions Company Profile Annual Revenue And Net Profits Slides PDF
This slide showcases revenue and net profits of our consulting company for last five years from 2018 to 2022 which shows increasing trend year after year. Deliver an awe inspiring pitch with this creative Business Advisory Solutions Company Profile Annual Revenue And Net Profits Slides PDF bundle. Topics like Key Insights, Net Profit Increased, 2018 To 2022 can be discussed with this completely editable template. It is available for immediate download depending on the needs and requirements of the user.
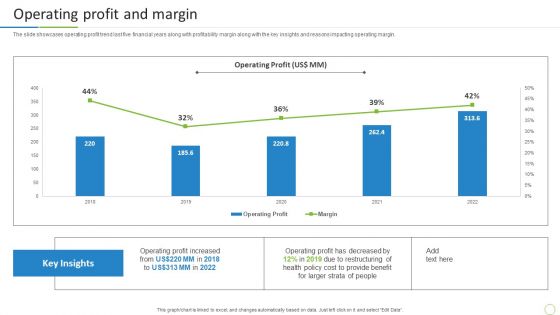
Property And Casualties Insurance Business Profile Operating Profit And Margin Summary PDF
The slide showcases operating profit trend last five financial years along with profitability margin along with the key insights and reasons impacting operating margin. Deliver and pitch your topic in the best possible manner with this Property And Casualties Insurance Business Profile Operating Profit And Margin Summary PDF. Use them to share invaluable insights on Operating Profit And Margin and impress your audience. This template can be altered and modified as per your expectations. So, grab it now.
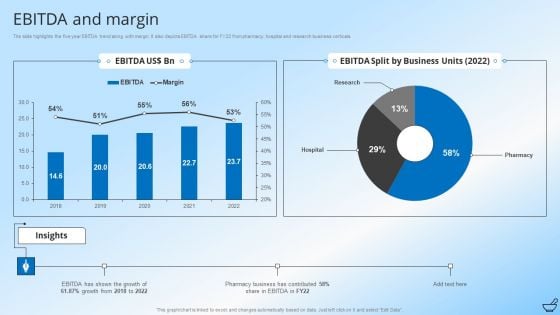
Pharmaceutical And Clinical Research Summary Ebitda And Margin Template PDF
The slide highlights the five year EBITDA trend along with margin. It also depicts EBITDA share for FY22 from pharmacy, hospital and research business verticals. Deliver an awe inspiring pitch with this creative Pharmaceutical And Clinical Research Summary Ebitda And Margin Template PDF bundle. Topics like EBITDA And Margin can be discussed with this completely editable template. It is available for immediate download depending on the needs and requirements of the user.
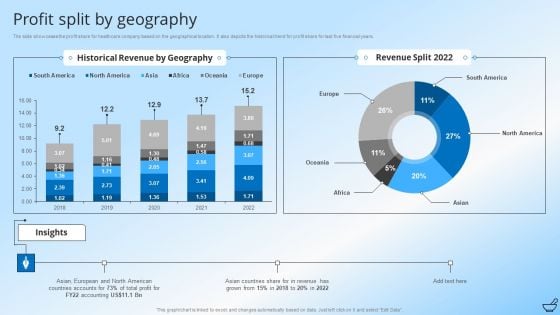
Pharmaceutical And Clinical Research Summary Profit Split By Geography Designs PDF
The slide showcases the profit share for healthcare company based on the geographical location. It also depicts the historical trend for profit share for last five financial years. Deliver an awe inspiring pitch with this creative Pharmaceutical And Clinical Research Summary Profit Split By Geography Designs PDF bundle. Topics like Revenue, Profit Split By Geography can be discussed with this completely editable template. It is available for immediate download depending on the needs and requirements of the user.
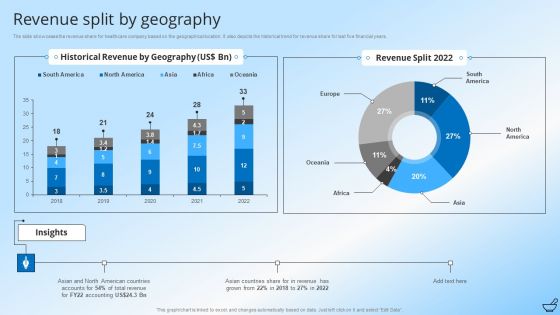
Pharmaceutical And Clinical Research Summary Revenue Split By Geography Themes PDF
The slide showcases the revenue share for healthcare company based on the geographical location. It also depicts the historical trend for revenue share for last five financial years. Deliver an awe inspiring pitch with this creative Pharmaceutical And Clinical Research Summary Revenue Split By Geography Themes PDF bundle. Topics like Historical Revenue By Geography, Revenue Split can be discussed with this completely editable template. It is available for immediate download depending on the needs and requirements of the user.
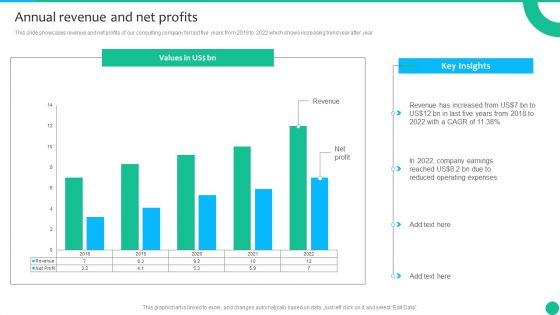
Strategic Management Consultancy Business Profile Annual Revenue And Net Profits Microsoft PDF
This slide showcases revenue and net profits of our consulting company for last five years from 2018 to 2022 which shows increasing trend year after year. Deliver an awe inspiring pitch with this creative Strategic Management Consultancy Business Profile Annual Revenue And Net Profits Microsoft PDF bundle. Topics like Reduced Operating Expenses, Revenue can be discussed with this completely editable template. It is available for immediate download depending on the needs and requirements of the user.
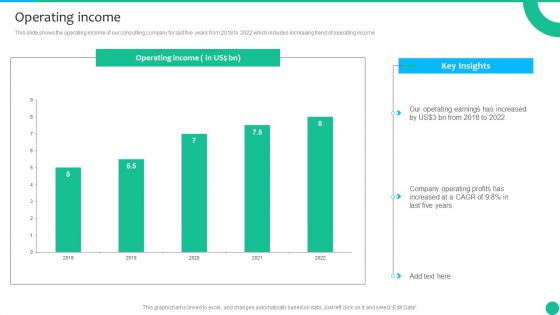
Strategic Management Consultancy Business Profile Operating Income Download PDF
This slide shows the operating income of our consulting company for last five years from 2018 to 2022 which includes increasing trend of operating income. Deliver and pitch your topic in the best possible manner with this Strategic Management Consultancy Business Profile Operating Income Download PDF. Use them to share invaluable insights on Operating Income and impress your audience. This template can be altered and modified as per your expectations. So, grab it now.

Operating Profit And Margin Health And Property Insurance Company Profile Portrait PDF
The slide showcases operating profit trend last five financial years along with profitability margin along with the key insights and reasons impacting operating margin. Deliver and pitch your topic in the best possible manner with this Operating Profit And Margin Health And Property Insurance Company Profile Portrait PDF. Use them to share invaluable insights on Operating Profit, Margin and impress your audience. This template can be altered and modified as per your expectations. So, grab it now.
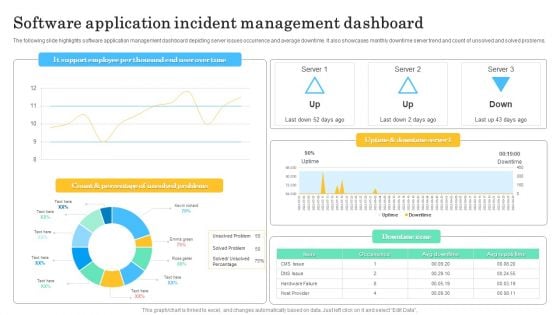
Software Application Incident Management Dashboard Template PDF
The following slide highlights software application management dashboard depicting server issues occurrence and average downtime. It also showcases monthly downtime server trend and count of unsolved and solved problems. Pitch your topic with ease and precision using this Software Application Incident Management Dashboard Template PDF. This layout presents information on Count And Percentage, Unsolved Problems. It is also available for immediate download and adjustment. So, changes can be made in the color, design, graphics or any other component to create a unique layout.
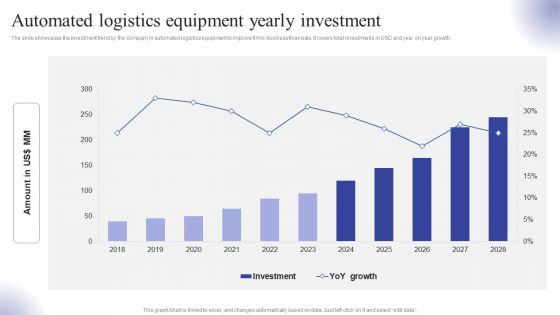
Automated Logistics Equipment Yearly Investment Ppt Infographics Outfit PDF
The slide showcases the investment trend by the company in automated logistics equipment to improve firms business financials. It covers total investments in USD and year on year growth. There are so many reasons you need a Automated Logistics Equipment Yearly Investment Ppt Infographics Outfit PDF. The first reason is you can not spend time making everything from scratch, Thus, Slidegeeks has made presentation templates for you too. You can easily download these templates from our website easily.

Engineering Services Company Report Gross Profit And Margin Ppt PowerPoint Presentation File Show PDF
This slide illustrates a graph of gross profit in US dollar and gross margin in percentage for engineering company illustrating growth trend in last five years from 2018 to 2022. From laying roadmaps to briefing everything in detail, our templates are perfect for you. You can set the stage with your presentation slides. All you have to do is download these easy-to-edit and customizable templates. Engineering Services Company Report Gross Profit And Margin Ppt PowerPoint Presentation File Show PDF will help you deliver an outstanding performance that everyone would remember and praise you for. Do download this presentation today.
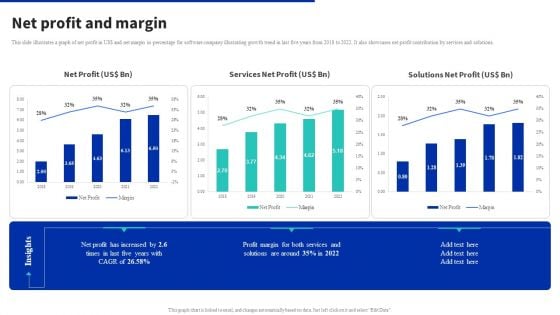
Digital Products Company Outline Net Profit And Margin Summary PDF
This slide illustrates a graph of net profit in US dollar and net margin in percentage for software company illustrating growth trend in last five years from 2018 to 2022. It also showcases net profit contribution by services and solutions. From laying roadmaps to briefing everything in detail, our templates are perfect for you. You can set the stage with your presentation slides. All you have to do is download these easy to edit and customizable templates. Digital Products Company Outline Net Profit And Margin Summary PDF will help you deliver an outstanding performance that everyone would remember and praise you for. Do download this presentation today.
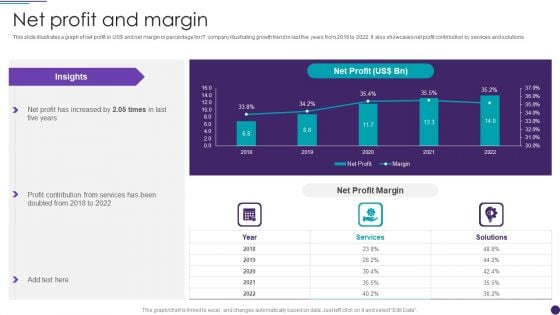
IT Services Business Profile Net Profit And Margin Sample PDF
This slide illustrates a graph of net profit in US doller and net margin in percentage for IT company illustrating growth trend in last five years from 2018 to 2022. It also showcases net profit contribution by services and solutions. Deliver and pitch your topic in the best possible manner with this IT Services Business Profile Net Profit And Margin Sample PDF. Use them to share invaluable insights on Services, Net Profit Margin and impress your audience. This template can be altered and modified as per your expectations. So, grab it now.
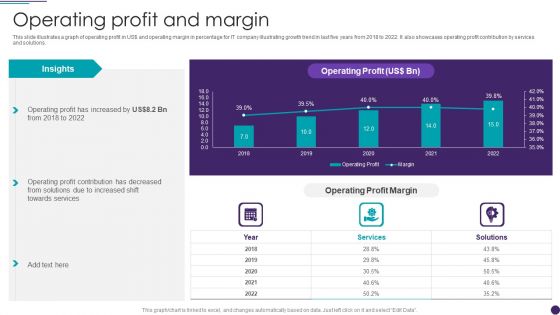
IT Services Business Profile Operating Profit And Margin Sample PDF
This slide illustrates a graph of operating profit in US doller and operating margin in percentage for IT company illustrating growth trend in last five years from 2018 to 2022. It also showcases operating profit contribution by services and solutions. Deliver an awe inspiring pitch with this creative IT Services Business Profile Operating Profit And Margin Sample PDF bundle. Topics like Operating Profit, Services can be discussed with this completely editable template. It is available for immediate download depending on the needs and requirements of the user.
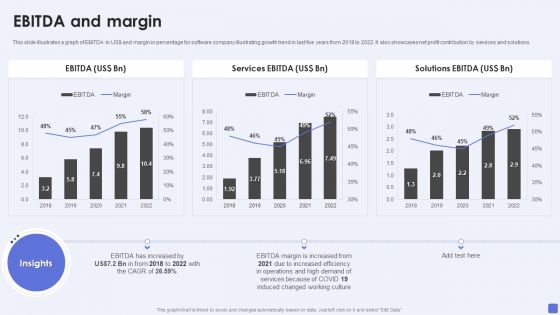
Software Services Business Profile EBITDA And Margin Ppt PowerPoint Presentation Gallery Slide Portrait PDF
This slide illustrates a graph of EBITDA in US dollar and margin in percentage for software company illustrating growth trend in last five years from 2018 to 2022. It also showcases net profit contribution by services and solutions. Deliver an awe inspiring pitch with this creative Software Services Business Profile EBITDA And Margin Ppt PowerPoint Presentation Gallery Slide Portrait PDF bundle. Topics like Services EB, Solutions EBITDA, EBITDA Margin can be discussed with this completely editable template. It is available for immediate download depending on the needs and requirements of the user.
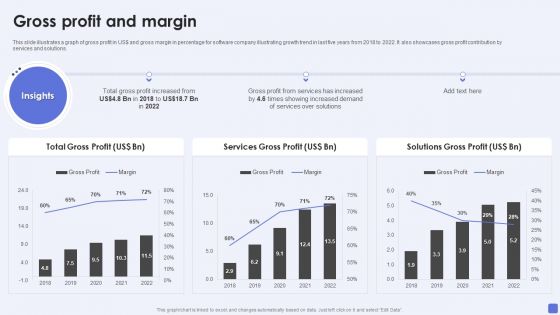
Software Services Business Profile Gross Profit And Margin Ppt PowerPoint Presentation Gallery Templates PDF
This slide illustrates a graph of gross profit in US dollar and gross margin in percentage for software company illustrating growth trend in last five years from 2018 to 2022. It also showcases gross profit contribution by services and solutions. Deliver an awe inspiring pitch with this creative Software Services Business Profile Gross Profit And Margin Ppt PowerPoint Presentation Gallery Templates PDF bundle. Topics like Total Gross Profit, Services Gross Profit, Solutions Gross Profit can be discussed with this completely editable template. It is available for immediate download depending on the needs and requirements of the user.
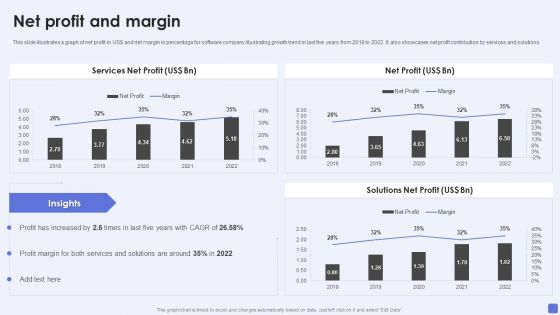
Software Services Business Profile Net Profit And Margin Ppt PowerPoint Presentation File Slides PDF
This slide illustrates a graph of net profit in US dollar and net margin in percentage for software company illustrating growth trend in last five years from 2018 to 2022. It also showcases net profit contribution by services and solutions. Deliver an awe inspiring pitch with this creative Software Services Business Profile Net Profit And Margin Ppt PowerPoint Presentation File Slides PDF bundle. Topics like Services Net Profit, Net Profit, Solutions Net Profit can be discussed with this completely editable template. It is available for immediate download depending on the needs and requirements of the user.
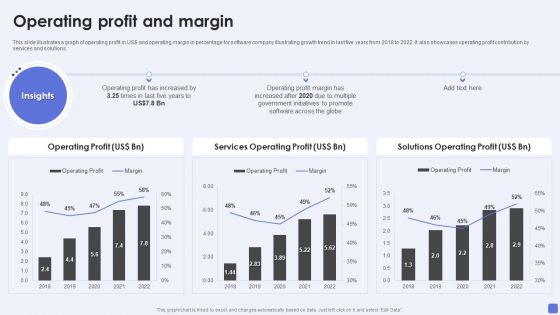
Software Services Business Profile Operating Profit And Margin Ppt PowerPoint Presentation Gallery Inspiration PDF
This slide illustrates a graph of operating profit in US dollar and operating margin in percentage for software company illustrating growth trend in last five years from 2018 to 2022. It also showcases operating profit contribution by services and solutions. Deliver and pitch your topic in the best possible manner with this Software Services Business Profile Operating Profit And Margin Ppt PowerPoint Presentation Gallery Inspiration PDF. Use them to share invaluable insights on Operating Profit, Services Operating Profit, Solutions Operating Profit and impress your audience. This template can be altered and modified as per your expectations. So, grab it now.
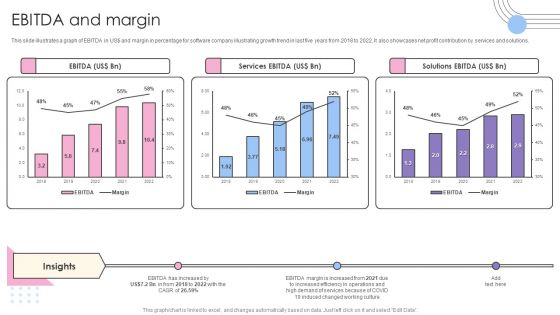
Software Products And Solutions Firm Details EBITDA And Margin Structure PDF
This slide illustrates a graph of EBITDA in US dollar and margin in percentage for software company illustrating growth trend in last five years from 2018 to 2022. It also showcases net profit contribution by services and solutions. Deliver an awe inspiring pitch with this creative Software Products And Solutions Firm Details EBITDA And Margin Structure PDF bundle. Topics like EBITDA, Services EBITDA, Solutions EBITDA, 2018 To 2022 can be discussed with this completely editable template. It is available for immediate download depending on the needs and requirements of the user.
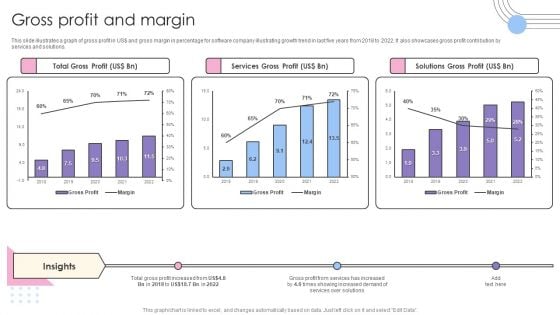
Software Products And Solutions Firm Details Gross Profit And Margin Pictures PDF
This slide illustrates a graph of gross profit in US dollar and gross margin in percentage for software company illustrating growth trend in last five years from 2018 to 2022. It also showcases gross profit contribution by services and solutions. Deliver and pitch your topic in the best possible manner with this Software Products And Solutions Firm Details Gross Profit And Margin Pictures PDF. Use them to share invaluable insights on Total Gross Profit, Services Gross Profit, Solutions Gross Profit and impress your audience. This template can be altered and modified as per your expectations. So, grab it now.
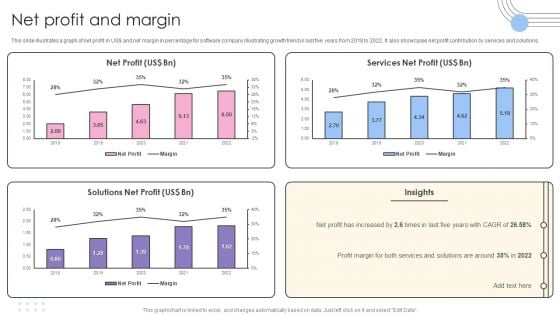
Software Products And Solutions Firm Details Net Profit And Margin Information PDF
This slide illustrates a graph of net profit in US dollar and net margin in percentage for software company illustrating growth trend in last five years from 2018 to 2022. It also showcases net profit contribution by services and solutions. Deliver and pitch your topic in the best possible manner with this Software Products And Solutions Firm Details Net Profit And Margin Information PDF. Use them to share invaluable insights on Net Profit, Services Net Profit, Solutions Net Profit and impress your audience. This template can be altered and modified as per your expectations. So, grab it now.

Software Products And Solutions Firm Details Operating Profit And Margin Mockup PDF
This slide illustrates a graph of operating profit in US dollar and operating margin in percentage for software company illustrating growth trend in last five years from 2018 to 2022. It also showcases operating profit contribution by services and solutions. Deliver an awe inspiring pitch with this creative Software Products And Solutions Firm Details Operating Profit And Margin Mockup PDF bundle. Topics like Operating Profit, Services Operating Profit, Solutions Operating Profit can be discussed with this completely editable template. It is available for immediate download depending on the needs and requirements of the user.
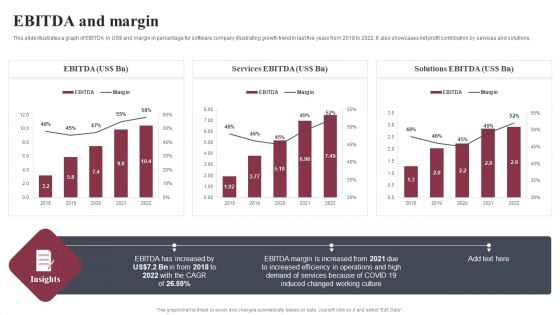
Business Software Development Company Profile EBITDA And Margin Summary PDF
This slide illustrates a graph of EBITDA in US dollar and margin in percentage for software company illustrating growth trend in last five years from 2018 to 2022. It also showcases net profit contribution by services and solutions. Deliver an awe inspiring pitch with this creative Business Software Development Company Profile EBITDA And Margin Summary PDF bundle. Topics like EBITDA, Services EBITDA, Solutions EBITDA can be discussed with this completely editable template. It is available for immediate download depending on the needs and requirements of the user.
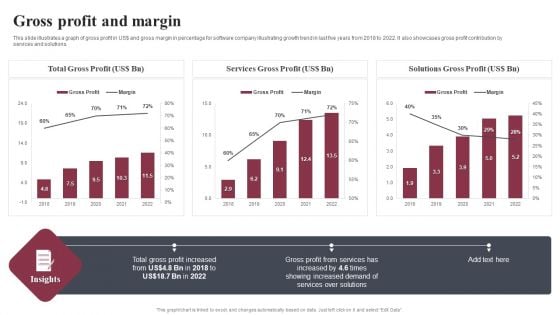
Business Software Development Company Profile Gross Profit And Margin Microsoft PDF
This slide illustrates a graph of gross profit in US dollar and gross margin in percentage for software company illustrating growth trend in last five years from 2018 to 2022. It also showcases gross profit contribution by services and solutions. Deliver and pitch your topic in the best possible manner with this Business Software Development Company Profile Gross Profit And Margin Microsoft PDF. Use them to share invaluable insights on Total Gross Profit, Services Gross Profit, Solutions Gross Profit and impress your audience. This template can be altered and modified as per your expectations. So, grab it now.
Business Software Development Company Profile Net Profit And Margin Mockup PDF
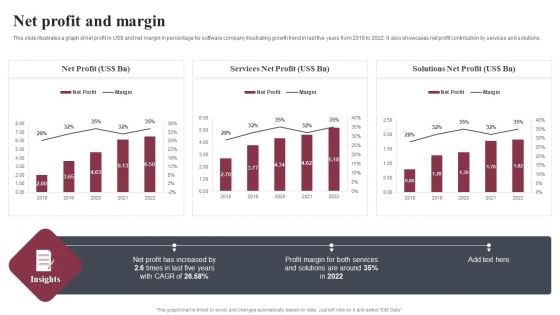
This slide illustrates a graph of net profit in US dollar and net margin in percentage for software company illustrating growth trend in last five years from 2018 to 2022. It also showcases net profit contribution by services and solutions. Deliver an awe inspiring pitch with this creative Business Software Development Company Profile Net Profit And Margin Mockup PDF bundle. Topics like Net Profit, Services Net Profit, Solutions Net Profit can be discussed with this completely editable template. It is available for immediate download depending on the needs and requirements of the user.
Business Software Development Company Profile Operating Profit And Margin Summary PDF
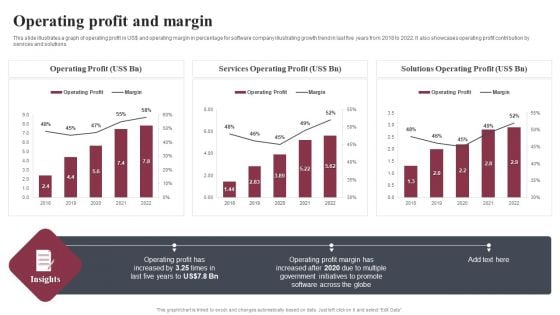
This slide illustrates a graph of operating profit in US dollar and operating margin in percentage for software company illustrating growth trend in last five years from 2018 to 2022. It also showcases operating profit contribution by services and solutions. Deliver and pitch your topic in the best possible manner with this Business Software Development Company Profile Operating Profit And Margin Summary PDF. Use them to share invaluable insights on Operating Profit, Services Operating Profit, Solutions Operating Profit and impress your audience. This template can be altered and modified as per your expectations. So, grab it now.
Infotech Solutions Research And Development Company Summary Gross Profit And Margin Ideas PDF
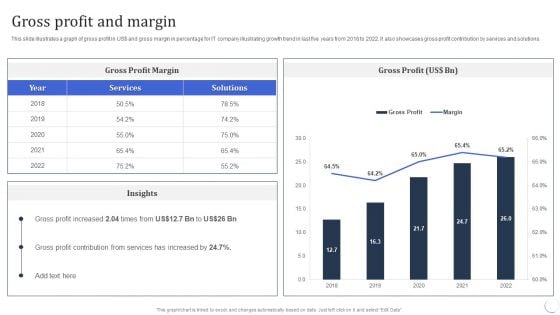
This slide illustrates a graph of gross profit in US dollar and gross margin in percentage for IT company illustrating growth trend in last five years from 2018 to 2022. It also showcases gross profit contribution by services and solutions. Deliver an awe inspiring pitch with this creative Infotech Solutions Research And Development Company Summary Gross Profit And Margin Ideas PDF bundle. Topics like Services, Gross Profit Margin can be discussed with this completely editable template. It is available for immediate download depending on the needs and requirements of the user.
Infotech Solutions Research And Development Company Summary Net Profit And Margin Information PDF
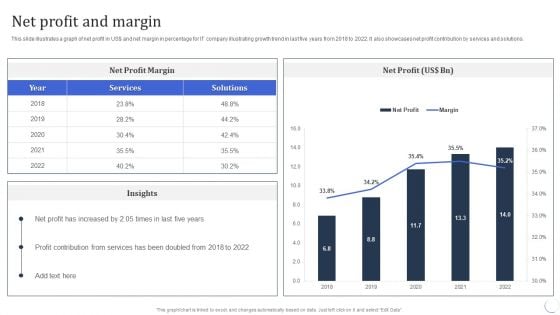
This slide illustrates a graph of net profit in US dollar and net margin in percentage for IT company illustrating growth trend in last five years from 2018 to 2022. It also showcases net profit contribution by services and solutions. Deliver and pitch your topic in the best possible manner with this Infotech Solutions Research And Development Company Summary Net Profit And Margin Information PDF. Use them to share invaluable insights on Profit Contribution, Services, Net Profit and impress your audience. This template can be altered and modified as per your expectations. So, grab it now.
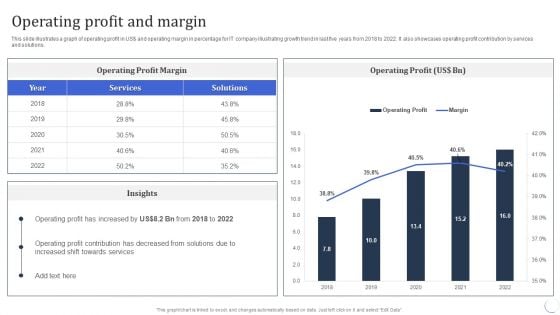
Infotech Solutions Research And Development Company Summary Operating Profit And Margin Download PDF
This slide illustrates a graph of operating profit in US dollar and operating margin in percentage for IT company illustrating growth trend in last five years from 2018 to 2022. It also showcases operating profit contribution by services and solutions. Deliver an awe inspiring pitch with this creative Infotech Solutions Research And Development Company Summary Operating Profit And Margin Download PDF bundle. Topics like Services, Operating Profit can be discussed with this completely editable template. It is available for immediate download depending on the needs and requirements of the user.
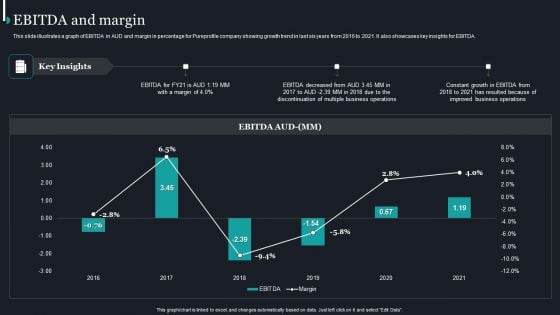
Pureprofile Business Overview EBITDA And Margin Ppt Gallery Sample PDF
This slide illustrates a graph of EBITDA in AUD and margin in percentage for Pureprofile company showing growth trend in last six years from 2016 to 2021. It also showcases key insights for EBITDA. Deliver and pitch your topic in the best possible manner with this Pureprofile Business Overview EBITDA And Margin Ppt Gallery Sample PDF. Use them to share invaluable insights on EBITDA Decreased, Business Operations, 2016 To 2021 and impress your audience. This template can be altered and modified as per your expectations. So, grab it now.
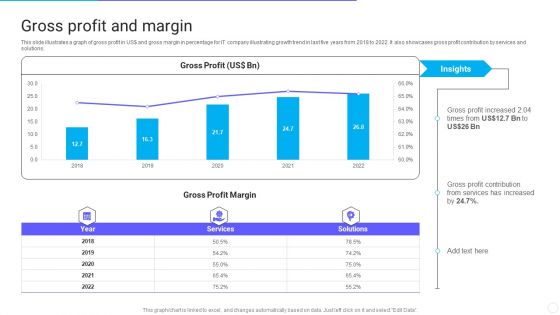
IT Application Services Company Outline Gross Profit And Margin Elements PDF
This slide illustrates a graph of gross profit in US dollar and gross margin in percentage for IT company illustrating growth trend in last five years from 2018 to 2022. It also showcases gross profit contribution by services and solutions. Deliver an awe inspiring pitch with this creative IT Application Services Company Outline Gross Profit And Margin Elements PDF bundle. Topics like Gross Profit Margin, Services can be discussed with this completely editable template. It is available for immediate download depending on the needs and requirements of the user.
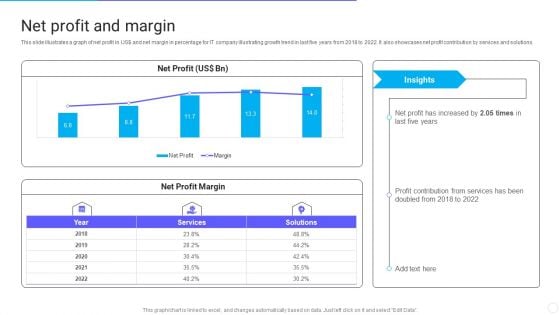
IT Application Services Company Outline Net Profit And Margin Structure PDF
This slide illustrates a graph of net profit in US dollar and net margin in percentage for IT company illustrating growth trend in last five years from 2018 to 2022. It also showcases net profit contribution by services and solutions. Deliver and pitch your topic in the best possible manner with this IT Application Services Company Outline Net Profit And Margin Structure PDF. Use them to share invaluable insights on Net Profit Margin, Services, Margin and impress your audience. This template can be altered and modified as per your expectations. So, grab it now.
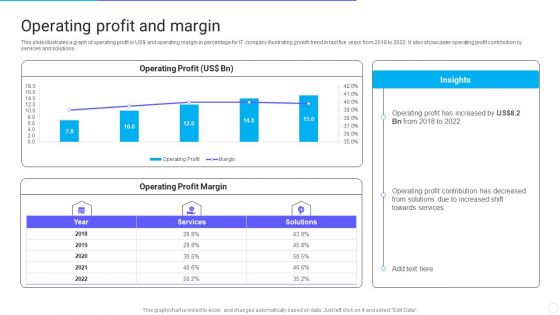
IT Application Services Company Outline Operating Profit And Margin Structure PDF
This slide illustrates a graph of operating profit in US dollar and operating margin in percentage for IT company illustrating growth trend in last five years from 2018 to 2022. It also showcases operating profit contribution by services and solutions. Deliver an awe inspiring pitch with this creative IT Application Services Company Outline Operating Profit And Margin Structure PDF bundle. Topics like Operating Profit And Margin can be discussed with this completely editable template. It is available for immediate download depending on the needs and requirements of the user.
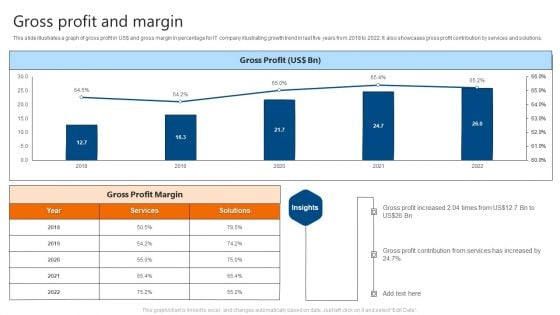
Gross Profit And Margin IT Software Development Company Profile Slides PDF
This slide illustrates a graph of gross profit in US doller and gross margin in percentage for IT company illustrating growth trend in last five years from 2018 to 2022. It also showcases gross profit contribution by services and solutions. Deliver and pitch your topic in the best possible manner with this Gross Profit And Margin IT Software Development Company Profile Slides PDF. Use them to share invaluable insights on Gross Profit, Margin and impress your audience. This template can be altered and modified as per your expectations. So, grab it now.


 Continue with Email

 Home
Home


