Graph

Raising Chart Finance PowerPoint Templates And PowerPoint Themes 0512
Microsoft Powerpoint Templates and Background with business graph-Raising Chart Finance PowerPoint Templates And PowerPoint Themes 0512-These PowerPoint designs and slide layouts can be used for themes relating to -Business graph, success, money, marketing, finance, shapes Our Raising Chart Finance PowerPoint Templates And PowerPoint Themes 0512 have a fetish for excellence. They just can't settle for anything less.

Successful Person Business PowerPoint Templates And PowerPoint Themes 0512
Microsoft Powerpoint Templates and Background with businessman and bar graph-Successful Person Business PowerPoint Templates And PowerPoint Themes 0512-These PowerPoint designs and slide layouts can be used for themes relating to -Businessman and bar graph, finance, people, business, shapes, success Feed their curiosity with our Successful Person Business PowerPoint Templates And PowerPoint Themes 0512. Arouse expectations with your thoughts.

Coins Growth Money PowerPoint Templates And PowerPoint Themes 0912
Coins Growth Money PowerPoint Templates And PowerPoint Themes Presentations-Microsoft Powerpoint Templates and Background with coins graph-Coins Growth Money PowerPoint Templates And PowerPoint Themes PresentationsThis PPT can be used for presentations relating to-Coins graph, arrows, money, finance, business, success Our Coins Growth Money PowerPoint Templates And PowerPoint Themes 0912 are committed to benefit you. They ensure your thoughts get the credit.

Financial Growth Business PowerPoint Templates And PowerPoint Themes 0912
Financial Growth Business PowerPoint Templates And PowerPoint Themes Presentations-Microsoft Powerpoint Templates and Background with coins business graph-Financial Growth Business PowerPoint Templates And PowerPoint Themes PresentationsThis PPT can be used for presentations relating to-Coins business graph, money, finance, business, success, marketing Enliven the experience with our Financial Growth Business PowerPoint Templates And PowerPoint Themes 0912. Give more colour to your bright thoughts.
Bar Chart Dollar Business PowerPoint Templates And PowerPoint Themes 0912
Bar Chart Dollar Business PowerPoint Templates And PowerPoint Themes 0912-Microsoft Powerpoint Templates and Background with dollar bar graph-Dollar bar graph, money, finance, success, future, business Make people notice your slides with our Bar Chart Dollar Business PowerPoint Templates And PowerPoint Themes 0912. You will be at the top of your game.

Case Study Sephora Usage Of Conversational AI Ppt Pictures Graphics PDF
This slide showcases case study analysis in which Sephora uses chatbot tool to optimize their offline and online store operations. It provides details about omnichannel experience, Sephora bot, product availability, beauty expert, etc. The best PPT templates are a great way to save time, energy, and resources. Slidegeeks have 100 percent editable powerpoint slides making them incredibly versatile. With these quality presentation templates, you can create a captivating and memorable presentation by combining visually appealing slides and effectively communicating your message. Download Case Study Sephora Usage Of Conversational AI Ppt Pictures Graphics PDF from Slidegeeks and deliver a wonderful presentation. This slide showcases case study analysis in which Sephora uses chatbot tool to optimize their offline and online store operations. It provides details about omnichannel experience, Sephora bot, product availability, beauty expert, etc.
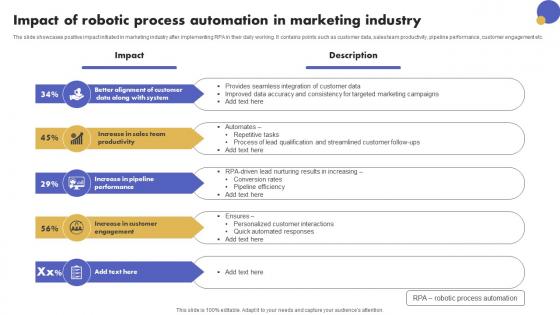
Impact Of Robotic Process Automation In Marketing Industry Graphics Pdf
The slide showcases positive impact initiated in marketing industry after implementing RPA in their daily working. It contains points such as customer data, sales team productivity, pipeline performance, customer engagement etc.Showcasing this set of slides titled Impact Of Robotic Process Automation In Marketing Industry Graphics Pdf The topics addressed in these templates are Provides Seamless, Targeted Marketing Campaigns, Qualification Streamlined All the content presented in this PPT design is completely editable. Download it and make adjustments in color, background, font etc. as per your unique business setting. The slide showcases positive impact initiated in marketing industry after implementing RPA in their daily working. It contains points such as customer data, sales team productivity, pipeline performance, customer engagement etc.
Business Financial Disaster PowerPoint Icon C
Headlines of the bad business economy and economic disaster cutouts in various fonts and colors. There are also some charts and graphs. Champion causes with our Business Financial Disaster PowerPoint Icon C. Download without worries with our money back guaranteee.
Business Financial Disaster PowerPoint Icon Cc
Headlines of the bad business economy and economic disaster cutouts in various fonts and colors. There are also some charts and graphs. Coach your organization with our Business Financial Disaster PowerPoint Icon Cc. You will come out on top.
Business Financial Disaster PowerPoint Icon S
Headlines of the bad business economy and economic disaster cutouts in various fonts and colors. There are also some charts and graphs. Achieve performance reengineering with our Business Financial Disaster PowerPoint Icon S. They will make you look good.
Financial Disaster Business PowerPoint Template 1110
Headlines of the bad business economy and economic disaster cutouts in various fonts and colors. There are also some charts and graphs. Decorate your thoughts with our Financial Disaster Business PowerPoint Template 1110. Take full advantage of their colourful appearance.
Expenses Business PowerPoint Background And Template 1210
Microsoft PowerPoint Template and Background with Office desk aranged in studio. A lot of numbers and graphs. Relieve anxiety with our Expenses Business PowerPoint Background And Template 1210. Your thoughts will flow smoothly with ease.
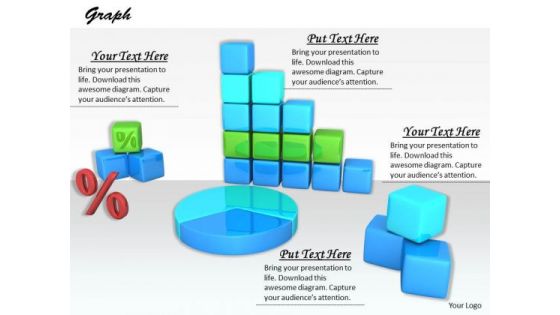
Stock Photo Design For Graphical Representations Of Data PowerPoint Slide
The above image contains a graphic of charts and graphs. Use this professional image in business or sales related presentations. It helps you to explain your plans in all earnest to your colleagues and raise the bar for all.
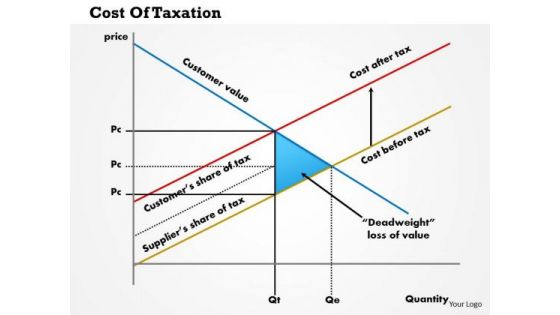
Business Framework Cost Of Taxation PowerPoint Presentation
This innovative image slide has been designed to display coat of taxation graph. This business framework template may be used to display financial ratios of taxation in your presentations. This image slide will impart professional appearance to your presentations.
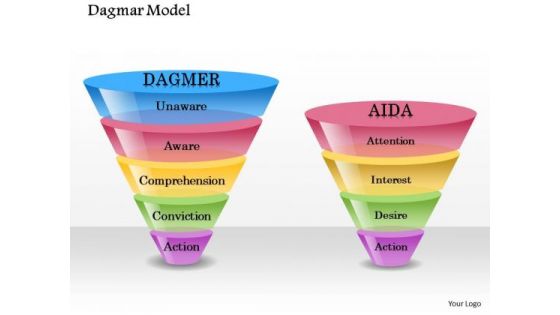
Business Framework Diagram Model PowerPoint Presentation
This Business framework Power Point template slide has been crafted with graphic of vertical graph. This PPT contains the concept of demand chain management. Use this PPT and build exclusive presentation.
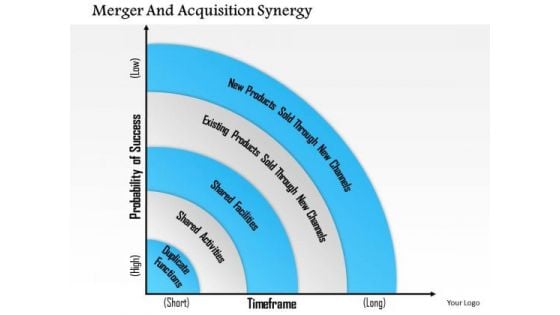
Business Framework Merger And Acquisition Synergy PowerPoint Presentation
This Power Point template slide has been designed with graphic of semicircular design for result display on graph. This design can be used for merger and acquisition for synergy. Use this PPT slide for your business presentation.
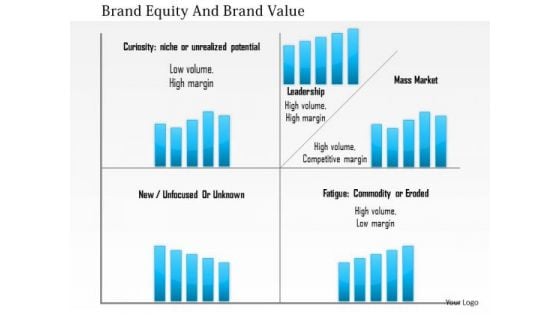
Business Diagram Brand Equity And Brand Value Presentation Template
Explain the concept of brand equity and brand value with this unique business diagram. This diagram slide contains the graphic of multiple bar graphs. Download this awesome diagram to capture your audiences attention.

Business Diagram Thermometer Graphics Indicating Progress Presentation Template
This power point template diagram has been designed with graphic of thermometer and bar graph. This PPT contains the concept of growth analysis. Use this PPT for business and marketing related presentations.
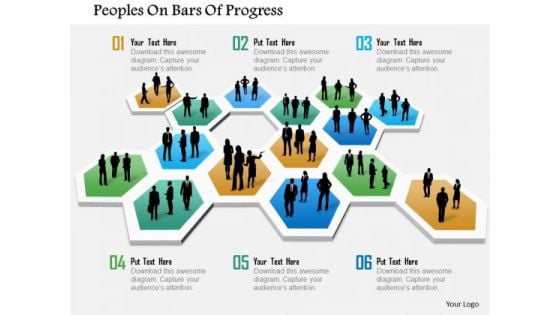
Business Diagram Peoples On Bars Of Progress Presentation Template
This power point template has been crafted with graphic of peoples and bar graph. This PPT contains the concept of progress and growth. Use this PPT for your business and marketing related presentations.
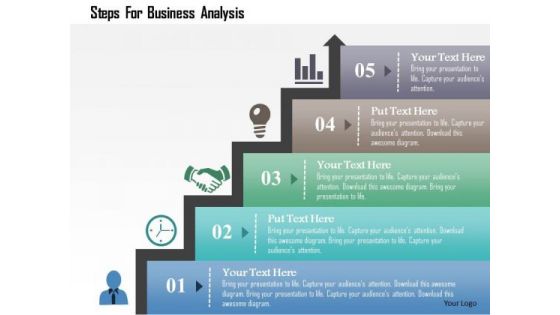
Business Diagram Steps For Business Analysis Presentation Template
Concept of time management has been defined in this power point template diagram. This diagram contains the graphic of bar graph. Amplify your thoughts via this appropriate business template.
Business Diagram Modern Icons On Pie Chart Presentation Template
Download this diagram to displays marketing strategy. This business diagram contains the graphic of icons on pie graph. Use this template to highlight the key issues of your presentation.
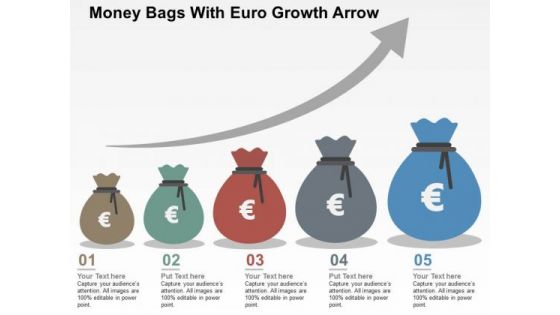
Money Bags With Euro Growth Arrow PowerPoint Templates
The above PPT slide contains graphics of money bag with Euro growth graph. This professionally designed slide may be used to depict financial growth analysis. This slide will help your viewers automatically empathize with your thoughts
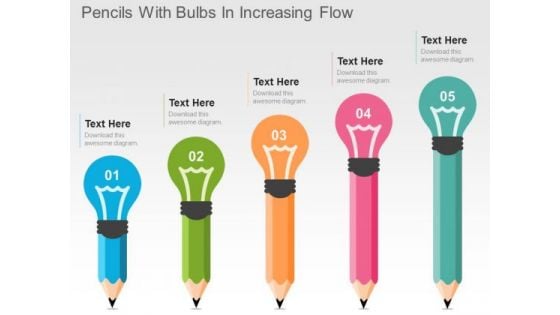
Pencils With Bulbs In Increasing Flow PowerPoint Templates
This slide has been designed with pencil bulb graph. This diagram is suitable to display creative ideas and strategy. This professional slide helps in making an instant impact on viewers.
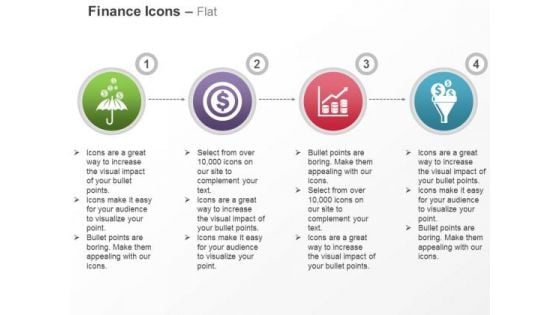
Dollar Over Umbrella Currency Growth Filteration Ppt Slides Graphics
This PPT slide displays graphics of dollar with umbrella, dollar target and growth graph. This PPT helps to depict concepts of financial saving and security. This icon slide is innovatively designed to highlight your worthy views
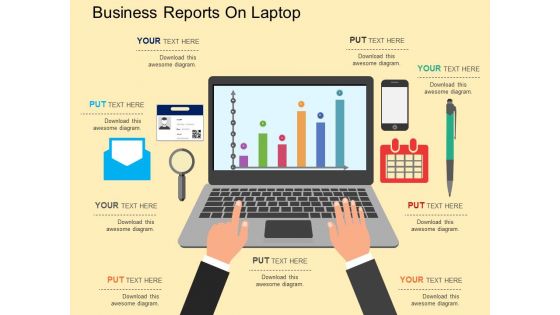
Business Reports On Laptop Powerpoint Template
This PPT slide has been designed with graphics of laptop on office table presenting statistical graph. This business diagram maybe used to exhibit management strategy. Use this diagram to build an exclusive presentation.
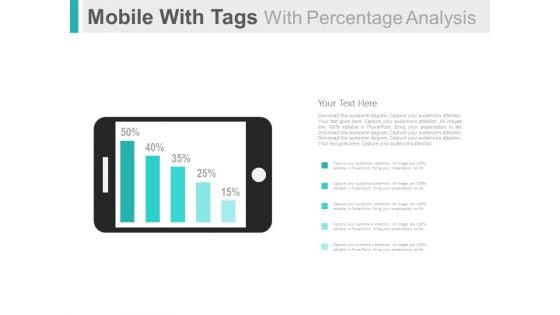
Mobile For Online Survey And Analysis Powerpoint Slides
This PowerPoint template has been designed with graphics of mobile and percentage bar graph. This PPT slide can be used to display online survey and analysis. You can download finance PowerPoint template to prepare awesome presentations.
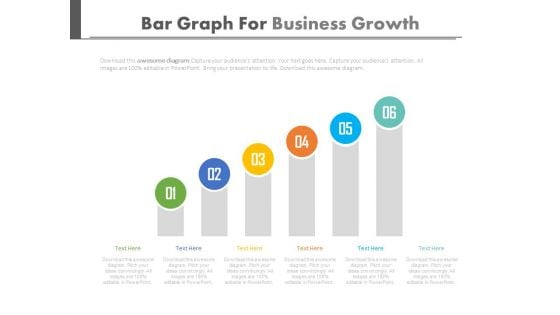
Setting Goals And Developing Strategies Powerpoint Slides
This PowerPoint template is useful for setting goals and developing strategies. This PPT background has a design of six steps bar graph. This PPT slide is suitable for topics like corporate strategic planning.
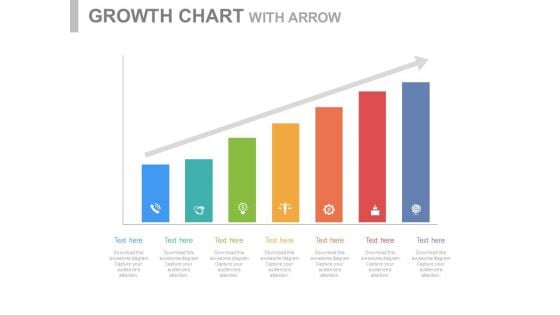
Steps For Developing Strategic Plan Powerpoint Slides
This PowerPoint template is useful for setting goals and developing strategies. This PPT background has a design of seven steps bar graph. This PPT slide is suitable for topics like corporate strategic planning.
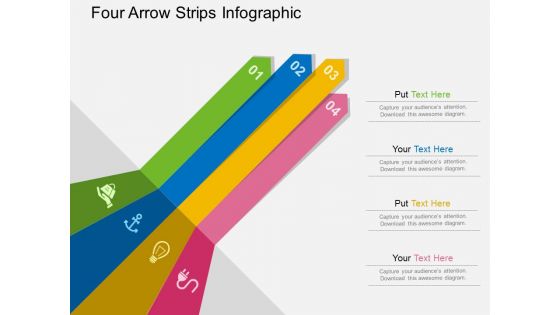
Four Arrow Strips Infographic Powerpoint Templates
Our above slide contains graphics of bulb with success graph. It helps to exhibit planning for growth. Use this diagram to impart more clarity to data and to create more sound impact on viewers.
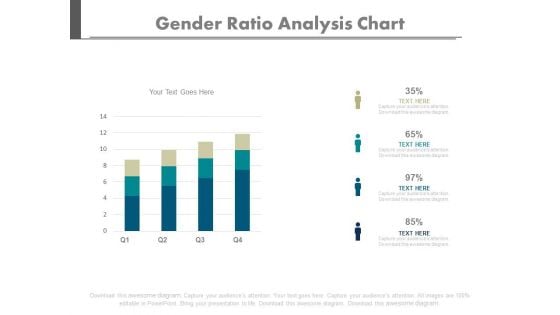
Four Bars Gender Population Ratio Chart Powerpoint Slides
Create dynamic presentations with our creative template of bar graph. This diagram may be used to present gender population. Download this template to leave permanent impression on your audience.
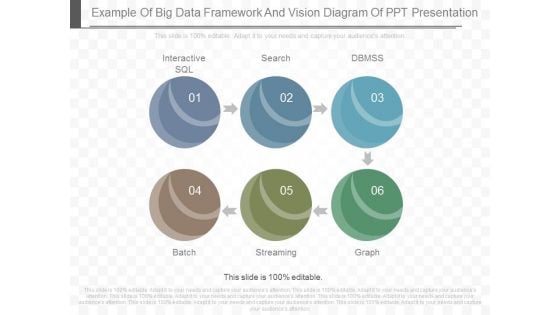
Example Of Big Data Framework And Vision Diagram Of Ppt Presentation
This is a example of big data framework and vision diagram of ppt presentation. This is a six stage process. The stages in this process are interactive sql, search, dbmss, batch, streaming, graph.
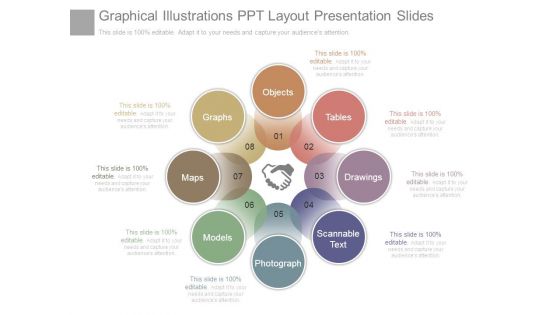
Graphical Illustrations Ppt Layout Presentation Slides
This is a graphical illustrations ppt layout presentation slides. This is a eight stage process. The stages in this process are graphs, maps, models, photograph, scannable text, drawings, tables, objects.
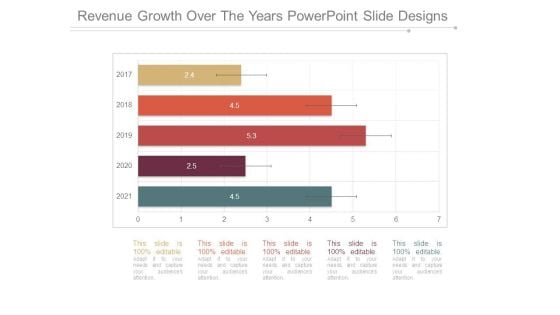
Revenue Growth Over The Years Powerpoint Slide Designs
This is a revenue growth over the years powerpoint slide designs. This is a five stage process. The stages in this process are bar graph, years, business, growth, marketing.
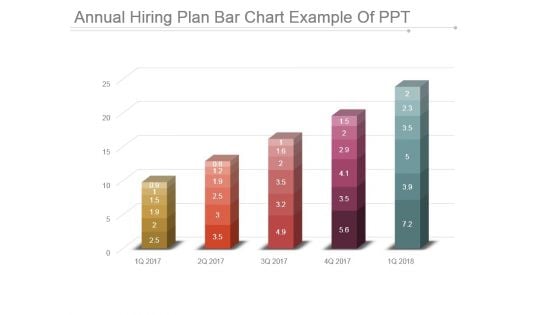
Annual Hiring Plan Bar Chart Example Of Ppt
This is a annual hiring plan bar chart example of ppt. This is a five stage process. The stages in this process are bar graph, business, marketing, growth, success.
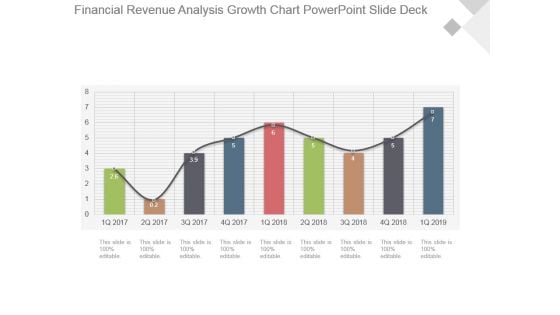
Financial Revenue Analysis Growth Chart Powerpoint Slide Deck
This is a financial revenue analysis growth chart powerpoint slide deck. This is a nine stage process. The stages in this process are growth, success, business, marketing, bar graph.
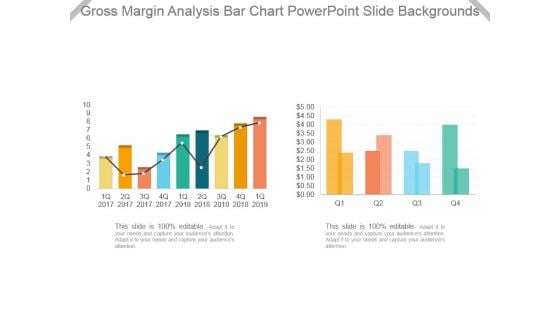
Gross Margin Analysis Bar Chart Powerpoint Slide Backgrounds
This is a gross margin analysis bar chart powerpoint slide backgrounds. This is a two stage process. The stages in this process are bar graph, business, marketing, growth, success.
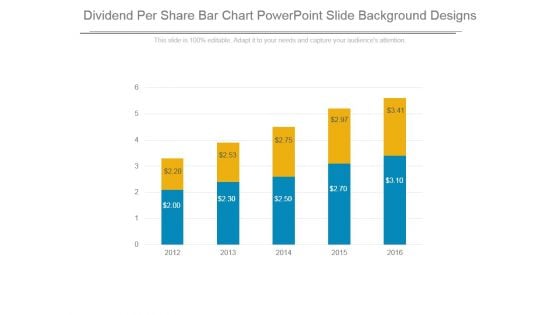
Dividend Per Share Bar Chart Powerpoint Slide Background Designs
This is a dividend per share bar chart powerpoint slide background designs. This is a five stage process. The stages in this process are business, marketing, success, growth, bar graph.
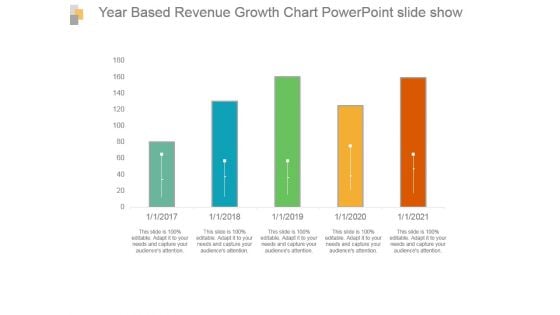
Year Based Revenue Growth Chart Powerpoint Slide Show
This is a year based revenue growth chart powerpoint slide show. This is a five stage process. The stages in this process are bar graph, growth, revenue, year, success.
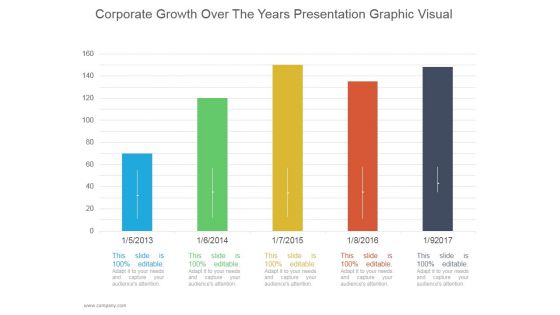
Corporate Growth Over The Years Ppt PowerPoint Presentation Good
This is a corporate growth over the years ppt powerpoint presentation good. This is a five stage process. The stages in this process are business, strategy, marketing, growth, bar graph.
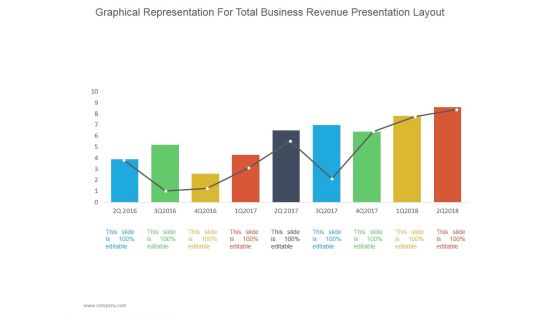
Graphical Representation For Total Business Revenue Ppt PowerPoint Presentation Diagrams
This is a graphical representation for total business revenue ppt powerpoint presentation diagrams. This is a nine stage process. The stages in this process are business, strategy, line chart, bar graph, marketing, management.
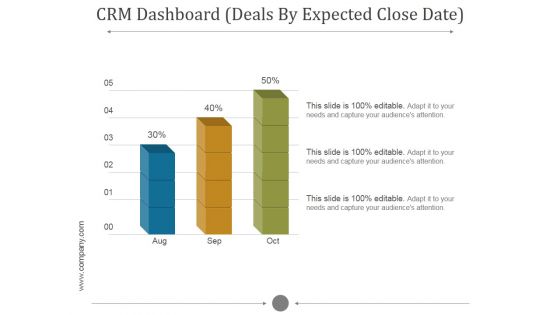
Crm Dashboard Deals By Expected Close Date Ppt PowerPoint Presentation Background Images
This is a crm dashboard deals by expected close date ppt powerpoint presentation background images. This is a five stage process. The stages in this process are bar graph, aug, sep, oct, growth.
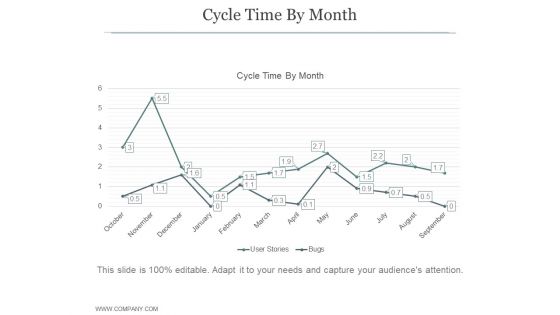
Cycle Time By Month Ppt PowerPoint Presentation Guidelines
This is a cycle time by month ppt powerpoint presentation guidelines. This is a twelve stage process. The stages in this process are business, strategy, marketing, process, arrow, finance, bar graph.
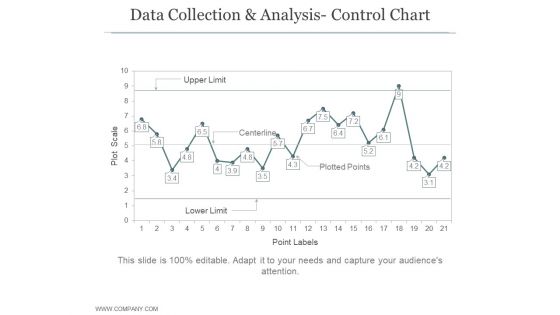
Data Collection And Analysis Control Chart Ppt PowerPoint Presentation Example File
This is a data collection and analysis control chart ppt powerpoint presentation example file. This is a four stage process. The stages in this process are business, strategy, marketing, bar graph, growth strategy.
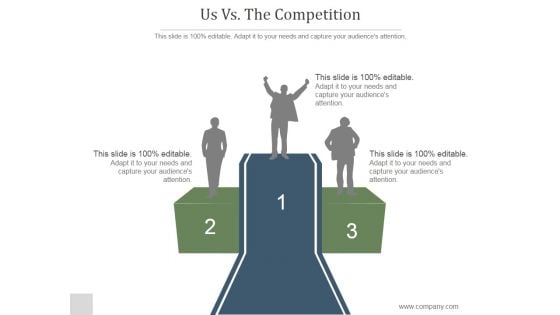
Us Vs The Competition Slide Ppt PowerPoint Presentation Examples
This is a us vs the competition slide ppt powerpoint presentation examples. This is a five stage process. The stages in this process are year, graph, marketing, year, management.
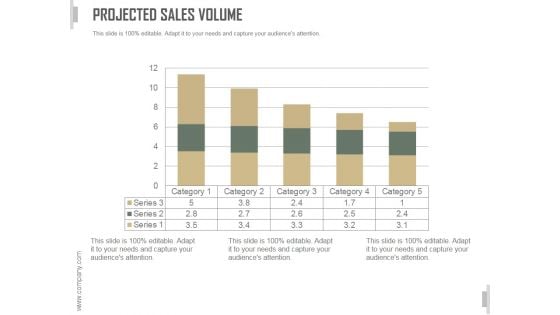
Projected Sales Volume Ppt PowerPoint Presentation Pictures
This is a projected sales volume ppt powerpoint presentation pictures. This is a five stage process. The stages in this process are business, strategy, marketing, analysis, liner process, bar graph.
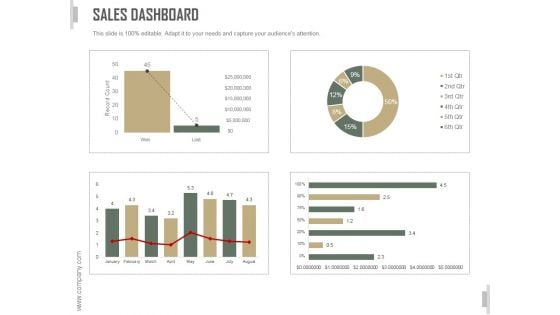
Sales Dashboard Slide Ppt PowerPoint Presentation Template
This is a sales dashboard slide ppt powerpoint presentation template. This is a three stage process. The stages in this process are business, strategy, marketing, analysis, bar graph, growth strategy.
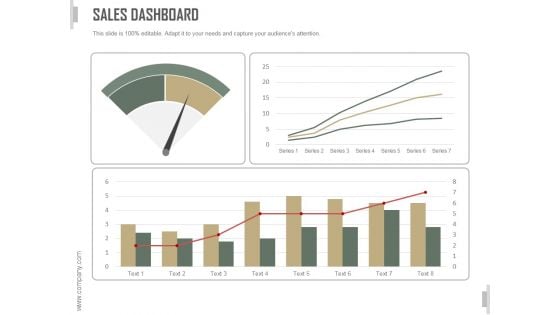
Sales Dashboard Ppt PowerPoint Presentation Design Templates
This is a sales dashboard ppt powerpoint presentation design templates. This is a four stage process. The stages in this process are business, strategy, marketing, analysis, bar graph, growth strategy.

Quarter Track Record Ppt PowerPoint Presentation Samples
This is a quarter track record ppt powerpoint presentation samples. This is a two stage process. The stages in this process are business, strategy, marketing, analysis, growth strategy, bar graph.
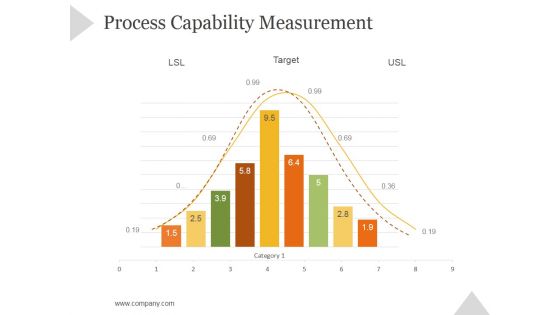
Process Capability Measurement Ppt PowerPoint Presentation Rules
This is a process capability measurement ppt powerpoint presentation rules. This is a nine stage process. The stages in this process are business, strategy, marketing, success, bar graph, growth strategy.
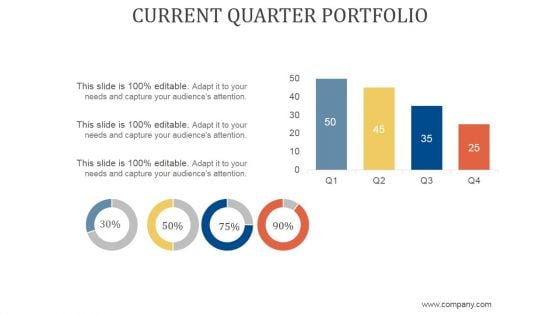
Current Quarter Portfolio Ppt PowerPoint Presentation Visual Aids
This is a current quarter portfolio ppt powerpoint presentation visual aids. This is a two stage process. The stages in this process are business, strategy, marketing, finance, growth strategy, bar graph.
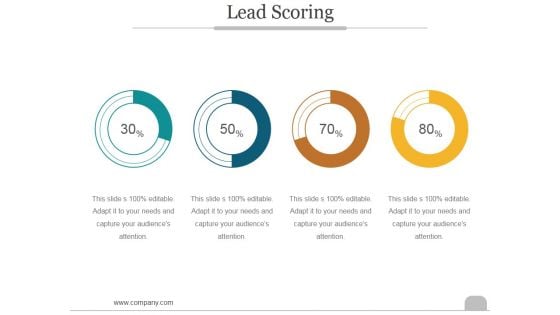
Lead Scoring Template Ppt PowerPoint Presentation Model
This is a lead scoring template ppt powerpoint presentation model. This is a four stage process. The stages in this process are business, marketing, success, bar graph, lead scoring.

Business Plan Executive Summary Ppt PowerPoint Presentation Complete Deck With Slides
This is a business plan executive summary ppt powerpoint presentation complete deck with slides. This is a one stage process. The stages in this process are business, marketing, graph, management, communication.
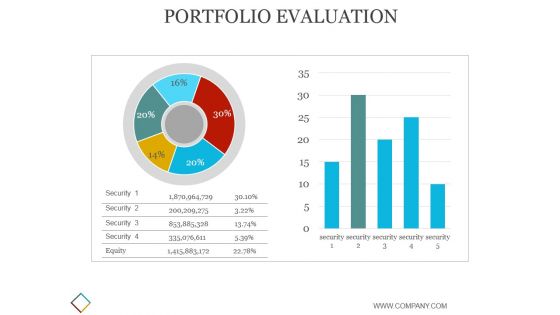
Portfolio Evaluation Template 2 Ppt PowerPoint Presentation Picture
This is a portfolio evaluation template 2 ppt powerpoint presentation picture. This is a five stage process. The stages in this process are business, strategy, marketing, analysis, finance, chart and graph.
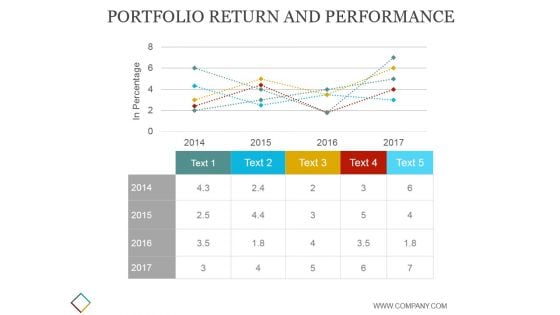
Portfolio Return And Performance Template Ppt PowerPoint Presentation Visuals
This is a portfolio return and performance template ppt powerpoint presentation visuals. This is a five stage process. The stages in this process are business, strategy, marketing, analysis, finance, chart and graph, growth.

Service Design Document Template 1 Ppt PowerPoint Presentation Portfolio
This is a service design document template 1 ppt powerpoint presentation portfolio. This is a five stage process. The stages in this process are business, marketing, success, graph, points.
Revenue Generation Company Performance Ppt PowerPoint Presentation Icon
This is a revenue generation company performance ppt powerpoint presentation icon. This is a four stage process. The stages in this process are finance, planning, chart graph, marketing, strategy.
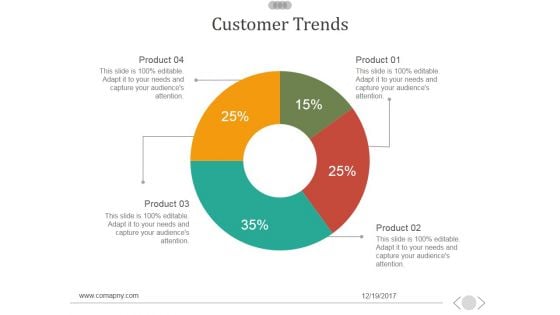
Customer Trends Template 1 Ppt PowerPoint Presentation Diagrams
This is a customer trends template 1 ppt powerpoint presentation diagrams. This is a five stage process. The stages in this process are business, marketing, bar graph, finance, management.
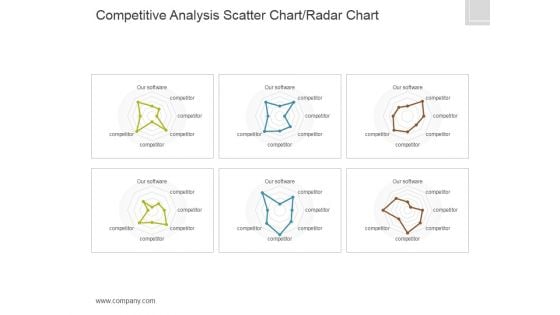
Competitive Analysis Template 4 Scatter Chart Radar Chart Ppt PowerPoint Presentation Topics
This is a competitive analysis template 4 scatter chart radar chart ppt powerpoint presentation topics. This is a six stage process. The stages in this process are business, analysis, graph, marketing, scatter.
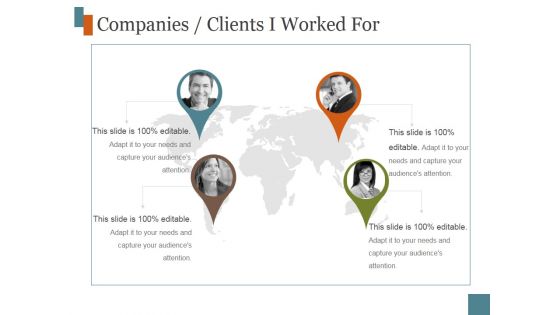
Companies Clients I Worked For Ppt PowerPoint Presentation Samples
This is a companies clients i worked for ppt powerpoint presentation samples. This is a four stage process. The stages in this process are management, icons, strategy, business, graph, location.
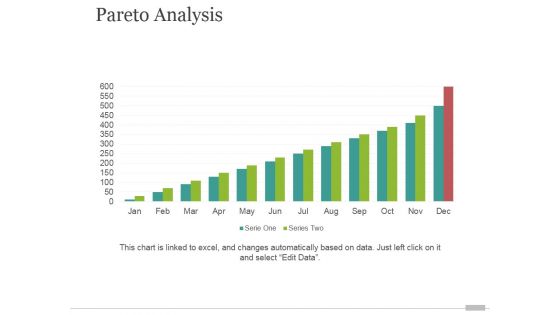
Pareto Analysis Tamplate 2 Ppt PowerPoint Presentation Graphics
This is a pareto analysis tamplate 2 ppt powerpoint presentation graphics. This is a twelve stage process. The stages in this process are bar graph, finance, marketing, strategy, analysis, business.


 Continue with Email

 Home
Home


