Graph
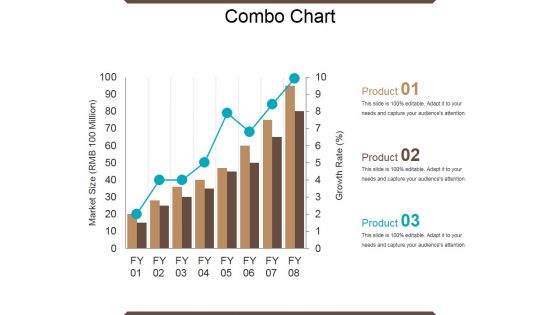
Combo Chart Ppt PowerPoint Presentation Outline Model
This is a combo chart ppt powerpoint presentation outline model. This is a eight stage process. The stages in this process are market size, growth rate, growth, success, graph.
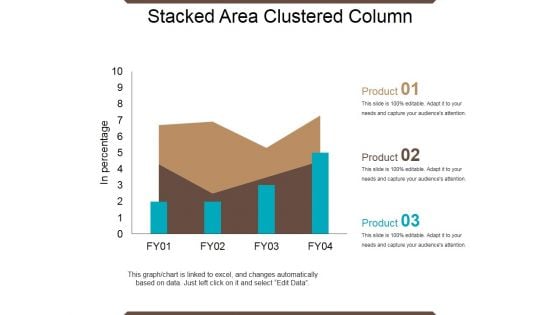
Stacked Area Clustered Column Ppt PowerPoint Presentation Show Guidelines
This is a stacked area clustered column ppt powerpoint presentation show guidelines. This is a four stage process. The stages in this process are in percentage, product, bar graph, growth, success.
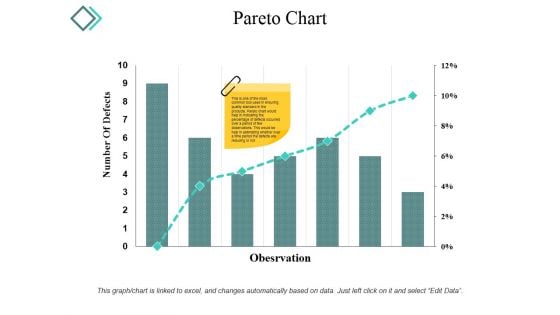
Pareto Chart Ppt PowerPoint Presentation Infographic Template Microsoft
This is a pareto chart ppt powerpoint presentation infographic template microsoft. This is a seven stage process. The stages in this process are number of defects, observation, graph, percentage, business.
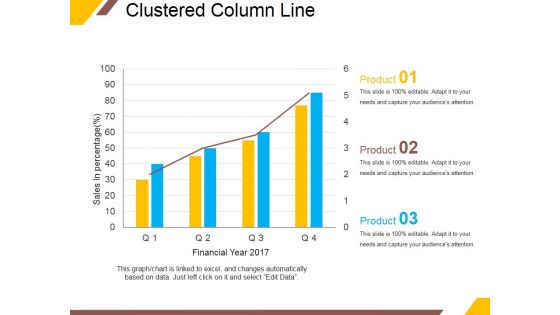
Clustered Column Line Ppt PowerPoint Presentation Portfolio Outline
This is a clustered column line ppt powerpoint presentation portfolio outline. This is a four stage process. The stages in this process are sales in percentage, financial year, product, graph, growth.
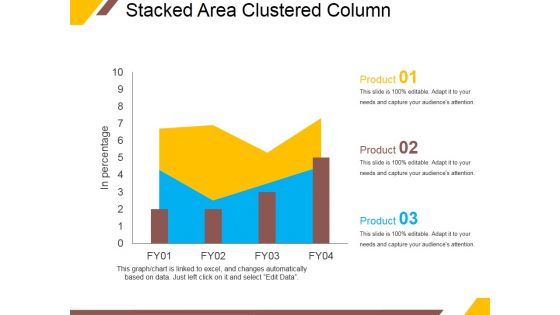
Stacked Area Clustered Column Ppt PowerPoint Presentation Inspiration Shapes
This is a stacked area clustered column ppt powerpoint presentation inspiration shapes. This is a four stage process. The stages in this process are in percentage, product, growth, success, graph.
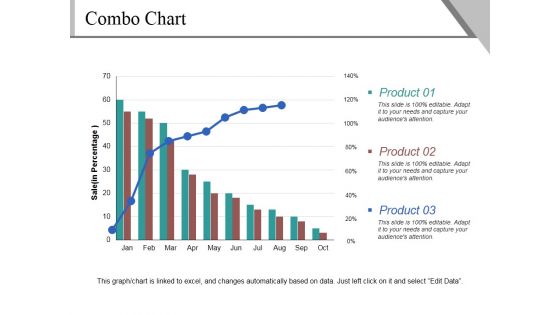
Combo Chart Ppt PowerPoint Presentation Ideas Visual Aids
This is a combo chart ppt powerpoint presentation ideas visual aids. This is a three stage process. The stages in this process are product, sales, bar graph, business, marketing.
Bar Chart Ppt PowerPoint Presentation Icon Demonstration
This is a bar chart ppt powerpoint presentation icon demonstration. This is a seven stage process. The stages in this process are product, sales in percentage, financial year, graph.
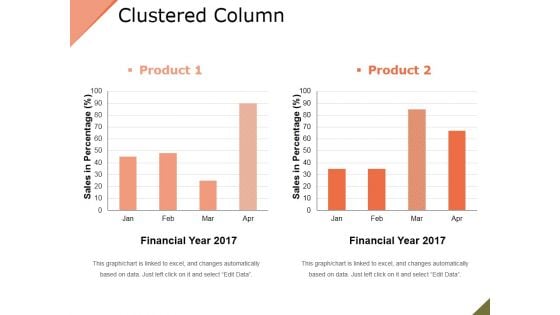
Clustered Column Ppt PowerPoint Presentation File Slide
This is a clustered column ppt powerpoint presentation file slide. This is a two stage process. The stages in this process are product, financial year, sales in percentage, bar graph.

Clustered Column Line Ppt PowerPoint Presentation Slide
This is a clustered column line ppt powerpoint presentation slide. This is a three stage process. The stages in this process are bar graph, growth, finance, product, sales in percentage.
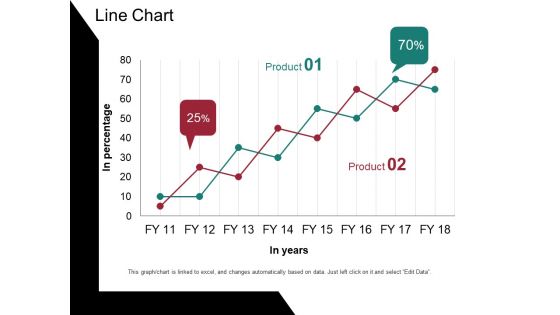
Line Chart Ppt PowerPoint Presentation Portfolio Design Templates
This is a line chart ppt powerpoint presentation portfolio design templates. This is a two stage process. The stages in this process are in percentage, in years, percentage, business, graph.

New Business Marketing Strategy Financing Expense Model Ppt PowerPoint Presentation Complete Deck With Slides
This is a new business marketing strategy financing expense model ppt powerpoint presentation complete deck with slides. This is a one stage process. The stages in this process are business, marketing, strategy, growth, graph.
Combo Chart Ppt PowerPoint Presentation Icon Slide
This is a combo chart ppt powerpoint presentation icon slide. This is a three stage process. The stages in this process are growth rate, market size, graph, business, marketing.
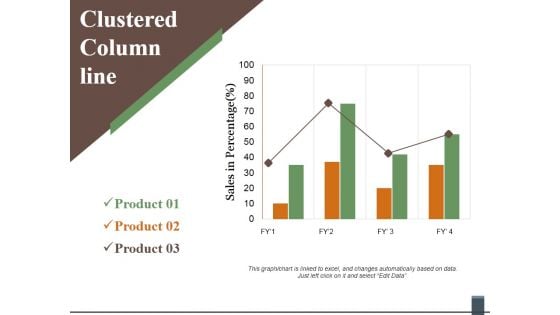
Clustered Column Line Ppt PowerPoint Presentation Inspiration Guidelines
This is a clustered column line ppt powerpoint presentation inspiration guidelines. This is a three stage process. The stages in this process are product, sales in percentage, graph, line, finance, business.
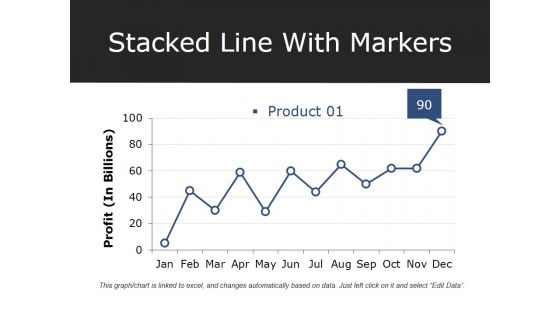
Stacked Line With Markers Ppt PowerPoint Presentation Professional Deck
This is a stacked line with markers ppt powerpoint presentation professional deck. This is a one stage process. The stages in this process are product, profit, growth, success, graph.
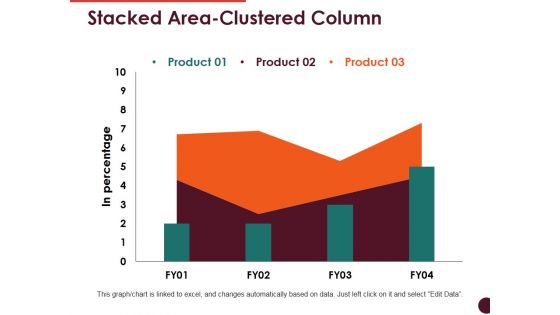
Stacked Area Clustered Column Ppt PowerPoint Presentation Summary Professional
This is a stacked area clustered column ppt powerpoint presentation summary professional. This is a three stage process. The stages in this process are product, bar graph, growth, success, in percentage.
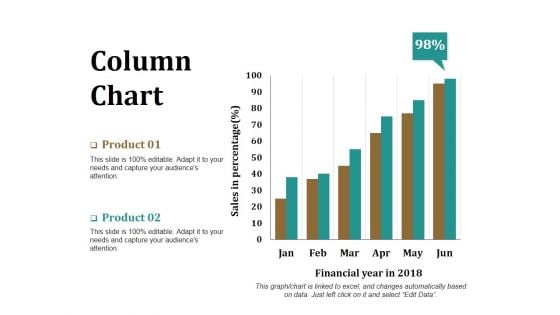
Column Chart Ppt PowerPoint Presentation Model Graphics Download
This is a column chart ppt powerpoint presentation model graphics download. This is a two stage process. The stages in this process are product, financial year, sales in percentage, bar graph, success.
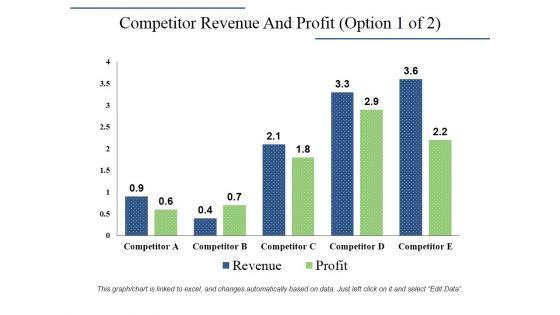
Competitor Revenue And Profit Template 1 Ppt PowerPoint Presentation Infographic Template Designs Download
This is a competitor revenue and profit template 1 ppt powerpoint presentation infographic template designs download. This is a five stage process. The stages in this process are revenue, profit, competitor, bar graph, growth.
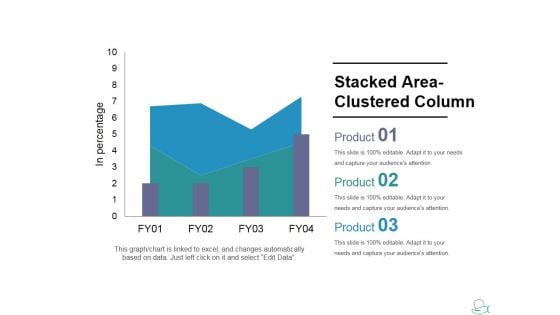
Stacked Area Clustered Column Ppt PowerPoint Presentation Slides Shapes
This is a stacked area clustered column ppt powerpoint presentation slides shapes. This is a three stage process. The stages in this process are product, growth, success graph, business.
Product Launch Budget Plan Ppt PowerPoint Presentation Icon Slide
This is a product launch budget plan ppt powerpoint presentation icon slide. This is a seven stage process. The stages in this process are bar graph, icons, percentage, finance, business.
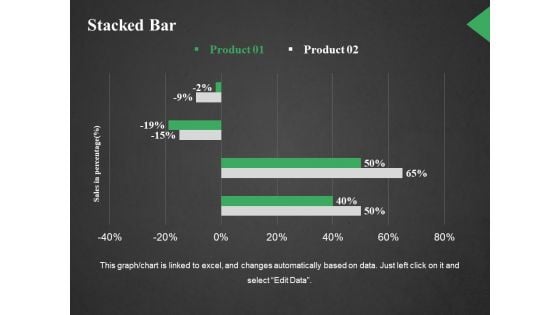
Stacked Bar Ppt PowerPoint Presentation Portfolio Background Image
This is a two stacked bar ppt powerpoint presentation portfolio background image. This is a two stage process. The stages in this process are sales in percentage, graph, business, marketing, strategy.
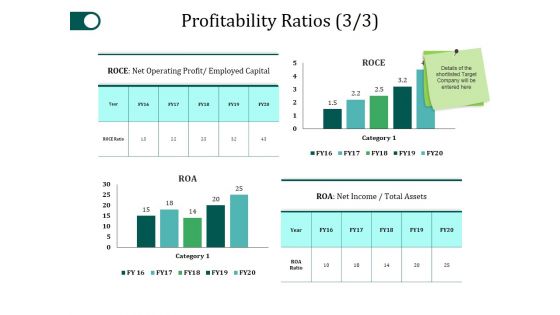
Profitability Ratios Template 3 Ppt PowerPoint Presentation Gallery Slide Portrait
This is a profitability ratios template 3 ppt powerpoint presentation gallery slide portrait. This is a four stage process. The stages in this process are category, roce, net income, business, bar graph.
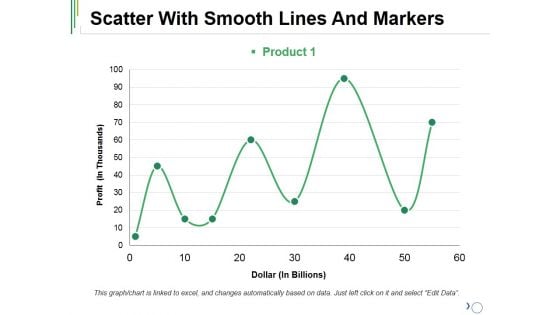
Scatter With Smooth Lines And Markers Ppt PowerPoint Presentation Outline Mockup
This is a scatter with smooth lines and markers ppt powerpoint presentation outline mockup. This is a one stage process. The stages in this process are product, finance, line graph, business, management.
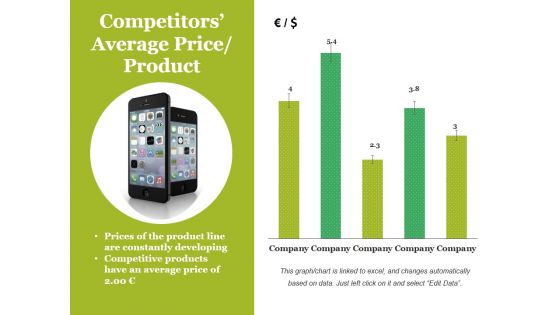
Competitors Average Price Product Ppt PowerPoint Presentation File Pictures
This is a competitors average price product ppt powerpoint presentation file pictures. This is a five stage process. The stages in this process are bar graph, business, marketing, finance, company.
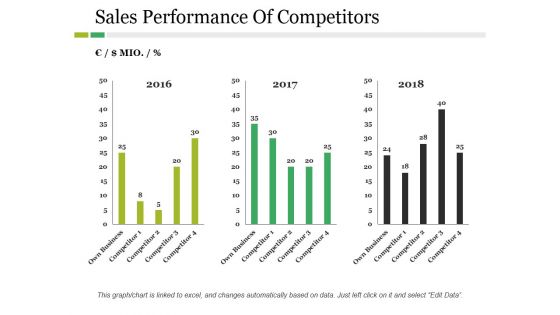
Sales Performance Of Competitors Ppt PowerPoint Presentation Inspiration Example
This is a sales performance of competitors ppt powerpoint presentation inspiration example. This is a three stage process. The stages in this process are business, marketing, year, bar graph, finance.
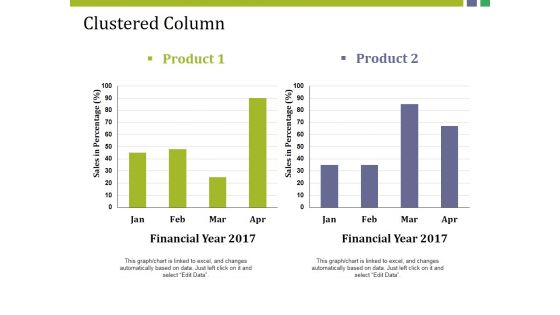
Clustered Column Ppt PowerPoint Presentation Gallery Structure
This is a clustered column ppt powerpoint presentation gallery structure. This is a two stage process. The stages in this process are product, sales in percentage, financial year, bar graph, finance.

Market Potential Ppt PowerPoint Presentation Complete Deck With Slides
This is a market potential ppt powerpoint presentation complete deck with slides. This is a one stage process. The stages in this process are market, potential, business, management, bar graph.
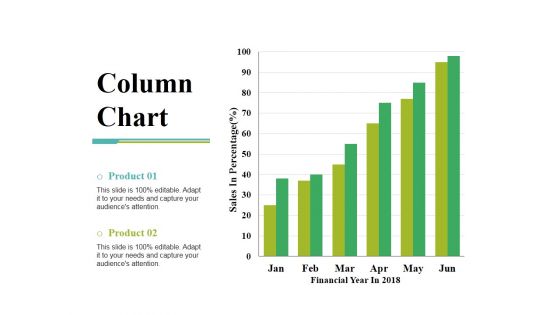
Column Chart Ppt PowerPoint Presentation Gallery Slide Portrait
This is a column chart ppt powerpoint presentation gallery slide portrait. This is a two stage process. The stages in this process are sales in percentage, financial year, product, bar graph, growth.
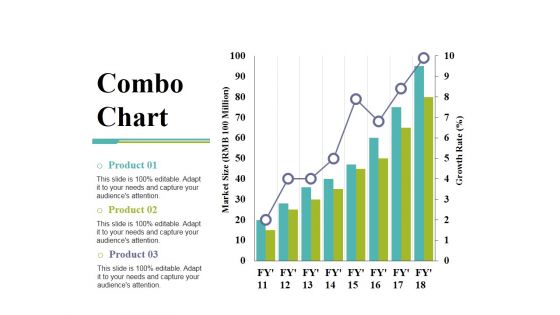
Combo Chart Ppt PowerPoint Presentation Show Deck
This is a combo chart ppt powerpoint presentation show deck. This is a three stage process. The stages in this process are growth rate, market size, product, bar graph, growth.
Competitors Average Price Product Ppt PowerPoint Presentation Icon Layout
This is a competitors average price product ppt powerpoint presentation icon layout. This is a five stage process. The stages in this process are company, bar graph, finance, business, marketing.
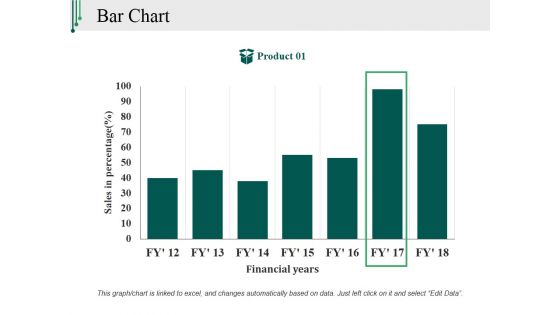
Bar Chart Ppt PowerPoint Presentation Outline Backgrounds
This is a bar chart ppt powerpoint presentation outline backgrounds. This is a one stage process. The stages in this process are sales in percentage, financial years, product, bar graph, finance.
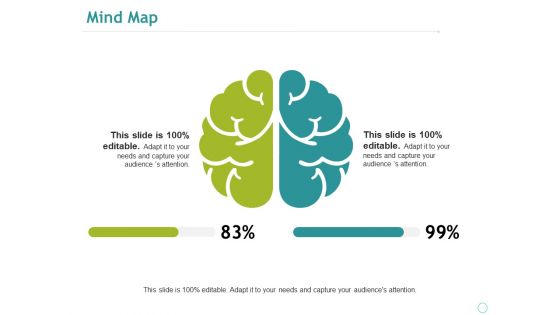
Mind Map Ppt PowerPoint Presentation Portfolio Show
This is a mind map ppt powerpoint presentation portfolio show. This is a two stage process. The stages in this process are business, percentage, graph, mind map, management, brain.
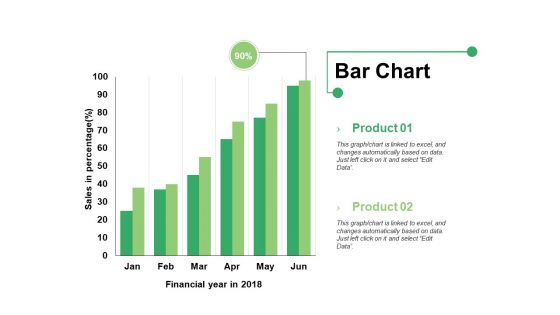
Bar Chart Ppt PowerPoint Presentation Infographics Format Ideas
This is a bar chart ppt powerpoint presentation infographics format ideas. This is a two stage process. The stages in this process are bar graph, product, financial year, sales in percentage.
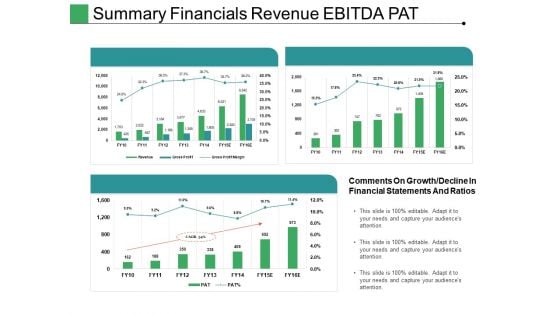
Summary Financials Revenue Ebitda Pat Ppt PowerPoint Presentation Ideas Tips
This is a summary financials revenue ebitda pat ppt powerpoint presentation ideas tips. This is a three stage process. The stages in this process are comments on growth, bar graph, growth, success, business.
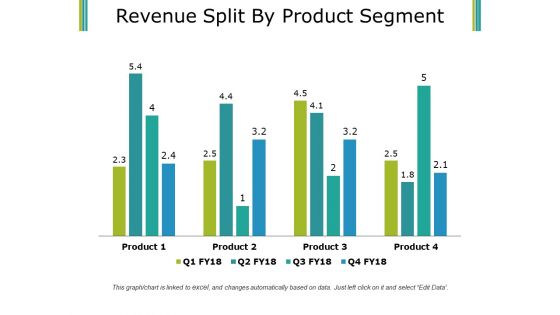
Revenue Split By Product Segment Template 1 Ppt PowerPoint Presentation Infographics Smartart
This is a revenue split by product segment template 1 ppt powerpoint presentation infographics smartart. This is a four stage process. The stages in this process are business, finance, marketing, bar graph, product.
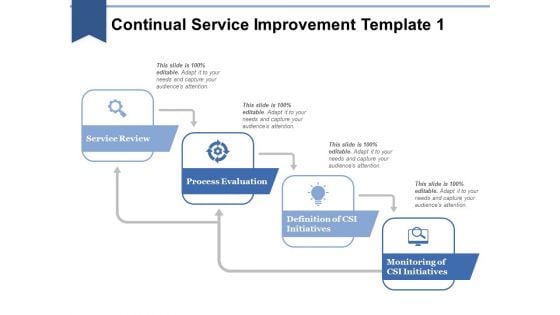
Continual Service Improvement Template 1 Ppt PowerPoint Presentation Ideas Example Topics
This is a continual service improvement template 1 ppt powerpoint presentation ideas example topics. This is a four stage process. The stages in this process are business, marketing, combo chart, finance, graph.
Clustered Column Ppt PowerPoint Presentation Icon Objects
This is a clustered column ppt powerpoint presentation icon objects. This is a two stage process. The stages in this process are clustered column, product, growth, finance, bar graph.
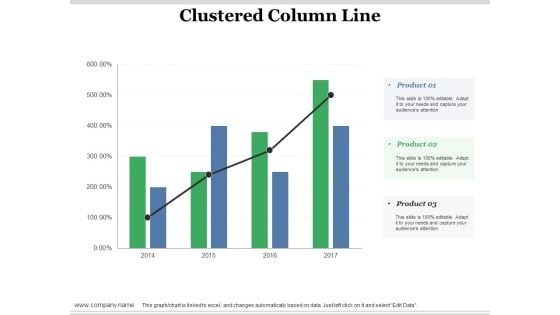
Clustered Column Line Ppt PowerPoint Presentation Professional
This is a clustered column line ppt powerpoint presentation professional. This is a three stage process. The stages in this process are clustered column line, product, bar graph, marketing, finance.
Column Chart Ppt PowerPoint Presentation Icon Show
This is a column chart ppt powerpoint presentation icon show. This is a two stage process. The stages in this process are column chart, product, years, bar graph, growth.
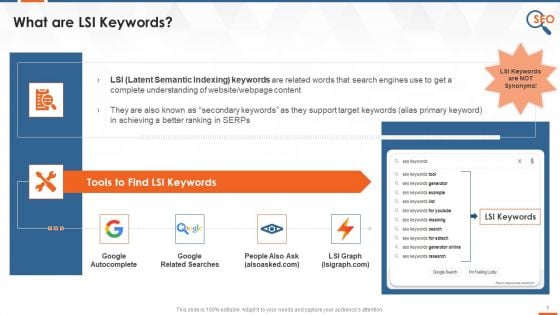
Latent Semantic Indexing Keywords In SEO Training Ppt
This slide provides an overview of LSI keywords in SEO. It also includes details of tools to find appropriate latent semantic indexing keywords such as Google autocomplete and related searches, LSI graph, etc.
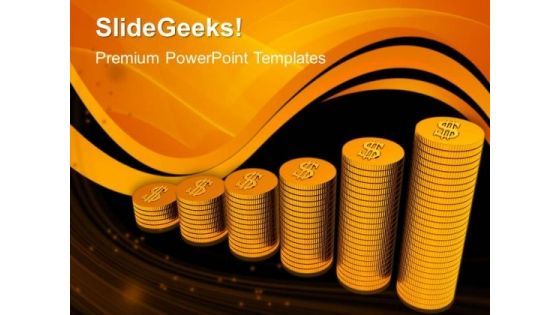
Coins Investment PowerPoint Templates And PowerPoint Themes 1012
Coins Investment PowerPoint Templates And PowerPoint Themes 1012-Use this PowerPoint Template to signify the concept of Bar graph. It consists of the coins forming the Bar graph. This image has been conceived to enable you to emphatically communicate your ideas in your Business PPT presentation. Original thinking is the need of the hour. We provide the means to project your views.-Coins Investment PowerPoint Templates And PowerPoint Themes 1012-This PowerPoint template can be used for presentations relating to-Gold coins, business, money, finance, success, signs Decrease conflict with your thoughts.Enable communication with our Coins Investment PowerPoint Templates And PowerPoint Themes 1012.
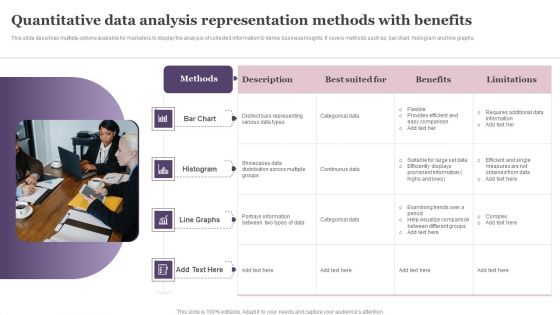
Quantitative Data Analysis Representation Methods With Benefits Template PDF
This slide describes multiple options available for marketers to display the analysis of collected information to derive business insights. It covers methods such as, bar chart, histogram and line graphs. Persuade your audience using this Quantitative Data Analysis Representation Methods With Benefits Template PDF. This PPT design covers four stages, thus making it a great tool to use. It also caters to a variety of topics including Bar Chart, Histogram, Line Graphs. Download this PPT design now to present a convincing pitch that not only emphasizes the topic but also showcases your presentation skills.
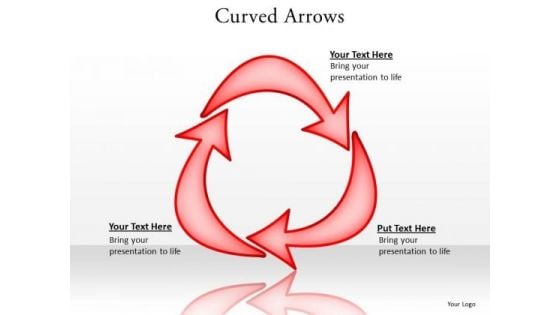
Ppt Curved Arrows Pointer Inwards Editable PowerPoint World Map Templates
PPT curved arrows Pointer inwards editable powerpoint world map Templates--PowerPoint presentations on Art, Black, Blue, Button, Chart, Clip, Diagram, Graph, Green, Icon, Illustration, Isolated, Process, Really, Red, Round, Rss, Set-PPT curved arrows Pointer inwards editable powerpoint world map Templates Hit exceptional ratings with our Ppt Curved Arrows Pointer Inwards Editable PowerPoint World Map Templates. Astound the audience with your display.
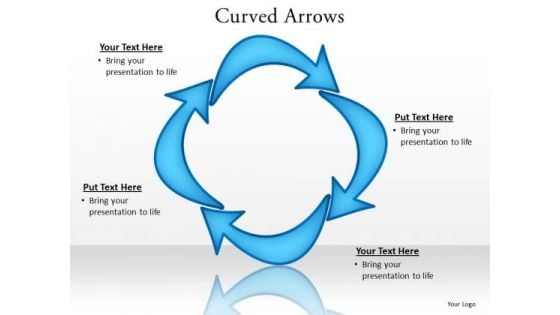
Ppt Curved Arrows Pointer Inwards PowerPoint Templates
PPT curved arrows Pointer inwards PowerPoint Templates--PowerPoint presentations on Art, Black, Blue, Button, Chart, Clip, Diagram, Graph, Green, Icon, Illustration, Isolated, Process, Really, Red, Round, Rss, Set-PPT curved arrows Pointer inwards PowerPoint Templates Deliver your feedback on our Ppt Curved Arrows Pointer Inwards PowerPoint Templates. Your team will comprehend your advice.

Dollar Profits Growth PowerPoint Templates And PowerPoint Themes 1012
Deliver amazing Presentations with our above template showing profit and growth bar graph. Adjust the above image in your PPT presentations to visually support your content in your Business PPT slideshows marketing, finance, success and strategy. Deliver amazing presentations to mesmerize your audience. Get ahead despite fierce competition. Accelerate away from the pack with our Dollar Profits Growth PowerPoint Templates And PowerPoint Themes 1012.
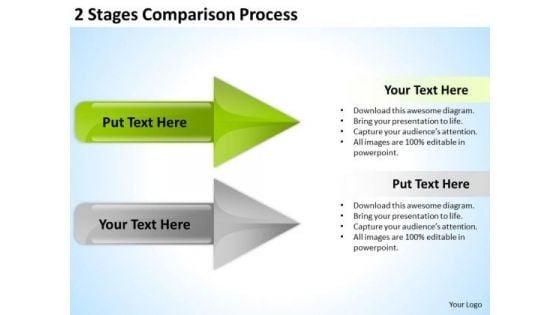
PowerPoint Arrow Shapes Comparison Process Ppt Templates Backgrounds For Slides
3d, accounting, arrow, art, bar, blue, business, calculation, chart, collection, company, design elements, diagram, directive, expense, finance, firm, forecast, future, gain, graph, grow, growth, icon, illustration, income, line, market, measure, objects, office, profit, progress, rate, set, statistic, stock, success, two, up, vector, yellow Get on the list of audience favourites. Experience adulation with our PowerPoint Arrow Shapes Comparison Process Ppt Templates Backgrounds For Slides.
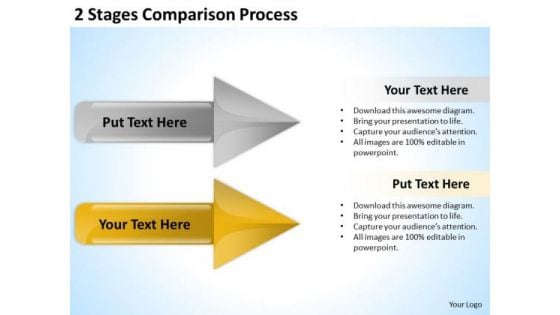
PowerPoint Circular Arrows Comparison Process Templates Backgrounds For Slides
3d, arrow, arrow button, arrow vector, art, background, blank, blue, business, button, chart, clip, decoration, diagram, direction, drop, element, empty, finance, flow, four, graph, graphic, green, illustration, isometric, presentation, process, red, shape, sign, step, symbol, template, text, vector, white, yellow Our PowerPoint Circular Arrows Comparison Process Templates Backgrounds For Slides help the audience catch on fast. They assist them in quick assimilation.
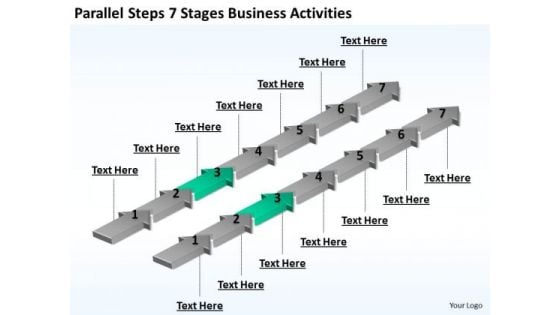
Power Point Arrows New Business PowerPoint Presentation Activities Templates
3d, arrow, background, banner, blank, business, business concept, chart, color, colorful, description, development, diagram, direction, element, empty, financial, flow, flowchart, four, future, gradient, graph, graphic, illustration, isolated, mirrored, object, placeholder, presentation, process, section, segment, set, shape, sign, steps, symbol, template, text, topic, vector Experiment and evaluate with our Power Point Arrows New Business PowerPoint Presentation Activities Templates. Be assured of accurate results.
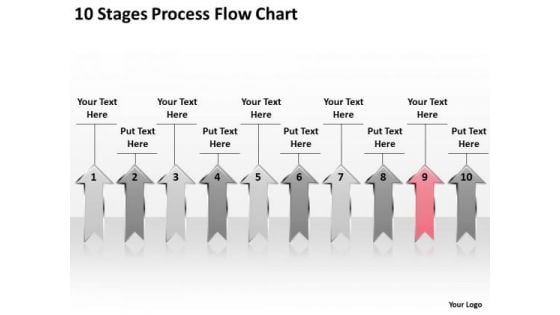
PowerPoint Arrows 10 Stages Process Flow Chart Ppt 9 Slides
arrow, art, background, blank, blue, business, chart, clip, diagram, drop, eps10, flow, four, graph, graphic, gray, green, heat, illustration, map, process, red, shadow, shape, step, symbol, transparency, vector, white, yellow Fetch up with our PowerPoint Arrows 10 Stages Process Flow Chart Ppt 9 Slides. You will be applauded wherever you go.
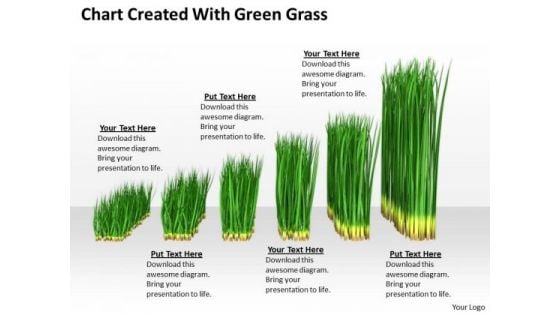
Stock Photo Green Grass Business Growth Chart PowerPoint Slide
This PowerPoint slide display chart created with green grass. This image slide has been crafted with graphic of green grass bar graph. This image depicts business. Use this image slide to express views on targets, goals, growth and management in your presentations. This image slide exhibits various information which requires visual aid. Enhance the quality of your presentations using this image.
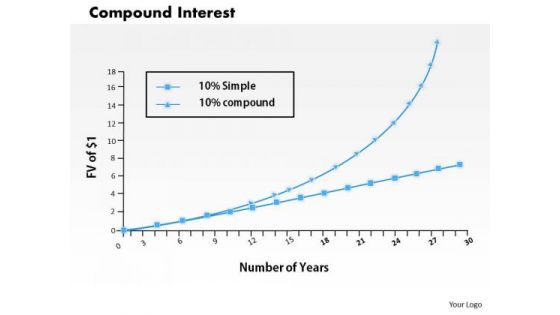
Business Framework Compound Interest PowerPoint Presentation
This business framework template displays compound interest graph. This image slide has been crafted to depict financial ratio analysis. Use this image slide, in your presentations to express views on business and marketing management. This image slide will enhance the quality of your presentations.
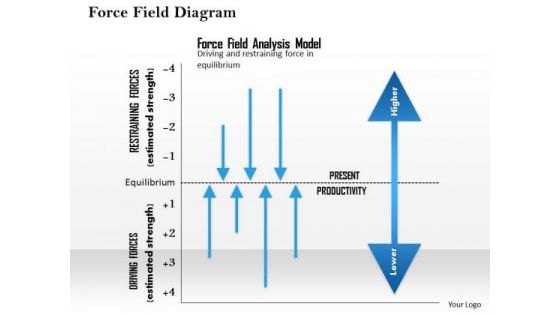
Business Framework Force Field Diagram PowerPoint Presentation
This image slide displays force field diagram business framework. This image has been designed with graphic of driving forces and restraining forces attributes graph. This image slide may be used in business and social presentations. Use this image to depict what's needed for change in both corporate and personal environments in your presentations. This image slide will enhance the quality of your presentations.

Business Diagram Lock With Missing Puzzle Piece Presentation Template
Business Diagram Icons For Good Marketing Strategy Presentation Template
This power point template has been designed with graphic of bar graph, suitcase and meeting business icons. These business icons are used to display the concept of business result analysis and meeting. Use this diagram for business related topics in any presentations.
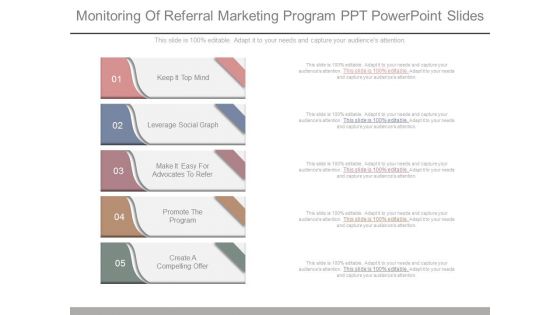
Monitoring Of Referral Marketing Program Ppt Powerpoint Slides
This is a monitoring of referral marketing program ppt powerpoint slides. This is a five stage process. The stages in this process are keep it top mind, leverage social graph, make it easy for advocates to refer, promote the program, create a compelling offer.
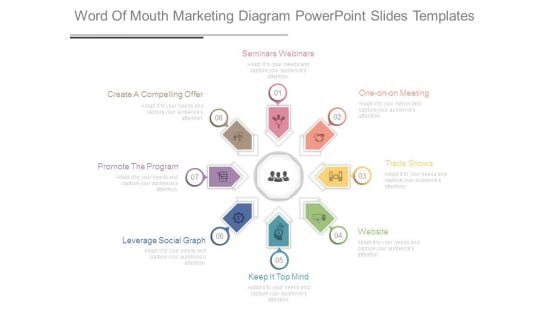
Word Of Mouth Marketing Diagram Powerpoint Slides Templates
This is a word of mouth marketing diagram powerpoint slides templates. This is a eight stage process. The stages in this process are create a compelling offer, promote the program, leverage social graph, keep it top mind, website, trade shows, one on one meeting, seminars webinars.
Bar Chart For Business Sales Analysis Ppt PowerPoint Presentation Styles Icon
Presenting this set of slides with name bar chart for business sales analysis ppt powerpoint presentation styles icon. The topics discussed in these slides are education, growth, pencil bar graph. This is a completely editable PowerPoint presentation and is available for immediate download. Download now and impress your audience.
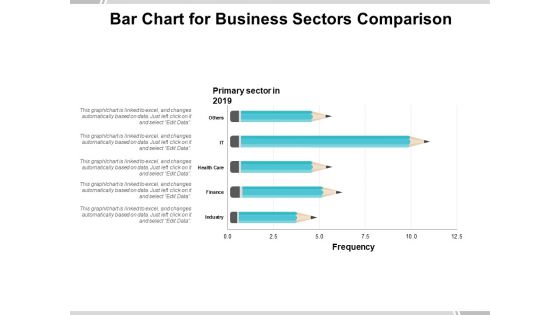
Bar Chart For Business Sectors Comparison Ppt PowerPoint Presentation Professional Guide
Presenting this set of slides with name bar chart for business sectors comparison ppt powerpoint presentation professional guide. The topics discussed in these slides are education, growth, pencil bar graph. This is a completely editable PowerPoint presentation and is available for immediate download. Download now and impress your audience.

Bar Chart For Facts Stats Growth And Percentage Analysis Ppt PowerPoint Presentation Styles Infographic Template
Presenting this set of slides with name bar chart for facts stats growth and percentage analysis ppt powerpoint presentation styles infographic template. This is a six stage process. The stages in this process are education, growth, pencil bar graph. This is a completely editable PowerPoint presentation and is available for immediate download. Download now and impress your audience.
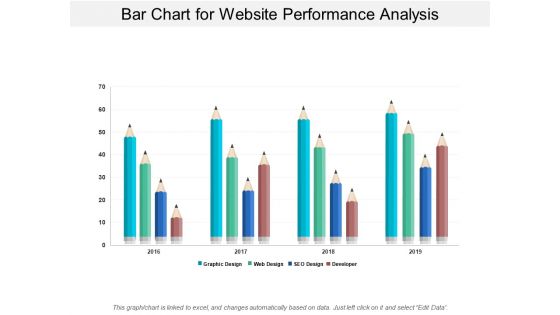
Bar Chart For Website Performance Analysis Ppt PowerPoint Presentation Layouts Influencers
Presenting this set of slides with name bar chart for website performance analysis ppt powerpoint presentation layouts influencers. The topics discussed in these slides are education, growth, pencil bar graph. This is a completely editable PowerPoint presentation and is available for immediate download. Download now and impress your audience.
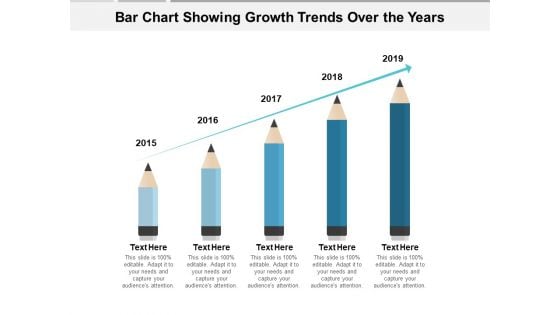
Bar Chart Showing Growth Trends Over The Years Ppt PowerPoint Presentation Slides Layout
Presenting this set of slides with name bar chart showing growth trends over the years ppt powerpoint presentation slides layout. This is a five stage process. The stages in this process are education, growth, pencil bar graph. This is a completely editable PowerPoint presentation and is available for immediate download. Download now and impress your audience.


 Continue with Email

 Home
Home


