Hierarchy Chart Organizational
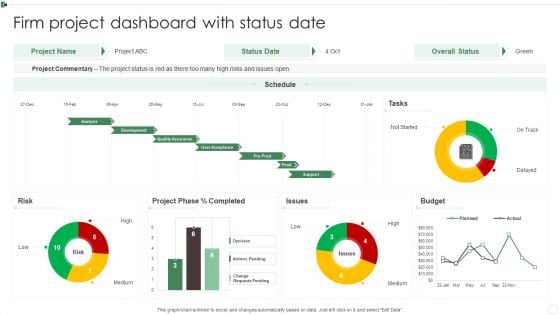
Firm Project Dashboard With Status Date Ppt Infographics Slides PDF
This graph or chart is linked to excel, and changes automatically based on data. Just left click on it and select Edit Data. Pitch your topic with ease and precision using this Firm Project Dashboard With Status Date Ppt Infographics Slides PDF. This layout presents information on Project Commentary, Budget, Project Phase, Risk. It is also available for immediate download and adjustment. So, changes can be made in the color, design, graphics or any other component to create a unique layout.
Expenses And Income Comparison Graph With Budget Summary Ppt PowerPoint Presentation Icon Inspiration PDF
This slide illustrates budget summary of expenditure of a company. it includes income and expenditure comparative data and expenditure chart etc.Pitch your topic with ease and precision using this Expenses And Income Comparison Graph With Budget Summary Ppt PowerPoint Presentation Icon Inspiration PDF. This layout presents information on Budget Summary, Expenditure Comparative, Actual Income. It is also available for immediate download and adjustment. So, changes can be made in the color, design, graphics or any other component to create a unique layout.
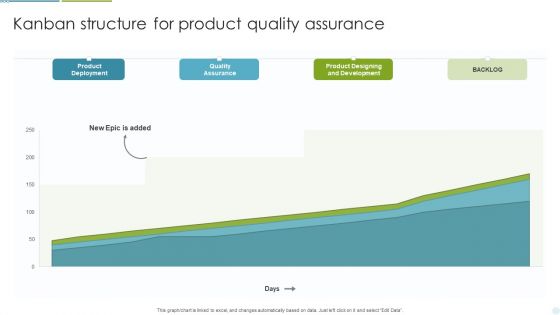
Kanban Structure For Product Quality Assurance Ppt Portfolio Deck PDF
This graph or chart is linked to excel, and changes automatically based on data. Just left click on it and select Edit Data. Pitch your topic with ease and precision using this Kanban Structure For Product Quality Assurance Ppt Portfolio Deck PDF. This layout presents information on Product Deployment, Quality Assurance, Product, Designing And Development. It is also available for immediate download and adjustment. So, changes can be made in the color, design, graphics or any other component to create a unique layout.
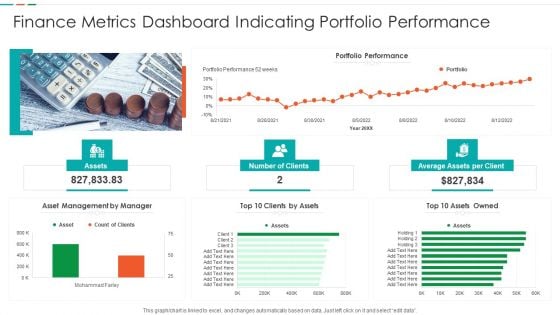
Finance Metrics Dashboard Indicating Portfolio Performance Microsoft PDF
This graph or chart is linked to excel, and changes automatically based on data. Just left click on it and select edit data. Pitch your topic with ease and precision using this Finance Metrics Dashboard Indicating Portfolio Performance Microsoft PDF. This layout presents information on Portfolio Performance Portfolio, Asset Management Manager, Top 10 Assets. It is also available for immediate download and adjustment. So, changes can be made in the color, design, graphics or any other component to create a unique layout.
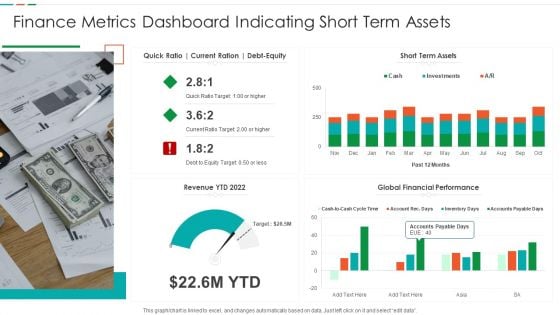
Finance Metrics Dashboard Indicating Short Term Assets Download PDF
This graph or chart is linked to excel, and changes automatically based on data. Just left click on it and select edit data. Pitch your topic with ease and precision using this Finance Metrics Dashboard Indicating Short Term Assets Download PDF. This layout presents information on Short Term Assets, Global Financial Performance, Revenue YTD 2022. It is also available for immediate download and adjustment. So, changes can be made in the color, design, graphics or any other component to create a unique layout.
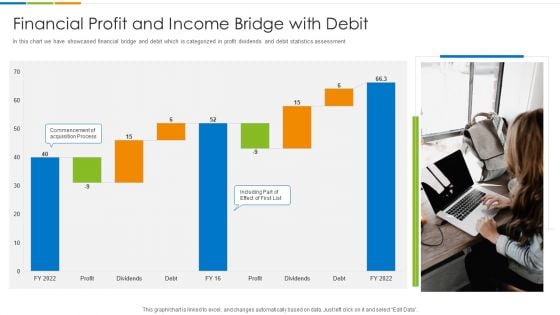
Financial Profit And Income Bridge With Debit Ppt PowerPoint Presentation File Outline PDF
In this chart we have showcased financial bridge and debit which is categorized in profit dividends and debit statistics assessment. Pitch your topic with ease and precision using this Financial Profit And Income Bridge With Debit Ppt PowerPoint Presentation File Outline PDF. This layout presents information on Profit Dividends, Debt Commencement, Acquisition Process. It is also available for immediate download and adjustment. So, changes can be made in the color, design, graphics or any other component to create a unique layout.
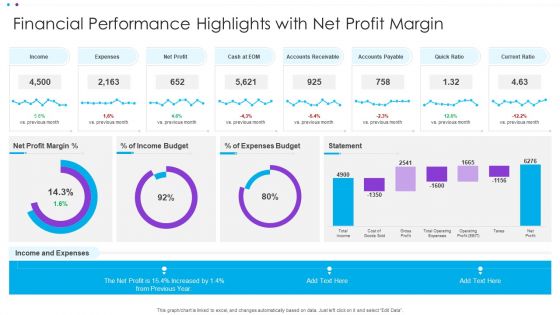
Financial Performance Highlights With Net Profit Margin Ppt Model Ideas PDF
This graph or chart is linked to excel, and changes automatically based on data. Just left click on it and select Edit Data. Pitch your topic with ease and precision using this Financial Performance Highlights With Net Profit Margin Ppt Model Ideas PDF. This layout presents information on Net Profit, Accounts Receivable, Accounts Payable. It is also available for immediate download and adjustment. So, changes can be made in the color, design, graphics or any other component to create a unique layout.
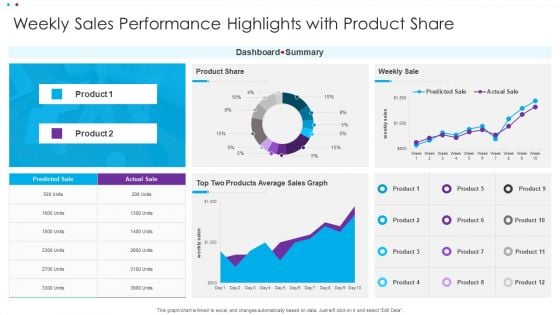
Weekly Sales Performance Highlights With Product Share Ppt File Information PDF
This graph or chart is linked to excel, and changes automatically based on data. Just left click on it and select Edit Data. Pitch your topic with ease and precision using this Weekly Sales Performance Highlights With Product Share Ppt File Information PDF. This layout presents information on Dashboard Summary, Weekly Sale, Product Share. It is also available for immediate download and adjustment. So, changes can be made in the color, design, graphics or any other component to create a unique layout.
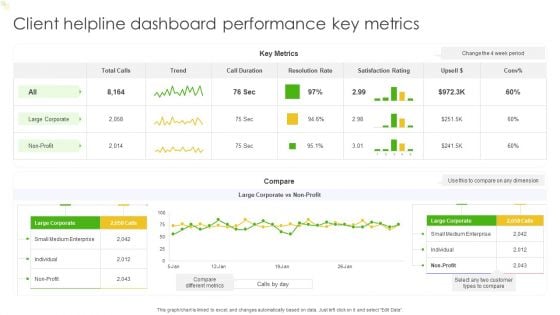
Client Helpline Dashboard Performance Key Metrics Ppt Outline Deck PDF
This graph or chart is linked to excel, and changes automatically based on data. Just left click on it and select Edit Data. Pitch your topic with ease and precision using this Client Helpline Dashboard Performance Key Metrics Ppt Outline Deck PDF. This layout presents information on Key Metrics, Trend, Compare. It is also available for immediate download and adjustment. So, changes can be made in the color, design, graphics or any other component to create a unique layout.
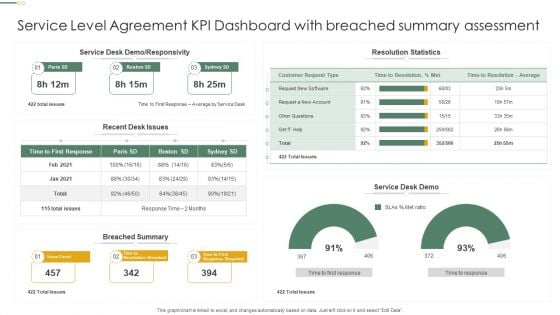
Service Level Agreement KPI Dashboard With Breached Summary Assessment Professional PDF
This graph or chart is linked to excel, and changes automatically based on data. Just left click on it and select Edit Data. Pitch your topic with ease and precision using this Service Level Agreement KPI Dashboard With Breached Summary Assessment Professional PDF. This layout presents information on Resolution Statistics, Service Desk Demo, Breached Summary. It is also available for immediate download and adjustment. So, changes can be made in the color, design, graphics or any other component to create a unique layout.
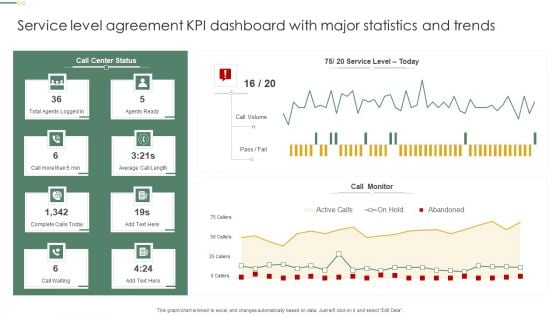
Service Level Agreement KPI Dashboard With Major Statistics And Trends Pictures PDF
This graph or chart is linked to excel, and changes automatically based on data. Just left click on it and select Edit Data. Pitch your topic with ease and precision using this Service Level Agreement KPI Dashboard With Major Statistics And Trends Pictures PDF. This layout presents information on Call Monitor, Call Volume, Agents Ready. It is also available for immediate download and adjustment. So, changes can be made in the color, design, graphics or any other component to create a unique layout.
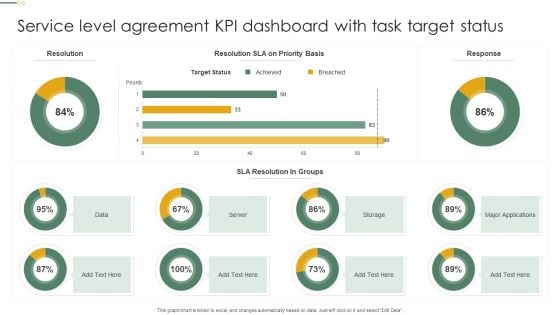
Service Level Agreement KPI Dashboard With Task Target Status Microsoft PDF
This graph or chart is linked to excel, and changes automatically based on data. Just left click on it and select Edit Data. Pitch your topic with ease and precision using this Service Level Agreement KPI Dashboard With Task Target Status Microsoft PDF. This layout presents information on Target Status, Sla Resolution, Groups, Server. It is also available for immediate download and adjustment. So, changes can be made in the color, design, graphics or any other component to create a unique layout.
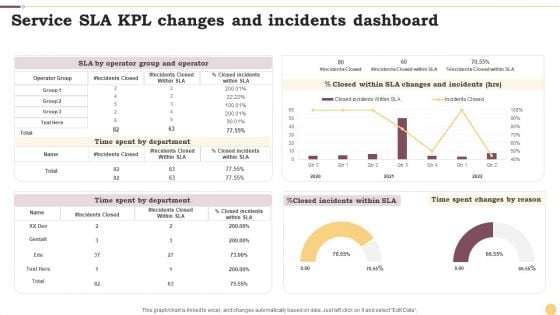
Service SLA KPL Changes And Incidents Dashboard Ppt Inspiration Infographics PDF
This graph or chart is linked to excel, and changes automatically based on data. Just left click on it and select Edit Data. Pitch your topic with ease and precision using this Service SLA KPL Changes And Incidents Dashboard Ppt Inspiration Infographics PDF. This layout presents information on Time Spent Department, Incidents Closed, Operator Group. It is also available for immediate download and adjustment. So, changes can be made in the color, design, graphics or any other component to create a unique layout.
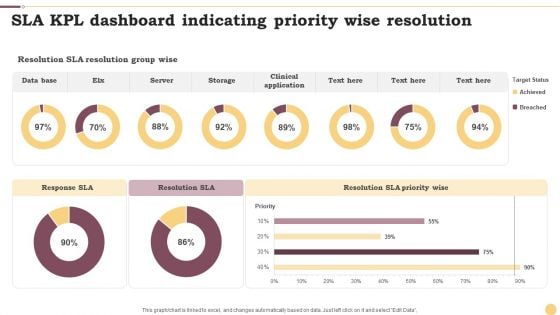
SLA KPL Dashboard Indicating Priority Wise Resolution Ppt Infographics Example File PDF
This graph or chart is linked to excel, and changes automatically based on data. Just left click on it and select Edit Data. Pitch your topic with ease and precision using this SLA KPL Dashboard Indicating Priority Wise Resolution Ppt Infographics Example File PDF. This layout presents information on Data Base, Server, Storage. It is also available for immediate download and adjustment. So, changes can be made in the color, design, graphics or any other component to create a unique layout.
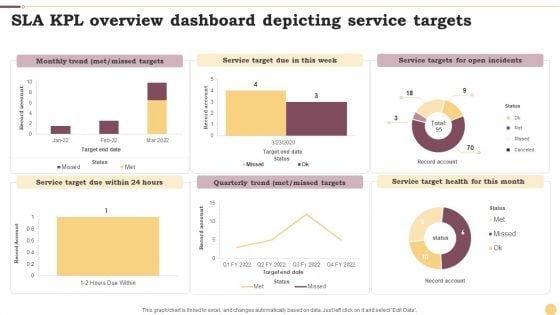
SLA KPL Overview Dashboard Depicting Service Targets Ppt Slides Maker PDF
This graph or chart is linked to excel, and changes automatically based on data. Just left click on it and select Edit Data. Pitch your topic with ease and precision using this SLA KPL Overview Dashboard Depicting Service Targets Ppt Slides Maker PDF. This layout presents information on Monthly Trend, Service Target, Quarterly Trend. It is also available for immediate download and adjustment. So, changes can be made in the color, design, graphics or any other component to create a unique layout.
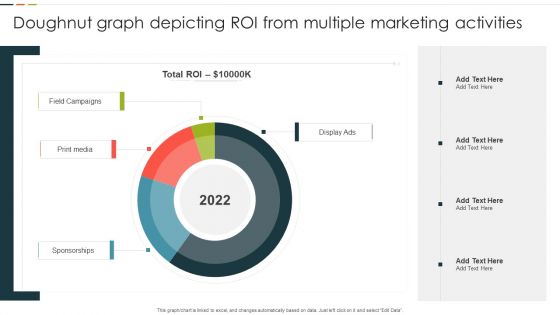
Doughnut Graph Depicting ROI From Multiple Marketing Activities Rules PDF
This graph or chart is linked to excel, and changes automatically based on data. Just left click on it and select Edit Data. Pitch your topic with ease and precision using this Doughnut Graph Depicting ROI From Multiple Marketing Activities Rules PDF. This layout presents information on Total ROI, Field Campaigns, Print Media, Display Ads. It is also available for immediate download and adjustment. So, changes can be made in the color, design, graphics or any other component to create a unique layout.
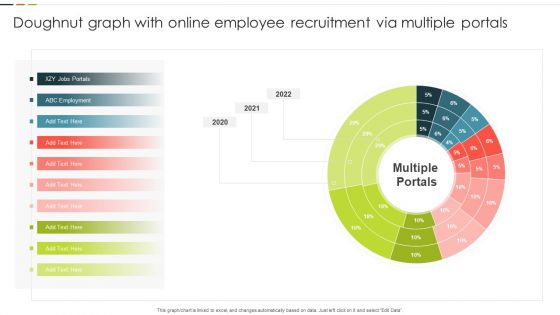
Doughnut Graph With Online Employee Recruitment Via Multiple Portals Mockup PDF
This graph or chart is linked to excel, and changes automatically based on data. Just left click on it and select Edit Data. Pitch your topic with ease and precision using this Doughnut Graph With Online Employee Recruitment Via Multiple Portals Mockup PDF. This layout presents information on ABC Employment, Multiple Portals, 2020 To 2022. It is also available for immediate download and adjustment. So, changes can be made in the color, design, graphics or any other component to create a unique layout.
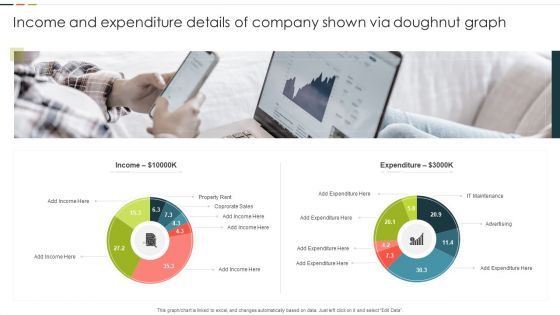
Income And Expenditure Details Of Company Shown Via Doughnut Graph Graphics PDF
This graph or chart is linked to excel, and changes automatically based on data. Just left click on it and select Edit Data. Pitch your topic with ease and precision using this Income And Expenditure Details Of Company Shown Via Doughnut Graph Graphics PDF. This layout presents information on Property Rent, Corporate Sales, Expenditure. It is also available for immediate download and adjustment. So, changes can be made in the color, design, graphics or any other component to create a unique layout.
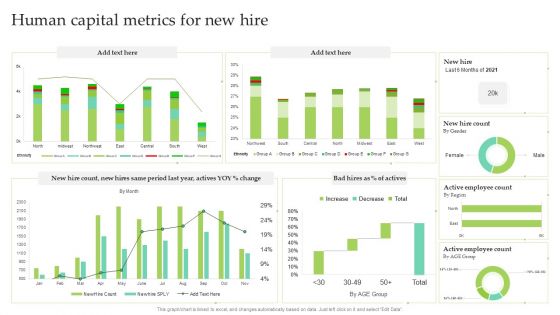
Human Capital Metrics For New Hire Ppt Pictures Brochure PDF
This graph or chart is linked to excel, and changes automatically based on data. Just left click on it and select Edit Data. Pitch your topic with ease and precision using this Human Capital Metrics For New Hire Ppt Pictures Brochure PDF. This layout presents information on Active Employee Count, New Hire Count, New Hire. It is also available for immediate download and adjustment. So, changes can be made in the color, design, graphics or any other component to create a unique layout.
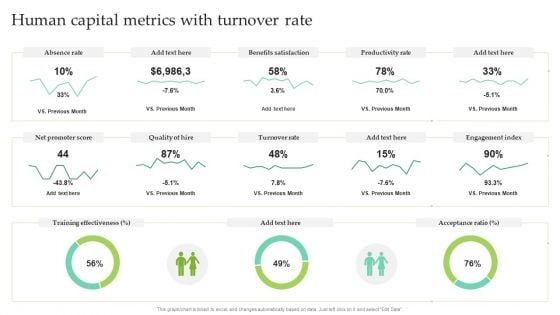
Human Capital Metrics With Turnover Rate Ppt Pictures Outline PDF
This graph or chart is linked to excel, and changes automatically based on data. Just left click on it and select Edit Data. Pitch your topic with ease and precision using this Human Capital Metrics With Turnover Rate Ppt Pictures Outline PDF. This layout presents information on Absence Rate, Benefits Satisfaction, Productivity Rate. It is also available for immediate download and adjustment. So, changes can be made in the color, design, graphics or any other component to create a unique layout.
Staff Tracking Time Tracking Software For Small Business Organization Structure Pdf
Following slide shows time tracking software for employee of small business which assist in evaluating their performance. It includes various software such a paymo, harvest, bee bole, etc. Showcasing this set of slides titled Staff Tracking Time Tracking Software For Small Business Organization Structure Pdf The topics addressed in these templates are Software, Staff Tracking, Business Organization All the content presented in this PPT design is completely editable. Download it and make adjustments in color, background, font etc. as per your unique business setting. Following slide shows time tracking software for employee of small business which assist in evaluating their performance. It includes various software such a paymo, harvest, bee bole, etc.
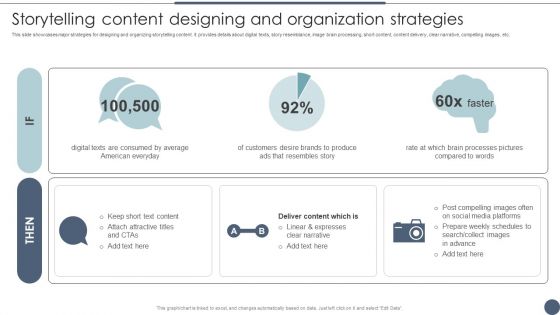
Storytelling Content Designing And Organization Strategies Utilizing Emotional And Rational Branding For Improved Designs PDF
This slide showcases major strategies for designing and organizing storytelling content. It provides details about digital texts, story resemblance, image brain processing, short content, content delivery, clear narrative, compelling images, etc. Slidegeeks is one of the best resources for PowerPoint templates. You can download easily and regulate Storytelling Content Designing And Organization Strategies Utilizing Emotional And Rational Branding For Improved Designs PDF for your personal presentations from our wonderful collection. A few clicks is all it takes to discover and get the most relevant and appropriate templates. Use our Templates to add a unique zing and appeal to your presentation and meetings. All the slides are easy to edit and you can use them even for advertisement purposes.
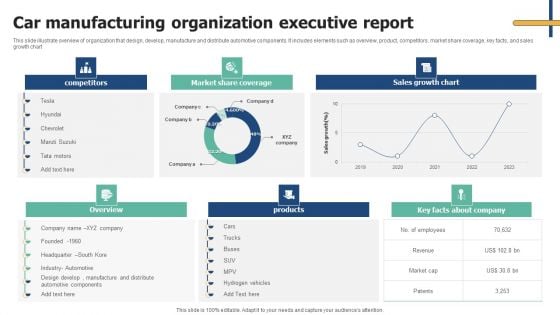
Car Manufacturing Organization Executive Report Background PDF
This slide illustrate overview of organization that design, develop, manufacture and distribute automotive components. It includes elements such as overview, product, competitors, market share coverage, key facts, and sales growth chart. Pitch your topic with ease and precision using this Car Manufacturing Organization Executive Report Background PDF. This layout presents information on Competitors, Market Share Coverage, Sales Growth Chart. It is also available for immediate download and adjustment. So, changes can be made in the color, design, graphics or any other component to create a unique layout.
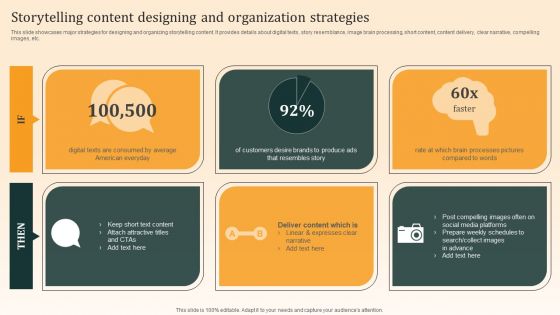
Nike Emotional Branding Strategy Storytelling Content Designing And Organization Strategies Introduction PDF
This slide showcases major strategies for designing and organizing storytelling content. It provides details about digital texts, story resemblance, image brain processing, short content, content delivery, clear narrative, compelling images, etc. Find a pre designed and impeccable Nike Emotional Branding Strategy Storytelling Content Designing And Organization Strategies Introduction PDF. The templates can ace your presentation without additional effort. You can download these easy to edit presentation templates to make your presentation stand out from others. So, what are you waiting for Download the template from Slidegeeks today and give a unique touch to your presentation.
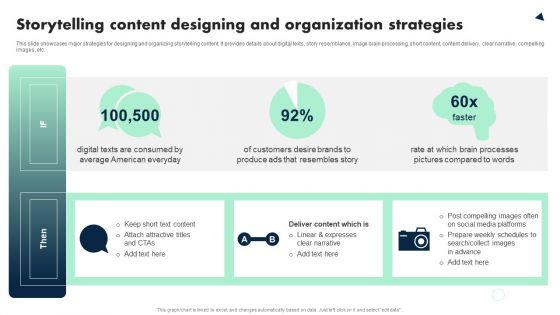
Apple Emotional Marketing Strategy Storytelling Content Designing And Organization Strategies Background PDF
This slide showcases major strategies for designing and organizing storytelling content. It provides details about digital texts, story resemblance, image brain processing, short content, content delivery, clear narrative, compelling images, etc. Slidegeeks is here to make your presentations a breeze with Apple Emotional Marketing Strategy Storytelling Content Designing And Organization Strategies Background PDF With our easy to use and customizable templates, you can focus on delivering your ideas rather than worrying about formatting. With a variety of designs to choose from, you are sure to find one that suits your needs. And with animations and unique photos, illustrations, and fonts, you can make your presentation pop. So whether you are giving a sales pitch or presenting to the board, make sure to check out Slidegeeks first.
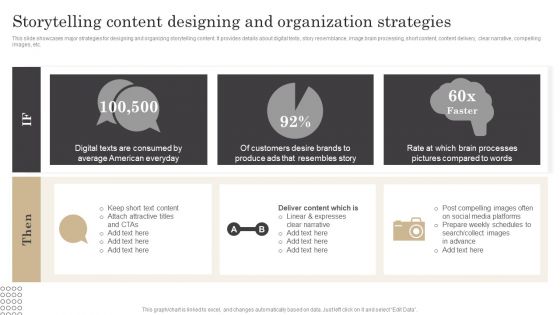
Storytelling Content Designing And Organization Strategies Ppt File Graphic Tips PDF
This slide showcases major strategies for designing and organizing storytelling content. It provides details about digital texts, story resemblance, image brain processing, short content, content delivery, clear narrative, compelling images, etc. Slidegeeks has constructed Storytelling Content Designing And Organization Strategies Ppt File Graphic Tips PDF after conducting extensive research and examination. These presentation templates are constantly being generated and modified based on user preferences and critiques from editors. Here, you will find the most attractive templates for a range of purposes while taking into account ratings and remarks from users regarding the content. This is an excellent jumping off point to explore our content and will give new users an insight into our top notch PowerPoint Templates.
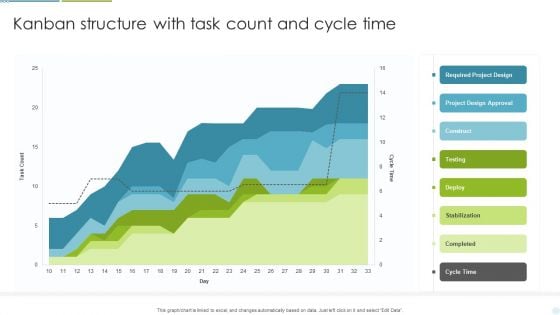
Kanban Structure With Task Count And Cycle Time Ppt Layouts Background Designs PDF
This graph or chart is linked to excel, and changes automatically based on data. Just left click on it and select Edit Data. Pitch your topic with ease and precision using this Kanban Structure With Task Count And Cycle Time Ppt Layouts Background Designs PDF. This layout presents information on Required Project Design, Project Design Approval, Construct. It is also available for immediate download and adjustment. So, changes can be made in the color, design, graphics or any other component to create a unique layout.
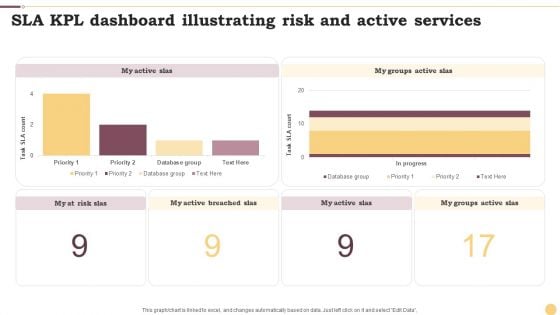
SLA KPL Dashboard Illustrating Risk And Active Services Ppt Portfolio Design Inspiration PDF
This graph or chart is linked to excel, and changes automatically based on data. Just left click on it and select Edit Data. Pitch your topic with ease and precision using this SLA KPL Dashboard Illustrating Risk And Active Services Ppt Portfolio Design Inspiration PDF. This layout presents information on My Active SLAs, Database Group, Priority. It is also available for immediate download and adjustment. So, changes can be made in the color, design, graphics or any other component to create a unique layout.
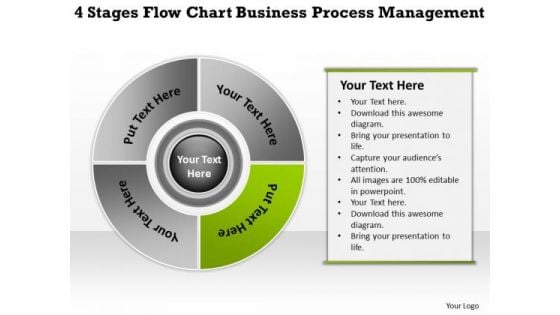
Templates Free Download Process Management Best Business Plan Software PowerPoint
We present our templates free download process management best business plan software PowerPoint.Download our Circle Charts PowerPoint Templates because These PowerPoint Templates and Slides will give the updraft to your ideas. See them soar to great heights with ease. Download and present our Process and Flows PowerPoint Templates because Our PowerPoint Templates and Slides are effectively colour coded to prioritise your plans They automatically highlight the sequence of events you desire. Use our Flow Charts PowerPoint Templates because You can Channelise the thoughts of your team with our PowerPoint Templates and Slides. Urge them to focus on the goals you have set. Use our Marketing PowerPoint Templates because Our PowerPoint Templates and Slides help you pinpoint your timelines. Highlight the reasons for your deadlines with their use. Download and present our Success PowerPoint Templates because Our PowerPoint Templates and Slides are effectively colour coded to prioritise your plans They automatically highlight the sequence of events you desire.Use these PowerPoint slides for presentations relating to Chart, concept, diagram, process, strength, tactics, opportunity, model, tool, business, plan, success, threat, representation, guide, analysis, theory, idea,abstract, management, mba, manage, illustration, weakness, strategy, project, clipart, guidelines, direction, design, organization, commerce, conceptual,heirarchy, resource, theoretical, action, goals, performance. The prominent colors used in the PowerPoint template are Green lime , White, Gray. Our Templates Free Download Process Management Best Business Plan Software PowerPoint offer many amenities. They facilitate any excercise you undertake.
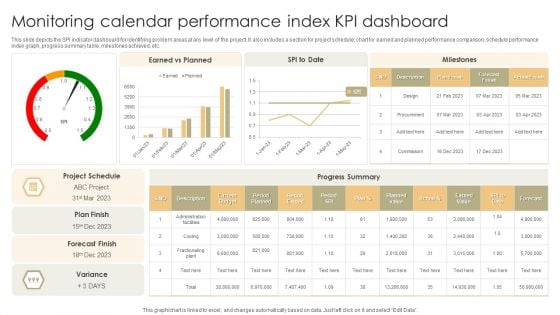
Monitoring Calendar Performance Index KPI Dashboard Slides PDF
This slide depicts the SPI indicator dashboard for identifying problem areas at any level of the project. It also includes a section for project schedule, chart for earned and planned performance comparison, schedule performance index graph, progress summary table, milestones achieved, etc. Pitch your topic with ease and precision using this Monitoring Calendar Performance Index KPI Dashboard Slides PDF. This layout presents information on Current Budget, Planned Value, Earned Value. It is also available for immediate download and adjustment. So, changes can be made in the color, design, graphics or any other component to create a unique layout.
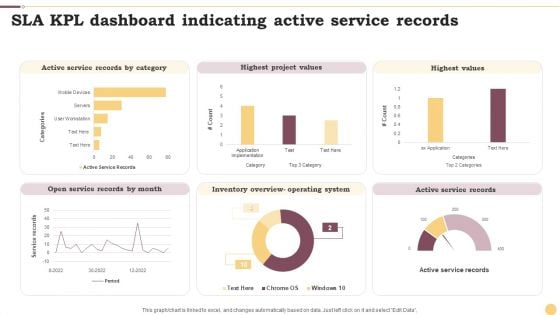
SLA KPL Dashboard Indicating Active Service Records Ppt Professional Graphics Example PDF
This graph or chart is linked to excel, and changes automatically based on data. Just left click on it and select Edit Data. Pitch your topic with ease and precision using this SLA KPL Dashboard Indicating Active Service Records Ppt Professional Graphics Example PDF. This layout presents information on Active Service Records, Highest Project Values, Highest Values. It is also available for immediate download and adjustment. So, changes can be made in the color, design, graphics or any other component to create a unique layout.
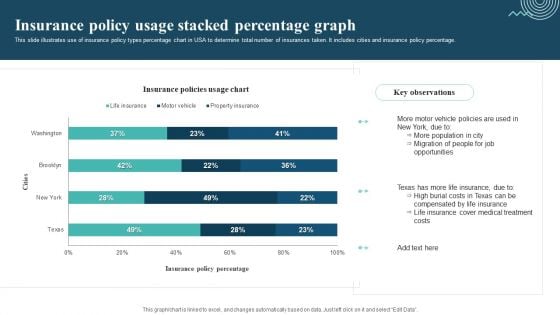
Insurance Policy Usage Stacked Percentage Graph Template PDF
This slide illustrates use of insurance policy types percentage chart in USA to determine total number of insurances taken. It includes cities and insurance policy percentage. Pitch your topic with ease and precision using this Insurance Policy Usage Stacked Percentage Graph Template PDF. This layout presents information on Motor Vehicle Policies, More Population, Migration Of People. It is also available for immediate download and adjustment. So, changes can be made in the color, design, graphics or any other component to create a unique layout.

Firm KPI Dashboard With Schedule Performance Index Ppt Visual Aids PDF
This graph or chart is linked to excel, and changes automatically based on data. Just left click on it and select Edit Data. Pitch your topic with ease and precision using this Firm KPI Dashboard With Schedule Performance Index Ppt Visual Aids PDF. This layout presents information on Project Cost Performance, Project Planning Stage, Monitor And Control. It is also available for immediate download and adjustment. So, changes can be made in the color, design, graphics or any other component to create a unique layout.
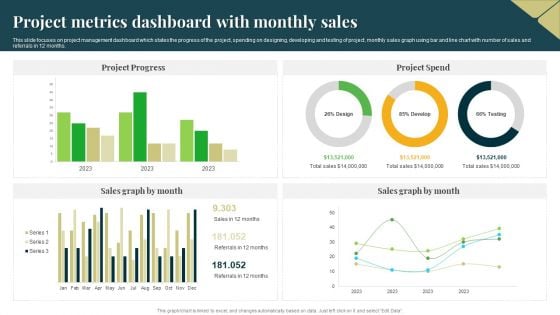
Project Metrics Dashboard With Monthly Sales Professional PDF
This slide focuses on project management dashboard which states the progress of the project, spending on designing, developing and testing of project, monthly sales graph using bar and line chart with number of sales and referrals in 12 months. Pitch your topic with ease and precision using this Project Metrics Dashboard With Monthly Sales Professional PDF. This layout presents information on Project Progress, Project Spend, Sales Graph. It is also available for immediate download and adjustment. So, changes can be made in the color, design, graphics or any other component to create a unique layout.
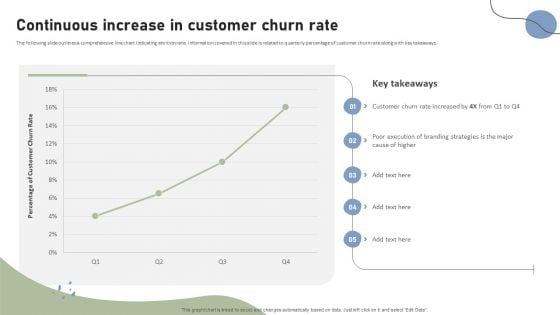
Brand Building Techniques Enhance Customer Engagement Loyalty Continuous Increase In Customer Graphics PDF
The following slide outlines a comprehensive line chart indicating attrition rate. Information covered in this slide is related to quarterly percentage of customer churn rate along with key takeaways. Create an editable Brand Building Techniques Enhance Customer Engagement Loyalty Continuous Increase In Customer Graphics PDF that communicates your idea and engages your audience. Whether you are presenting a business or an educational presentation, pre designed presentation templates help save time. Brand Building Techniques Enhance Customer Engagement Loyalty Continuous Increase In Customer Graphics PDF is highly customizable and very easy to edit, covering many different styles from creative to business presentations. Slidegeeks has creative team members who have crafted amazing templates. So, go and get them without any delay.
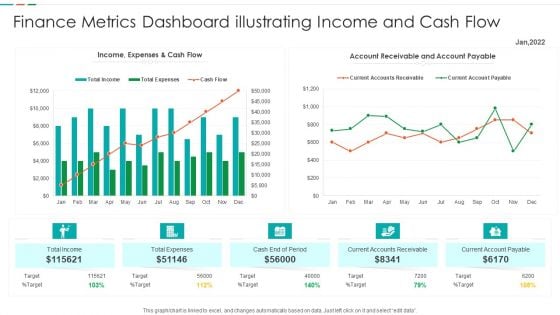
Finance Metrics Dashboard Illustrating Income And Cash Flow Template PDF
This graph or chart is linked to excel, and changes automatically based on data. Just left click on it and select edit data. Pitch your topic with ease and precision using this Finance Metrics Dashboard Illustrating Income And Cash Flow Template PDF. This layout presents information on Current Accounts Receivable, Current Account Payable, Cash End Period, Account Receivable Account. It is also available for immediate download and adjustment. So, changes can be made in the color, design, graphics or any other component to create a unique layout.
Project Error Tracking KPI Dashboard Themes PDF
This slide illustrates the dashboard for the project issue tracking and management. It includes the column chart for issues assignee, incomplete issues by priority and project, monthly percentage increase in issues created and closed, etc. Pitch your topic with ease and precision using this Project Error Tracking KPI Dashboard Themes PDF. This layout presents information on Issues Assignee, Issue Status, Incomplete Issues. It is also available for immediate download and adjustment. So, changes can be made in the color, design, graphics or any other component to create a unique layout.
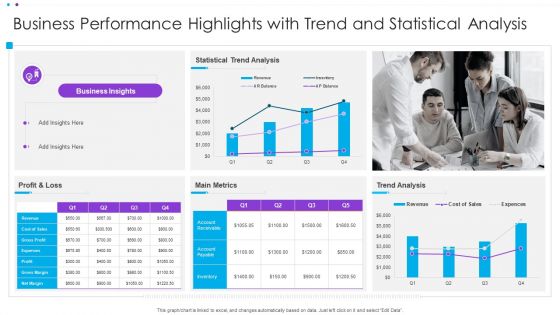
Business Performance Highlights With Trend And Statistical Analysis Ppt Infographic Template Display PDF
This graph or chart is linked to excel, and changes automatically based on data. Just left click on it and select Edit Data. Pitch your topic with ease and precision using this Business Performance Highlights With Trend And Statistical Analysis Ppt Infographic Template Display PDF. This layout presents information on Statistical Trend Analysis, Main Metrics, Profit And Loss. It is also available for immediate download and adjustment. So, changes can be made in the color, design, graphics or any other component to create a unique layout.
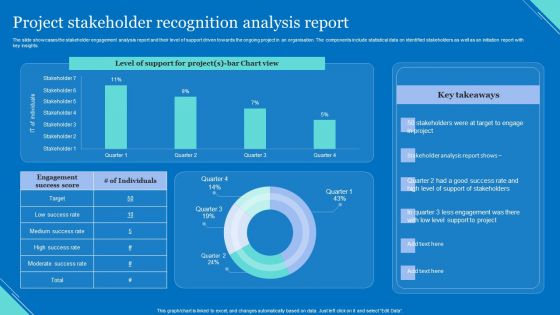
Project Stakeholder Recognition Analysis Report Elements PDF
The slide showcases the stakeholder engagement analysis report and their level of support driven towards the ongoing project in an organisation. The components include statistical data on identified stakeholders as well as an initiation report with key insights. Showcasing this set of slides titled Project Stakeholder Recognition Analysis Report Elements PDF. The topics addressed in these templates are Level Support, Chart View, Support Stakeholders. All the content presented in this PPT design is completely editable. Download it and make adjustments in color, background, font etc. as per your unique business setting.
Customer Service Request Tickets Administration Dashboard Icons PDF
This slide covers division of tickets into different groups. It also includes a pie chart dividing tickets in multiple categories such as status, tech groups, alert level, request type and alert condition. Pitch your topic with ease and precision using this Customer Service Request Tickets Administration Dashboard Icons PDF. This layout presents information on Tickets Activity, Tickets Alert Level, Tickets Teach Group. It is also available for immediate download and adjustment. So, changes can be made in the color, design, graphics or any other component to create a unique layout.
Finance Metrics Dashboard Illustrating Account Payables Icons PDF
This graph or chart is linked to excel, and changes automatically based on data. Just left click on it and select edit data. Pitch your topic with ease and precision using this Total Income Budget, Total Expenses Balance, Net Profit Quick, Ratio Current Ratio. This layout presents information on Account Payable Age, Average Creditor Days, Cash On Hand. It is also available for immediate download and adjustment. So, changes can be made in the color, design, graphics or any other component to create a unique layout.
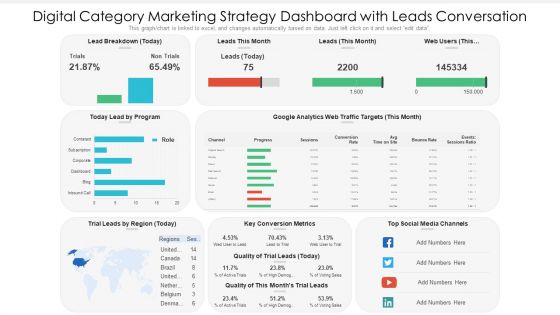
Digital Category Marketing Strategy Dashboard With Leads Conversation Ppt PowerPoint Presentation Slides Information PDF
This graph chart is linked to excel, and changes automatically based on data. Just left click on it and select edit data. Pitch your topic with ease and precision using this digital category marketing strategy dashboard with leads conversation ppt powerpoint presentation slides information pdf. This layout presents information on key conversion metrics, social media channels, lead by program. It is also available for immediate download and adjustment. So, changes can be made in the color, design, graphics or any other component to create a unique layout.
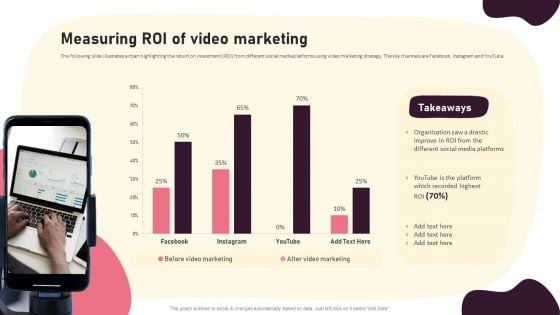
Video Promotion Techniques Measuring ROI Of Video Marketing Diagrams PDF
The following slide illustrates a chart highlighting the return on investment ROI from different social media platforms using video marketing strategy. The key channels are Facebook, Instagram and YouTube. Retrieve professionally designed Video Promotion Techniques Measuring ROI Of Video Marketing Diagrams PDF to effectively convey your message and captivate your listeners. Save time by selecting pre-made slideshows that are appropriate for various topics, from business to educational purposes. These themes come in many different styles, from creative to corporate, and all of them are easily adjustable and can be edited quickly. Access them as PowerPoint templates or as Google Slides themes. You dont have to go on a hunt for the perfect presentation because Slidegeeks got you covered from everywhere.
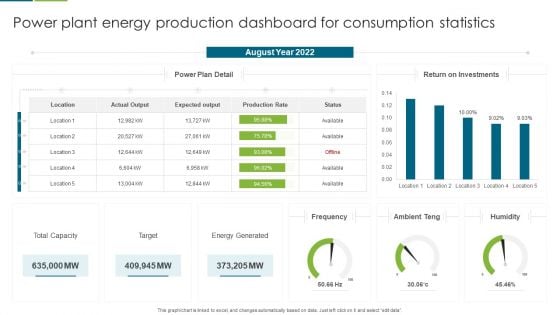
Power Plant Energy Production Dashboard For Consumption Statistics Download PDF
This graph or chart is linked to excel, and changes automatically based on data. Just left click on it and select edit data. Pitch your topic with ease and precision using this Multiple Country Energy Consumption Statistics Comparison Dashboard Formats PDF. This layout presents information on August Year 2022, Return on Investments, Power Plan Detail . It is also available for immediate download and adjustment. So, changes can be made in the color, design, graphics or any other component to create a unique layout.
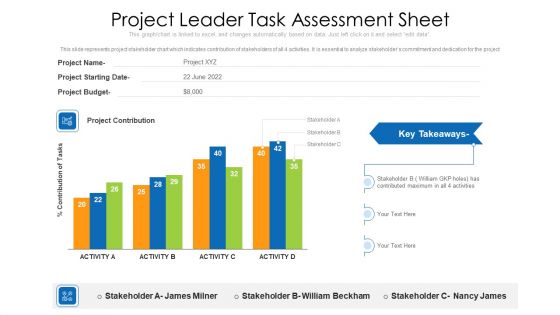
Project Leader Task Assessment Sheet Ppt PowerPoint Presentation Gallery Outline PDF
This slide represents project stakeholder chart which indicates contribution of stakeholders of all 4 activities. It is essential to analyze stakeholders commitment and dedication for the project. Pitch your topic with ease and precision using this project leader task assessment sheet ppt powerpoint presentation gallery outline pdf. This layout presents information on project leader task assessment sheet. It is also available for immediate download and adjustment. So, changes can be made in the color, design, graphics or any other component to create a unique layout.
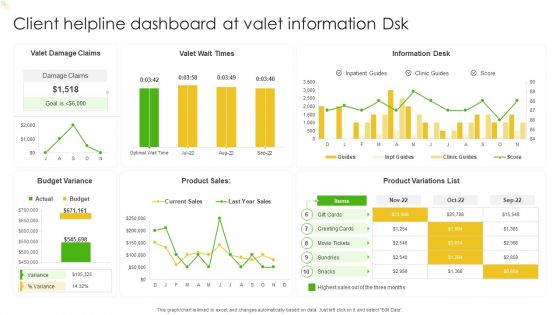
Client Helpline Dashboard At Valet Information Dsk Ppt Gallery Slide Portrait PDF
This graph or chart is linked to excel, and changes automatically based on data. Just left click on it and select Edit Data. Pitch your topic with ease and precision using this Client Helpline Dashboard At Valet Information Dsk Ppt Gallery Slide Portrait PDF. This layout presents information on Valet Damage Claims, Valet Wait Times, Information Desk. It is also available for immediate download and adjustment. So, changes can be made in the color, design, graphics or any other component to create a unique layout.
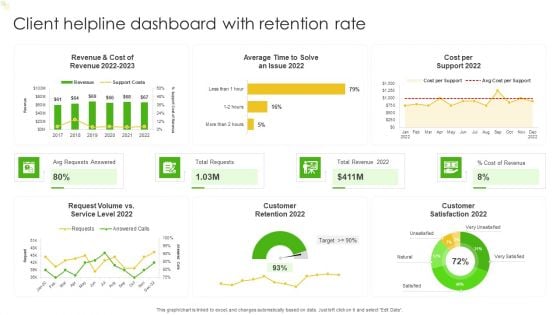
Client Helpline Dashboard With Retention Rate Ppt Gallery Ideas PDF
This graph or chart is linked to excel, and changes automatically based on data. Just left click on it and select Edit Data. Pitch your topic with ease and precision using this Client Helpline Dashboard With Retention Rate Ppt Gallery Ideas PDF. This layout presents information on Cost per Support 2022, Total Requests, Total Revenue 2022, Avg Requests Answered. It is also available for immediate download and adjustment. So, changes can be made in the color, design, graphics or any other component to create a unique layout.
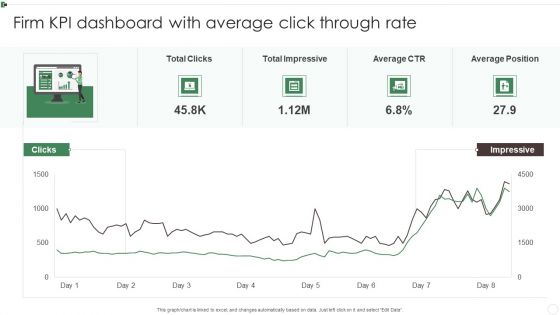
Firm KPI Dashboard With Average Click Through Rate Ppt Inspiration Sample PDF
This graph or chart is linked to excel, and changes automatically based on data. Just left click on it and select Edit Data. Pitch your topic with ease and precision using this Firm KPI Dashboard With Average Click Through Rate Ppt Inspiration Sample PDF. This layout presents information on Total Clicks, Total Impressive, Average CTR, Average Position. It is also available for immediate download and adjustment. So, changes can be made in the color, design, graphics or any other component to create a unique layout.
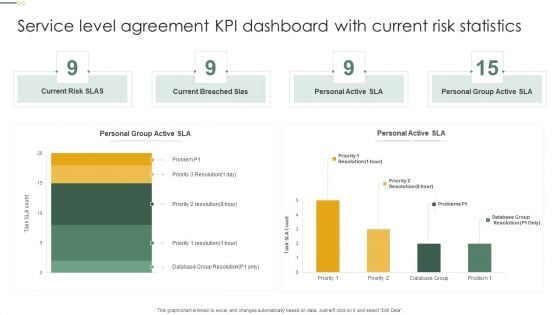
Service Level Agreement KPI Dashboard With Current Risk Statistics Topics PDF
This graph or chart is linked to excel, and changes automatically based on data. Just left click on it and select Edit Data. Pitch your topic with ease and precision using this Service Level Agreement KPI Dashboard With Current Risk Statistics Topics PDF. This layout presents information on Current Risk SLAS, Current Breached Slas, Personal Active SLA It is also available for immediate download and adjustment. So, changes can be made in the color, design, graphics or any other component to create a unique layout.
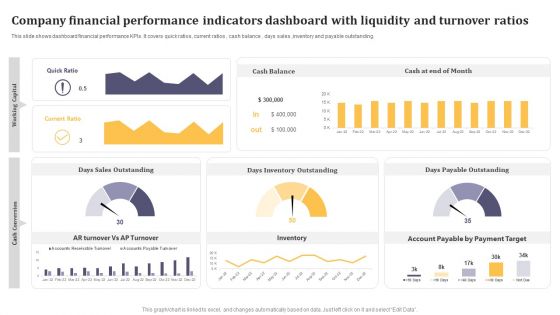
Company Financial Performance Indicators Dashboard With Liquidity And Turnover Ratios Formats PDF
This graph or chart is linked to excel, and changes automatically based on data. Just left click on it and select Edit Data. Pitch your topic with ease and precision using this Company Financial Performance Indicators Dashboard With Liquidity And Turnover Ratios Formats PDF. This layout presents information on Cash Balance, Days Inventory Outstanding, Days Payable Outstanding. It is also available for immediate download and adjustment. So, changes can be made in the color, design, graphics or any other component to create a unique layout.
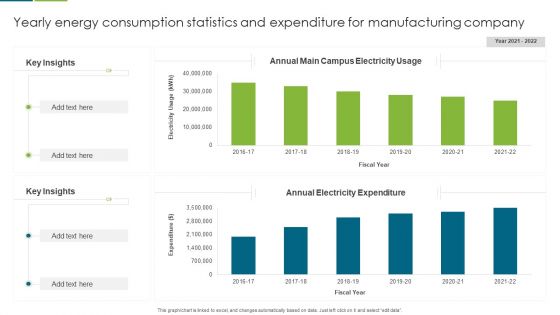
Yearly Energy Consumption Statistics And Expenditure For Manufacturing Company Guidelines PDF
This graph or chart is linked to excel, and changes automatically based on data. Just left click on it and select edit data. Pitch your topic with ease and precision using this Yearly Energy Consumption Statistics And Expenditure For Manufacturing Company Guidelines PDF. This layout presents information on Key Insights, Annual Electricity Expenditure, Annual Main Campus, Electricity Usage. It is also available for immediate download and adjustment. So, changes can be made in the color, design, graphics or any other component to create a unique layout.
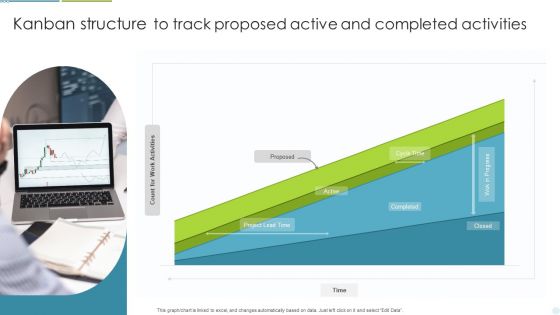
Kanban Structure To Track Proposed Active And Completed Activities Ppt Outline Slide Portrait PDF
This graph or chart is linked to excel, and changes automatically based on data. Just left click on it and select Edit Data. Pitch your topic with ease and precision using this Kanban Structure To Track Proposed Active And Completed Activities Ppt Outline Slide Portrait PDF. This layout presents information on Project Lead Time, Cycle Time, Completed. It is also available for immediate download and adjustment. So, changes can be made in the color, design, graphics or any other component to create a unique layout.
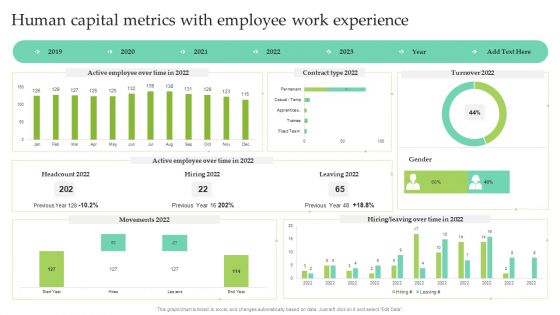
Human Capital Metrics With Employee Work Experience Ppt Show Images PDF
This graph or chart is linked to excel, and changes automatically based on data. Just left click on it and select Edit Data. Pitch your topic with ease and precision using this Human Capital Metrics With Employee Work Experience Ppt Show Images PDF. This layout presents information on Active Employee, Over Time, Contract Type 2022, Leaving 2022. It is also available for immediate download and adjustment. So, changes can be made in the color, design, graphics or any other component to create a unique layout.
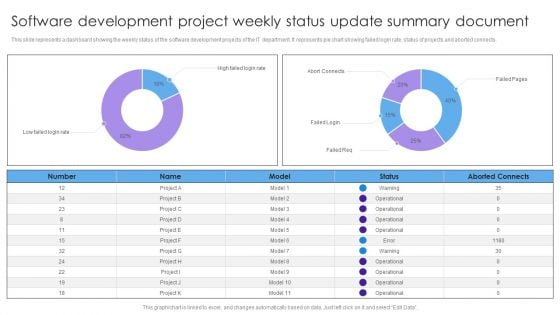
Software Development Project Weekly Status Update Summary Document Inspiration PDF
This slide represents a dashboard showing the weekly status of the software development projects of the IT department. It represents pie chart showing failed login rate, status of projects and aborted connects. Pitch your topic with ease and precision using this Software Development Project Weekly Status Update Summary Document Inspiration PDF. This layout presents information on High Failed, Login Rate, Abort Connects, Failed Login. It is also available for immediate download and adjustment. So, changes can be made in the color, design, graphics or any other component to create a unique layout.
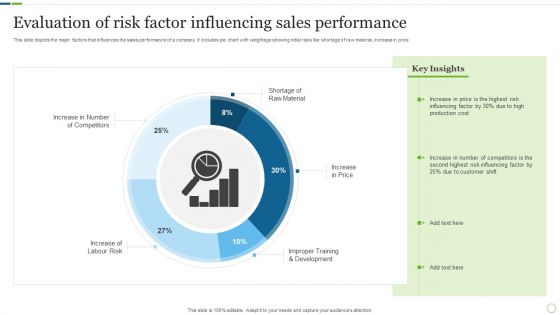
Evaluation Of Risk Factor Influencing Sales Performance Inspiration PDF
This slide depicts the major factors that influences the sales performance of a company. It includes pie chart with weightage showing initial risks like shortage of raw material, increase in price. Pitch your topic with ease and precision using this Evaluation Of Risk Factor Influencing Sales Performance Inspiration PDF. This layout presents information on Production Cost, Customer Shift, Risk Influencing. It is also available for immediate download and adjustment. So, changes can be made in the color, design, graphics or any other component to create a unique layout.
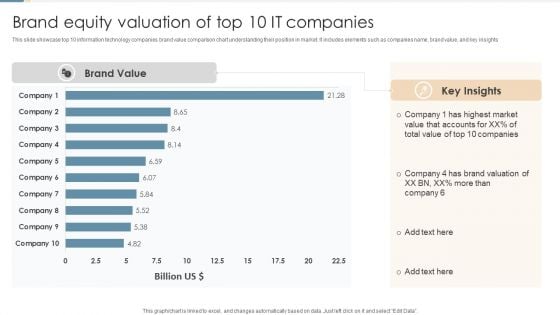
Brand Equity Valuation Of Top 10 IT Companies Ppt Portfolio Rules PDF
This slide showcase top 10 information technology companies brand value comparison chart understanding their position in market. It includes elements such as companies name, brand value, and key insights. Pitch your topic with ease and precision using this Brand Equity Valuation Of Top 10 IT Companies Ppt Portfolio Rules PDF. This layout presents information on Highest Market Value, Total Value, Brand Valuation. It is also available for immediate download and adjustment. So, changes can be made in the color, design, graphics or any other component to create a unique layout.
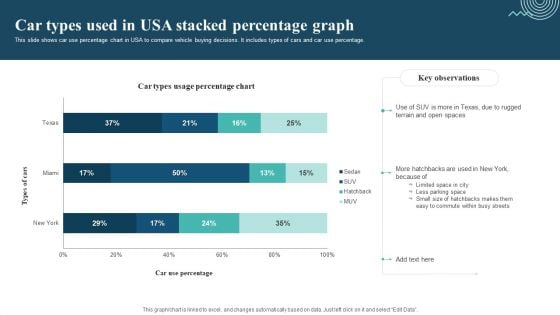
Car Types Used In Usa Stacked Percentage Graph Sample PDF
This slide shows car use percentage chart in USA to compare vehicle buying decisions. It includes types of cars and car use percentage. Pitch your topic with ease and precision using this Car Types Used In Usa Stacked Percentage Graph Sample PDF. This layout presents information on Limited Space In City, Less Parking Space, Easy To Commute. It is also available for immediate download and adjustment. So, changes can be made in the color, design, graphics or any other component to create a unique layout.
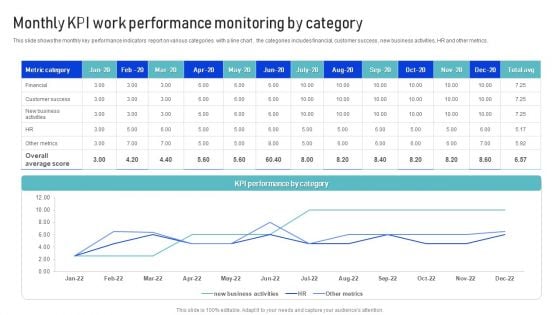
Monthly KPI Work Performance Monitoring By Category Microsoft PDF
This slide shows the monthly key performance indicators report on various categories with a line chart . the categories includes financial, customer success , new business activities, HR and other metrics. Pitch your topic with ease and precision using this Monthly KPI Work Performance Monitoring By Category Microsoft PDF. This layout presents information on Metrics, Financial, Customer Success. It is also available for immediate download and adjustment. So, changes can be made in the color, design, graphics or any other component to create a unique layout.
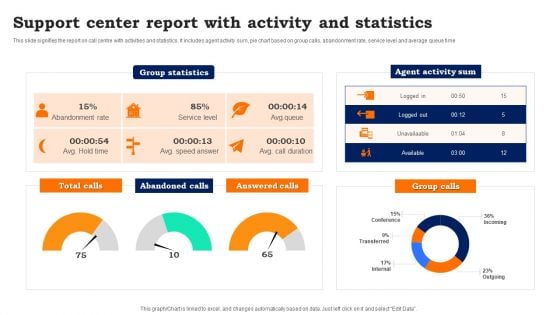
Support Center Report With Activity And Statistics Guidelines PDF
This slide signifies the report on call centre with activities and statistics. It includes agent activity sum, pie chart based on group calls, abandonment rate, service level and average queue time. Pitch your topic with ease and precision using this Support Center Report With Activity And Statistics Guidelines PDF. This layout presents information on Support Center Report, Activity And Statistics. It is also available for immediate download and adjustment. So, changes can be made in the color, design, graphics or any other component to create a unique layout.
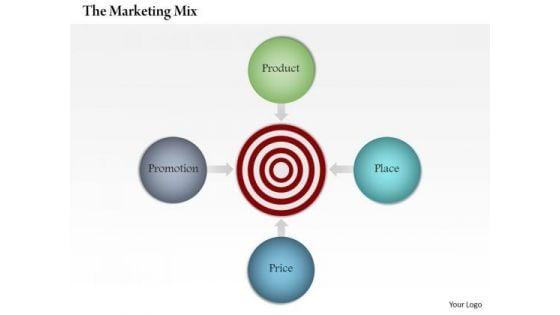
Business Framework Marketing Mix Example PowerPoint Presentation
Four staged process flow chart with target selection techniques has been used to design this business framework PPT. This PPT contains the concept of marketing target selection and achievement process. Add this PPT in your presentation and good comments from viewers.


 Continue with Email

 Home
Home


