Hierarchy Chart Organizational
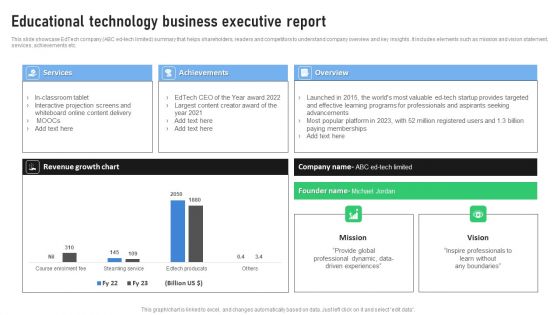
Educational Technology Business Executive Report Clipart PDF
This slide showcase EdTech company ABC ed-tech limited summary that helps shareholders, readers and competitors to understand company overview and key insights. It includes elements such as mission and vision statement, services, achievements etc. Pitch your topic with ease and precision using this Educational Technology Business Executive Report Clipart PDF. This layout presents information on Services, Achievements, Overview. It is also available for immediate download and adjustment. So, changes can be made in the color, design, graphics or any other component to create a unique layout.
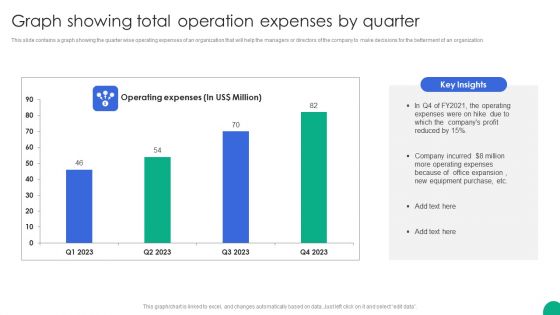
Graph Showing Total Operation Expenses By Quarter Themes PDF
This slide contains a graph showing the quarter wise operating expenses of an organization that will help the managers or directors of the company to make decisions for the betterment of an organization.Pitch your topic with ease and precision using this Graph Showing Total Operation Expenses By Quarter Themes PDF. This layout presents information on Operating Expenses, Equipment Purchase, Office Expansion. It is also available for immediate download and adjustment. So, changes can be made in the color, design, graphics or any other component to create a unique layout.
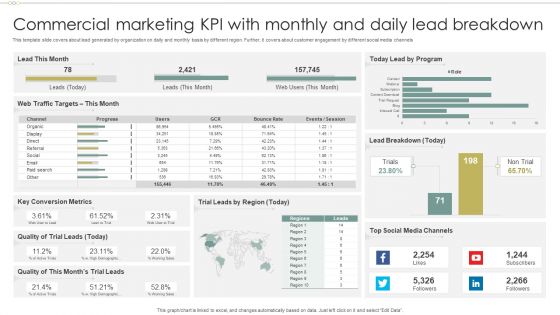
Commercial Marketing KPI With Monthly And Daily Lead Breakdown Ideas PDF
This template slide covers about lead generated by organization on daily and monthly basis by different region. Further, it covers about customer engagement by different social media channels. Pitch your topic with ease and precision using this Commercial Marketing KPI With Monthly And Daily Lead Breakdown Ideas PDF. This layout presents information on Conversion Metrics, Quality Trial, Lead Breakdown. It is also available for immediate download and adjustment. So, changes can be made in the color, design, graphics or any other component to create a unique layout.
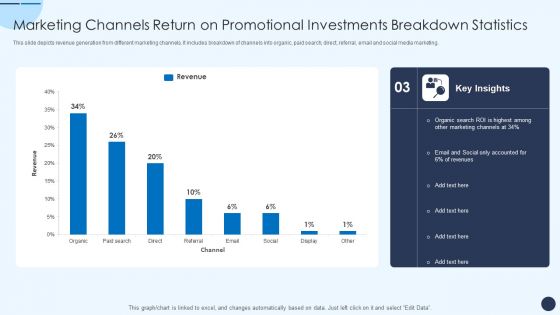
Marketing Channels Return On Promotional Investments Breakdown Statistics Information PDF
This slide depicts revenue generation from different marketing channels. It includes breakdown of channels into organic, paid search, direct, referral, email and social media marketing.Pitch your topic with ease and precision using this Marketing Channels Return On Promotional Investments Breakdown Statistics Information PDF. This layout presents information on Revenues Marketing, Organic Search, Social Accounted. It is also available for immediate download and adjustment. So, changes can be made in the color, design, graphics or any other component to create a unique layout.
Pareto Analysis Shipping Tracking Metrics Dashboard Guidelines PDF
This slide showcases dashboard for analyzing on-time delivery trends. It also includes KPIs such as Pareto analysis and on-time deliveries by shipping organizations. Pitch your topic with ease and precision using this Pareto Analysis Shipping Tracking Metrics Dashboard Guidelines PDF. This layout presents information on Pareto Analysis, Deliveries Trends, Shipping Organization. It is also available for immediate download and adjustment. So, changes can be made in the color, design, graphics or any other component to create a unique layout.
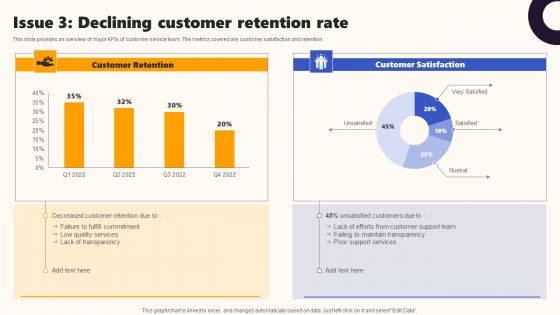
Techniques To Optimize UX Issue 3 Declining Customer Retention Rate Structure PDF
This slide provides an overview of major KPIs of customer service team. The metrics covered are customer satisfaction and retention. The Techniques To Optimize UX Issue 3 Declining Customer Retention Rate Structure PDF is a compilation of the most recent design trends as a series of slides. It is suitable for any subject or industry presentation, containing attractive visuals and photo spots for businesses to clearly express their messages. This template contains a variety of slides for the user to input data, such as structures to contrast two elements, bullet points, and slides for written information. Slidegeeks is prepared to create an impression.
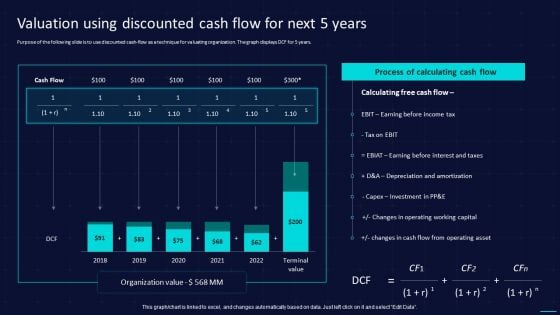
Action Plan To Implement Exit Strategy For Investors Valuation Using Discounted Cash Flow For Next 5 Years Sample PDF
Purpose of the following slide is to use discounted cash flow as a technique for valuating organization. The graph displays DCF for 5 years. Deliver an awe inspiring pitch with this creative Action Plan To Implement Exit Strategy For Investors Valuation Using Discounted Cash Flow For Next 5 Years Sample PDF bundle. Topics like Income Tax, Operating Working Capital, Investment can be discussed with this completely editable template. It is available for immediate download depending on the needs and requirements of the user.
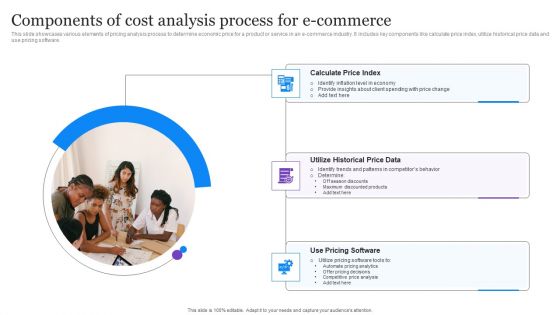
Components Of Cost Analysis Process For E Commerce Portrait PDF
This slide showcases various elements of pricing analysis process to determine economic price for a product or service in an e-commerce industry. It includes key components like calculate price index, utilize historical price data and use pricing software. Persuade your audience using this Components Of Cost Analysis Process For E Commerce Portrait PDF. This PPT design covers three stages, thus making it a great tool to use. It also caters to a variety of topics including Calculate Price Index, Utilize Historical Price Data, Pricing Software. Download this PPT design now to present a convincing pitch that not only emphasizes the topic but also showcases your presentation skills.
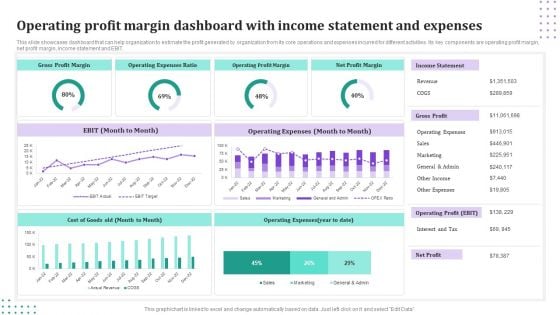
Operating Profit Margin Dashboard With Income Statement And Expenses Brochure PDF
This slide showcases dashboard that can help organization to estimate the profit generated by organization from its core operations and expenses incurred for different activities. Its key components are operating profit margin, net profit margin, income statement and EBIT. Showcasing this set of slides titled Operating Profit Margin Dashboard With Income Statement And Expenses Brochure PDF. The topics addressed in these templates are Operating Expenses, Income Statement, Gross Profit. All the content presented in this PPT design is completely editable. Download it and make adjustments in color, background, font etc. as per your unique business setting.
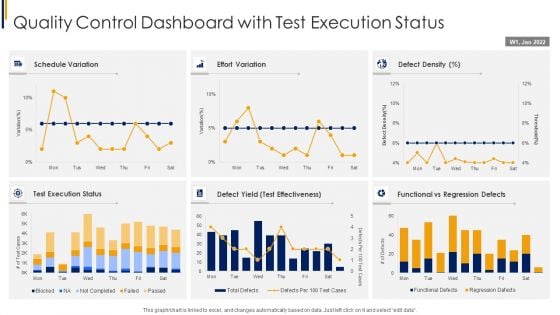
Quality Control Dashboard With Test Execution Status Themes PDF
Pitch your topic with ease and precision using this Quality Control Dashboard With Test Execution Status Themes PDF. This layout presents information on Schedule Variation, Defect Density, Regression Defects. It is also available for immediate download and adjustment. So, changes can be made in the color, design, graphics or any other component to create a unique layout.
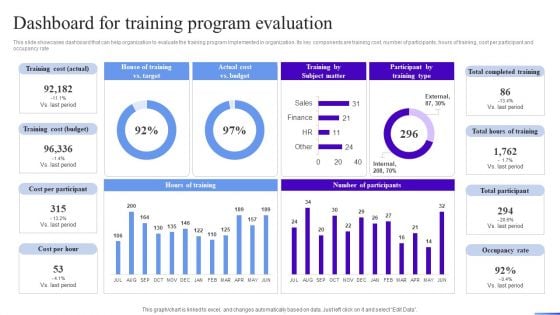
Business Development Program Dashboard For Training Program Evaluation Infographics PDF
This slide showcases dashboard that can help organization to evaluate the training program implemented in organization. Its key components are training cost, number of participants, hours of training, cost per participant and occupancy rate. Get a simple yet stunning designed Business Development Program Dashboard For Training Program Evaluation Infographics PDF. It is the best one to establish the tone in your meetings. It is an excellent way to make your presentations highly effective. So, download this PPT today from Slidegeeks and see the positive impacts. Our easy-to-edit Business Development Program Dashboard For Training Program Evaluation Infographics PDF can be your go-to option for all upcoming conferences and meetings. So, what are you waiting for Grab this template today.
Marketers Guide To Data Analysis Optimization KPI Dashboard For Tracking SEO Analytics Template PDF
This slide covers the KPI dashboard for analyzing SEO metrics such as authority score, organic traffic, organic keywords, paid keywords, ref. Domains, site audit, link-building tool, organic traffic, on-page SEO checker, backlink audit, etc. This Marketers Guide To Data Analysis Optimization KPI Dashboard For Tracking SEO Analytics Template PDF from Slidegeeks makes it easy to present information on your topic with precision. It provides customization options, so you can make changes to the colors, design, graphics, or any other component to create a unique layout. It is also available for immediate download, so you can begin using it right away. Slidegeeks has done good research to ensure that you have everything you need to make your presentation stand out. Make a name out there for a brilliant performance.
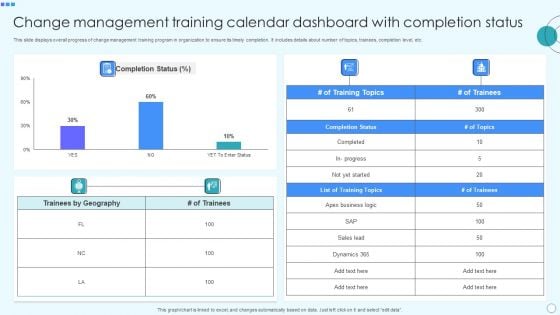
Change Management Training Calendar Dashboard With Completion Status Portrait PDF
This slide displays overall progress of change management training program in organization to ensure its timely completion. It includes details about number of topics, trainees, completion level, etc. Pitch your topic with ease and precision using this Change Management Training Calendar Dashboard With Completion Status Portrait PDF. This layout presents information on Business Logic, Geography, Completion Status, Sales Lead, Dynamics. It is also available for immediate download and adjustment. So, changes can be made in the color, design, graphics or any other component to create a unique layout.
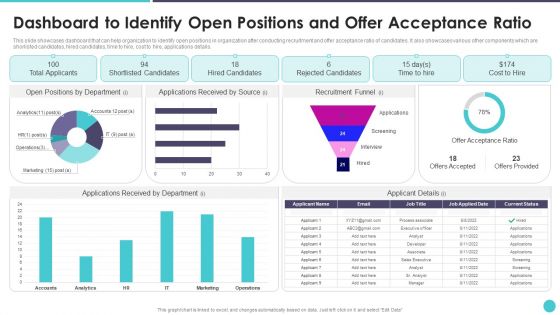
Action Plan To Optimize Hiring Process Dashboard To Identify Open Positions And Offer Acceptance Ratio Rules PDF
This slide showcases dashboard that can help organization to identify open positions in organization after conducting recruitment and offer acceptance ratio of candidates. It also showcases various other components which are shorlisted candidates, hired candidates, time to hire, cost to hire, applications details.Deliver an awe inspiring pitch with this creative Action Plan To Optimize Hiring Process Dashboard To Identify Open Positions And Offer Acceptance Ratio Rules PDF bundle. Topics like Shortlisted Candidates, Hired Candidates, Rejected Candidates can be discussed with this completely editable template. It is available for immediate download depending on the needs and requirements of the user.
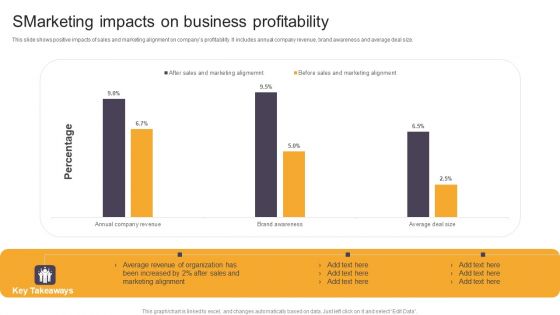
Smarketing Impacts On Business Profitability Ppt Outline Graphics Template PDF
This slide shows positive impacts of sales and marketing alignment on companys profitability. It includes annual company revenue, brand awareness and average deal size. Pitch your topic with ease and precision using this Smarketing Impacts On Business Profitability Ppt Outline Graphics Template PDF. This layout presents information on Sales And Marketing, Average Revenue, Organization. It is also available for immediate download and adjustment. So, changes can be made in the color, design, graphics or any other component to create a unique layout.

Employee Training And Development Strategy Dashboard For Training Program Evaluation Mockup PDF
This slide showcases dashboard that can help organization to evaluate the training program implemented in organization. Its key components are training cost, number of participants, hours of training, cost per participant and occupancy rate. This Employee Training And Development Strategy Dashboard For Training Program Evaluation Mockup PDF from Slidegeeks makes it easy to present information on your topic with precision. It provides customization options, so you can make changes to the colors, design, graphics, or any other component to create a unique layout. It is also available for immediate download, so you can begin using it right away. Slidegeeks has done good research to ensure that you have everything you need to make your presentation stand out. Make a name out there for a brilliant performance.
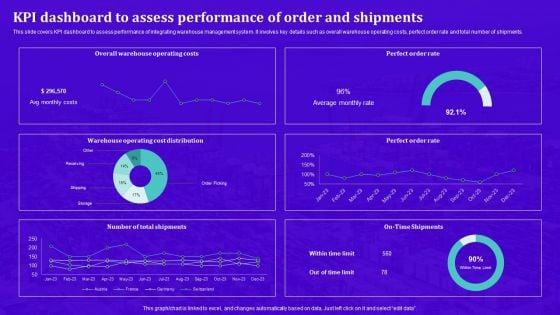
Techniques For Effective Supply Chain Management KPI Dashboard To Assess Performance Of Order And Shipments Structure PDF
This slide covers KPI dashboard to assess performance of integrating warehouse management system. It involves key details such as overall warehouse operating costs, perfect order rate and total number of shipments. Boost your pitch with our creative Techniques For Effective Supply Chain Management KPI Dashboard To Assess Performance Of Order And Shipments Structure PDF. Deliver an awe-inspiring pitch that will mesmerize everyone. Using these presentation templates you will surely catch everyones attention. You can browse the ppts collection on our website. We have researchers who are experts at creating the right content for the templates. So you do not have to invest time in any additional work. Just grab the template now and use them.

Application Test Execution Outcome Reporting To Improve Performance Sample PDF
This slide showcases a report presenting results of application test execution to improve performance and functionality. It includes key components such as summary, status, components, requirements, executions and passed executions. Showcasing this set of slides titled Application Test Execution Outcome Reporting To Improve Performance Sample PDF. The topics addressed in these templates are Login Attempts, Creating Confirmation, Email Requires Retesting. All the content presented in this PPT design is completely editable. Download it and make adjustments in color, background, font etc. as per your unique business setting.
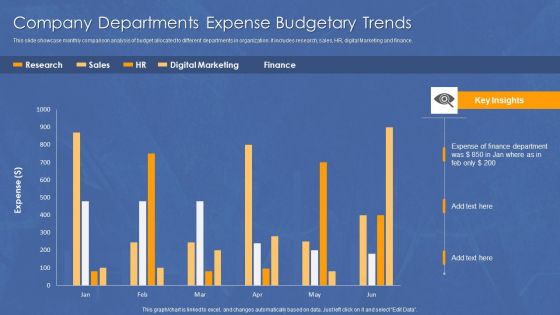
Company Departments Expense Budgetary Trends Diagrams PDF
This slide showcase monthly comparison analysis of budget allocated to different departments in organization. It includes research, sales, HR, digital Marketing and finance. Pitch your topic with ease and precision using this Company Departments Expense Budgetary Trends Diagrams PDF. This layout presents information on Expense, Finance, Department. It is also available for immediate download and adjustment. So, changes can be made in the color, design, graphics or any other component to create a unique layout.
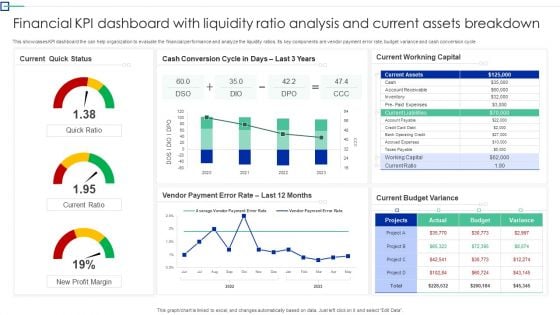
Financial KPI Dashboard With Liquidity Ratio Analysis And Current Assets Breakdown Ideas PDF
This showcases KPI dashboard the can help organization to evaluate the financial performance and analyze the liquidity ratios. Its key components are vendor payment error rate, budget variance and cash conversion cycle. Showcasing this set of slides titled. The topics addressed in these templates are Quick Status, Workning Capital, Budget Variance. All the content presented in this PPT design is completely editable. Download it and make adjustments in color, background, font etc. as per your unique business setting.
Change Requests Tracking Metrics For Company Microsoft PDF
This slide displays dashboard to monitor change requests count assigned and completed for the organization. It includes key components such as models, owners, over time progress, etc Showcasing this set of slides titled Change Requests Tracking Metrics For Company Microsoft PDF The topics addressed in these templates are Departments, Model Owners, Requests. All the content presented in this PPT design is completely editable. Download it and make adjustments in color, background, font etc. as per your unique business setting.
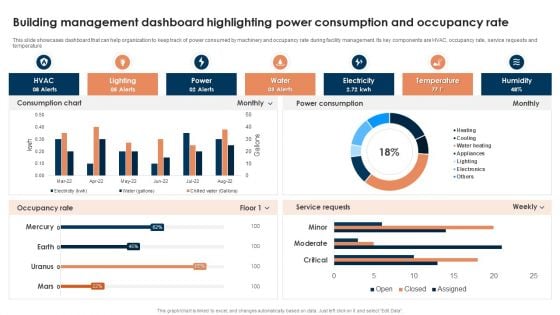
Building Management Dashboard Highlighting Power Consumption And Occupancy Rate Template PDF
This slide showcases dashboard that can help organization to keep track of power consumed by machinery and occupancy rate during facility management. Its key components are HVAC, occupancy rate, service requests and temperature. Pitch your topic with ease and precision using this Building Management Dashboard Highlighting Power Consumption And Occupancy Rate Template PDF. This layout presents information on Lighting, Power, Water, Electricity, Temperature. It is also available for immediate download and adjustment. So, changes can be made in the color, design, graphics or any other component to create a unique layout.
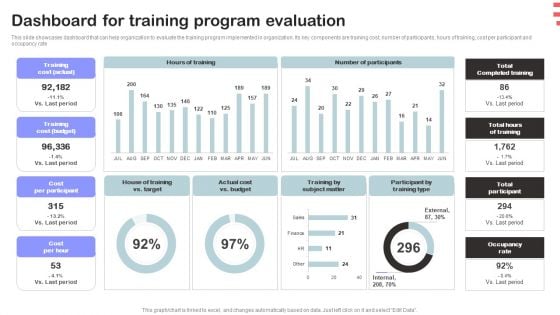
Corporate Training Program Dashboard For Training Program Evaluation Summary PDF
This slide showcases dashboard that can help organization to evaluate the training program implemented in organization. Its key components are training cost, number of participants, hours of training, cost per participant and occupancy rate Are you in need of a template that can accommodate all of your creative concepts This one is crafted professionally and can be altered to fit any style. Use it with Google Slides or PowerPoint. Include striking photographs, symbols, depictions, and other visuals. Fill, move around, or remove text boxes as desired. Test out color palettes and font mixtures. Edit and save your work, or work with colleagues. Download Corporate Training Program Dashboard For Training Program Evaluation Summary PDF and observe how to make your presentation outstanding. Give an impeccable presentation to your group and make your presentation unforgettable.
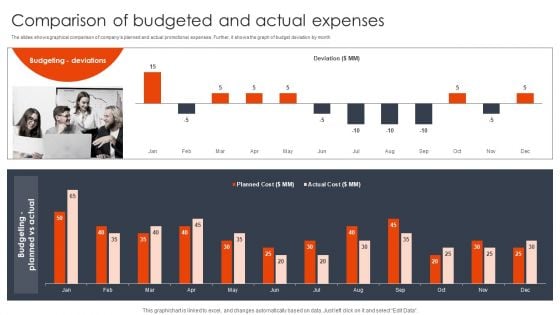
Comparison Of Budgeted And Actual Expenses Client Acquisition Techniques To Boost Sales Designs PDF
The slides shows graphical comparison of companys planned and actual promotional expenses. Further, it shows the graph of budget deviation by month. Create an editable Comparison Of Budgeted And Actual Expenses Client Acquisition Techniques To Boost Sales Designs PDF that communicates your idea and engages your audience. Whether you are presenting a business or an educational presentation, pre-designed presentation templates help save time. Comparison Of Budgeted And Actual Expenses Client Acquisition Techniques To Boost Sales Designs PDF is highly customizable and very easy to edit, covering many different styles from creative to business presentations. Slidegeeks has creative team members who have crafted amazing templates. So, go and get them without any delay.
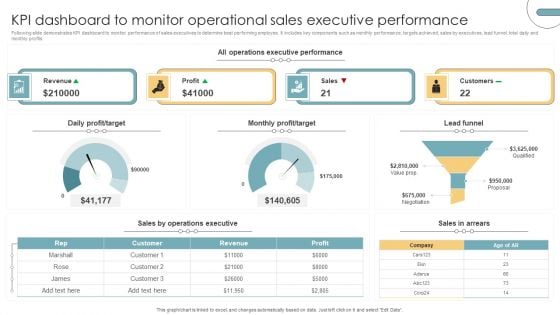
KPI Dashboard To Monitor Operational Sales Executive Performance Portrait PDF
Following slide demonstrates KPI dashboard to monitor performance of sales executives to determine best performing employee. It includes key components such as monthly performance, targets achieved, sales by executives, lead funnel, total daily and monthly profits. Pitch your topic with ease and precision using this KPI Dashboard To Monitor Operational Sales Executive Performance Portrait PDF. This layout presents information on Revenue, Profit, Sales, Customers. It is also available for immediate download and adjustment. So, changes can be made in the color, design, graphics or any other component to create a unique layout.
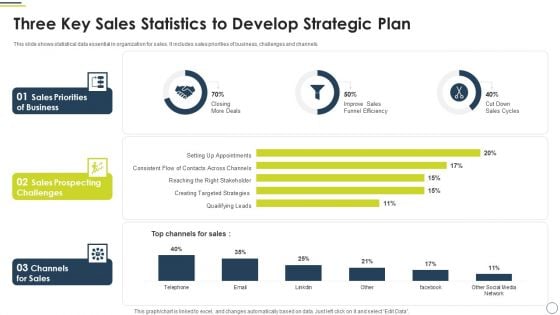
Three Key Sales Statistics To Develop Strategic Plan Microsoft PDF
This slide shows statistical data essential in organization for sales. It includes sales priorities of business, challenges and channels. Pitch your topic with ease and precision using this Three Key Sales Statistics To Develop Strategic Plan Microsoft PDF. This layout presents information on Sales Priorities Business, Sales Prospecting Challenges, Channels For Sales. It is also available for immediate download and adjustment. So, changes can be made in the color, design, graphics or any other component to create a unique layout.
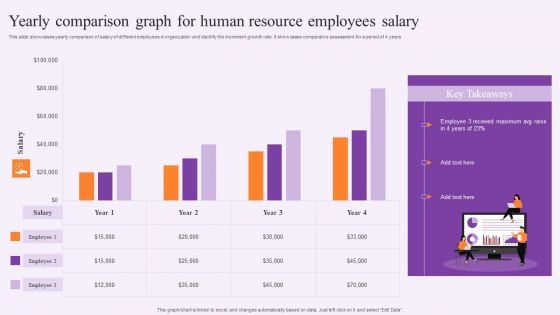
Yearly Comparison Graph For Human Resource Employees Salary Template PDF
This slide showcases yearly comparison of salary of different employees in organization and identify the increment growth rate. It showcases comparative assessment for a period of 4 years. Pitch your topic with ease and precision using this Yearly Comparison Graph For Human Resource Employees Salary Template PDF. This layout presents information on Human Resource, Employees Salary. It is also available for immediate download and adjustment. So, changes can be made in the color, design, graphics or any other component to create a unique layout.

Supplier Performance Dashboard With Compensation Status Themes PDF
This slide showcases payment performance dashboard that can help organization to analyze the outstanding amount by different vendors and impose necessary restrictions in case of any delay. Its key components are amount paid early, total money paid, paid on time and paid late. Pitch your topic with ease and precision using this supplier performance dashboard with compensation status themes pdf. This layout presents information on supplier performance dashboard with compensation status. It is also available for immediate download and adjustment. So, changes can be made in the color, design, graphics or any other component to create a unique layout.
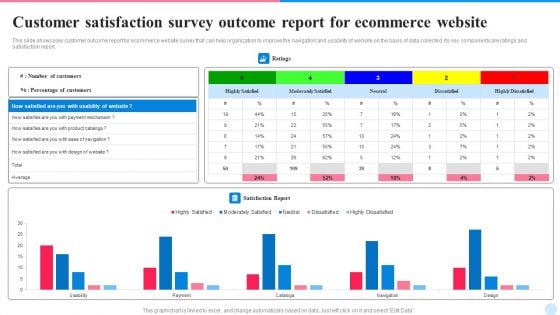
Customer Satisfaction Survey Outcome Report For Ecommerce Website Themes PDF
This slide showcases customer outcome report for ecommerce website survey that can help organization to improve the navigation and usability of website on the basis of data collected. Its key components are ratings and satisfaction report. Pitch your topic with ease and precision using this Customer Satisfaction Survey Outcome Report For Ecommerce Website Themes PDF. This layout presents information on Customer Satisfaction, Survey Outcome Report, Ecommerce Website. It is also available for immediate download and adjustment. So, changes can be made in the color, design, graphics or any other component to create a unique layout.
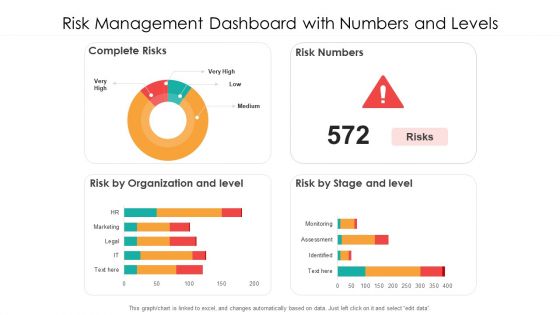
Risk Management Dashboard With Numbers And Levels Ppt PowerPoint Presentation Infographics Picture PDF
Pitch your topic with ease and precision using this risk management dashboard with numbers and levels ppt powerpoint presentation infographics picture pdf. This layout presents information on complete risks, risk numbers, risk by organization and level. It is also available for immediate download and adjustment. So, changes can be made in the color, design, graphics or any other component to create a unique layout.
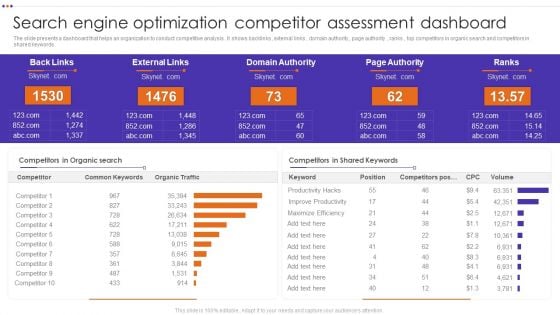
Search Engine Optimization Competitor Assessment Dashboard Graphics PDF
Pitch your topic with ease and precision using this Search Engine Optimization Competitor Assessment Dashboard Graphics PDF. This layout presents information on Domain Authority, External Links, Competitors In Organic. It is also available for immediate download and adjustment. So, changes can be made in the color, design, graphics or any other component to create a unique layout.

Dashboard Depicting Website Data Insights Creating Branding Techniques To Increase Brand Awareness Structure PDF
This slide shows the dashboard that depicts website data insights which covers channels such as display, social and email with total sessions, pages, average session duration, bounce rate, goal completion.Do you have to make sure that everyone on your team knows about any specific topic I yes, then you should give Dashboard Depicting Website Data Insights Creating Branding Techniques To Increase Brand Awareness Structure PDF a try. Our experts have put a lot of knowledge and effort into creating this impeccable Dashboard Depicting Website Data Insights Creating Branding Techniques To Increase Brand Awareness Structure PDF. You can use this template for your upcoming presentations, as the slides are perfect to represent even the tiniest detail. You can download these templates from the Slidegeeks website and these are easy to edit. So grab these today.
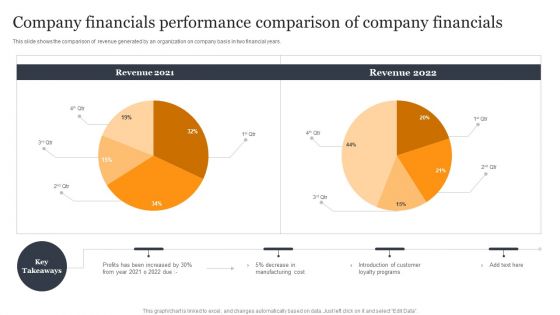
Company Financials Performance Comparison Of Company Financials Formats PDF
This slide shows the comparison of revenue generated by an organization on company basis in two financial years. Pitch your topic with ease and precision using this Company Financials Performance Comparison Of Company Financials Formats PDF. This layout presents information on Manufacturing Cost, Introduction Customer, Loyalty Programs. It is also available for immediate download and adjustment. So, changes can be made in the color, design, graphics or any other component to create a unique layout.
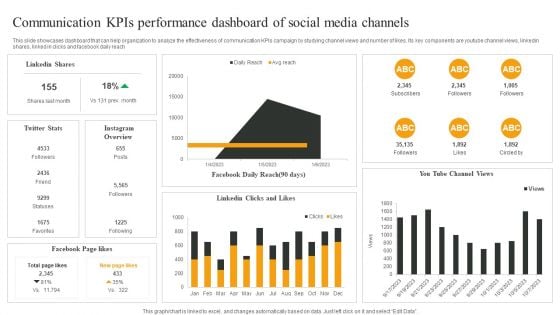
Communication Kpis Performance Dashboard Of Social Media Channels Mockup PDF
This slide showcases dashboard that can help organization to analyze the effectiveness of communication KPIs campaign by studying channel views and number of likes. Its key components are youtube channel views, linkedin shares, linked in clicks and facebook daily reach. Pitch your topic with ease and precision using this Communication Kpis Performance Dashboard Of Social Media Channels Mockup PDF. This layout presents information on Linkedin Shares, Facebook Page likes, Facebook Daily Reach. It is also available for immediate download and adjustment. So, changes can be made in the color, design, graphics or any other component to create a unique layout.
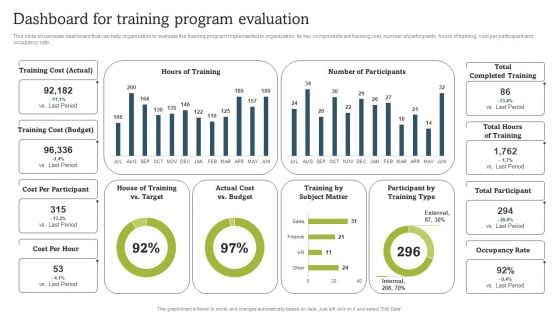
On Job Staff Coaching Program For Skills Refinement Dashboard For Training Program Evaluation Download PDF
This slide showcases dashboard that can help organization to evaluate the training program implemented in organization. Its key components are training cost, number of participants, hours of training, cost per participant and occupancy rate. Boost your pitch with our creative On Job Staff Coaching Program For Skills Refinement Dashboard For Training Program Evaluation Download PDF. Deliver an awe inspiring pitch that will mesmerize everyone. Using these presentation templates you will surely catch everyones attention. You can browse the ppts collection on our website. We have researchers who are experts at creating the right content for the templates. So you do not have to invest time in any additional work. Just grab the template now and use them.
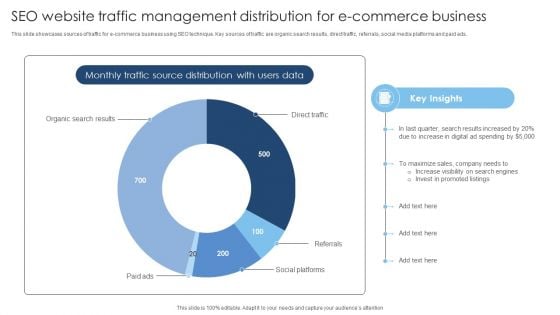
SEO Website Traffic Management Distribution For E Commerce Business Rules PDF
This slide showcases sources of traffic for e commerce business using SEO technique. Key sources of traffic are organic search results, direct traffic, referrals, social media platforms and paid ads. Showcasing this set of slides titled SEO Website Traffic Management Distribution For E Commerce Business Rules PDF. The topics addressed in these templates are Monthly Traffic, Source Distribution, Users Data. All the content presented in this PPT design is completely editable. Download it and make adjustments in color, background, font etc. as per your unique business setting.
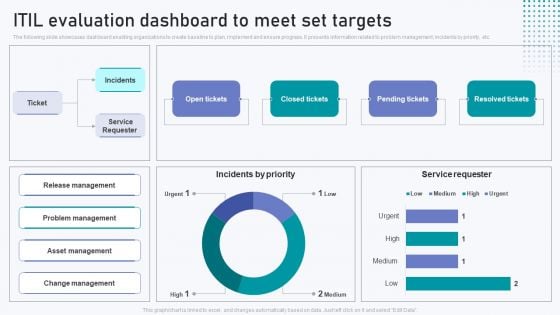
ITIL Evaluation Dashboard To Meet Set Targets Summary PDF
The following slide showcases dashboard enabling organizations to create baseline to plan, implement and ensure progress. It presents information related to problem management, incidents by priority, etc. Pitch your topic with ease and precision using this ITIL Evaluation Dashboard To Meet Set Targets Summary PDF. This layout presents information on Incidents By Priority, Service Requester. It is also available for immediate download and adjustment. So, changes can be made in the color, design, graphics or any other component to create a unique layout.
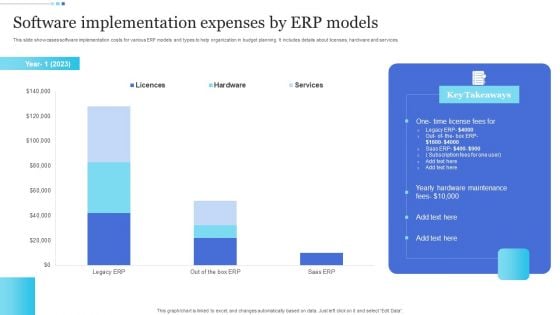
Software Implementation Expenses By ERP Models Topics PDF
This slide showcases software implementation costs for various ERP models and types to help organization in budget planning. It includes details about licenses, hardware and services. Pitch your topic with ease and precision using this Software Implementation Expenses By ERP Models Topics PDF. This layout presents information on Licenses, Hardware, Services. It is also available for immediate download and adjustment. So, changes can be made in the color, design, graphics or any other component to create a unique layout.

Financial Dashboard For Non Profit Financial Plan Budget Management Elements PDF
The below slide exhibits a financial dashboard for non profit organizations that helps managers to analyze financial performance in an effective way. Key components are revenue ratio by entity, revenue ratio by type, etc.Pitch your topic with ease and precision using this Financial Dashboard For Non Profit Financial Plan Budget Management Elements PDF. This layout presents information on Revenue Actual, Revenue Actual. It is also available for immediate download and adjustment. So, changes can be made in the color, design, graphics or any other component to create a unique layout.
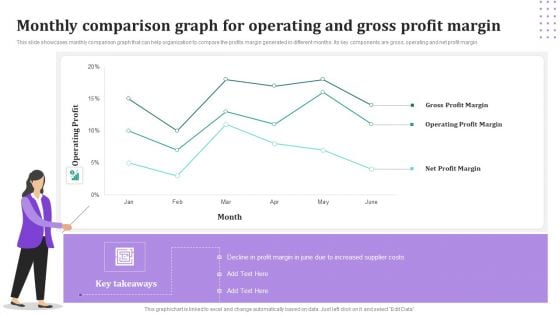
Monthly Comparison Graph For Operating And Gross Profit Margin Pictures PDF
This slide showcases monthly comparison graph that can help organization to compare the profits margin generated in different months. Its key components are gross, operating and net profit margin. Showcasing this set of slides titled Monthly Comparison Graph For Operating And Gross Profit Margin Pictures PDF. The topics addressed in these templates are Gross Profit Margin, Operating Profit Margin, Net Profit Margin. All the content presented in this PPT design is completely editable. Download it and make adjustments in color, background, font etc. as per your unique business setting.
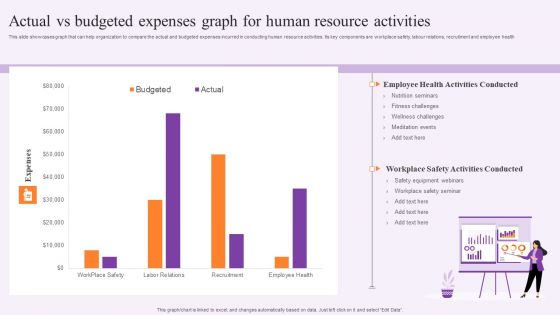
Actual Vs Budgeted Expenses Graph For Human Resource Activities Guidelines PDF
This slide showcases graph that can help organization to compare the actual and budgeted expenses incurred in conducting human resource activities. Its key components are workplace safety, labour relations, recruitment and employee health. Showcasing this set of slides titled Actual Vs Budgeted Expenses Graph For Human Resource Activities Guidelines PDF. The topics addressed in these templates are Safety Equipment Webinars, Employee, Expenses. All the content presented in this PPT design is completely editable. Download it and make adjustments in color, background, font etc. as per your unique business setting.
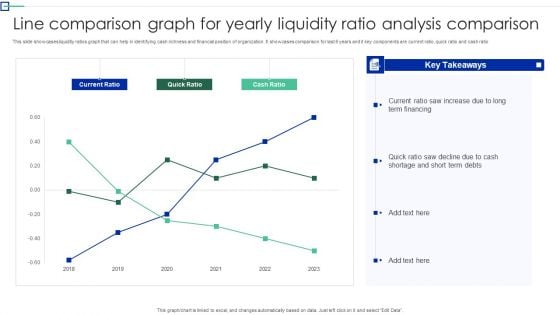
Line Comparison Graph For Yearly Liquidity Ratio Analysis Comparison Topics PDF
This slide showcases liquidity ratios graph that can help in identifying cash richness and financial position of organization. It showcases comparison for last 6 years and it key components are current ratio, quick ratio and cash ratio. Showcasing this set of slides titled Line Comparison Graph For Yearly Liquidity Ratio Analysis Comparison Topics PDF. The topics addressed in these templates are Term Financing, Cash Shortage, Cash Ratio. All the content presented in this PPT design is completely editable. Download it and make adjustments in color, background, font etc. as per your unique business setting.
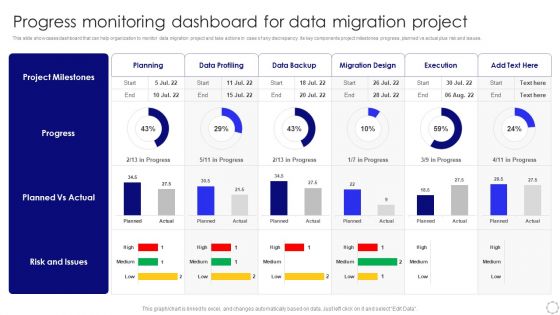
Progress Monitoring Dashboard For Data Migration Project Sample PDF
This slide showcases dashboard that can help organization to monitor data migration project and take actions in case of any discrepancy. Its key components project milestones progress, planned vs actual plus risk and issues. Pitch your topic with ease and precision using this Progress Monitoring Dashboard For Data Migration Project Sample PDF. This layout presents information on Planned Vs Actual, Risk And Issues, Project Milestones. It is also available for immediate download and adjustment. So, changes can be made in the color, design, graphics or any other component to create a unique layout.
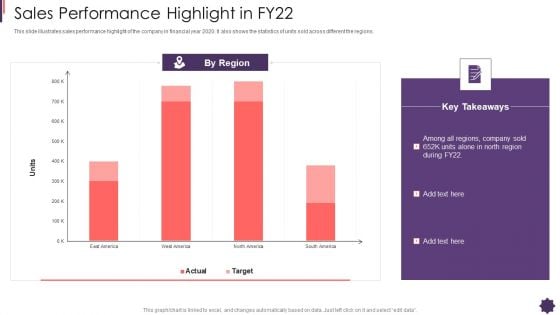
Sales Performance Highlight In Fy22 Brand Techniques Structure Designs PDF
This slide illustrates sales performance highlight of the company in financial year 2020. It also shows the statistics of units sold across different the regions. Deliver and pitch your topic in the best possible manner with this sales performance highlight in fy22 brand techniques structure designs pdf. Use them to share invaluable insights on sales performance highlight in fy22 and impress your audience. This template can be altered and modified as per your expectations. So, grab it now.
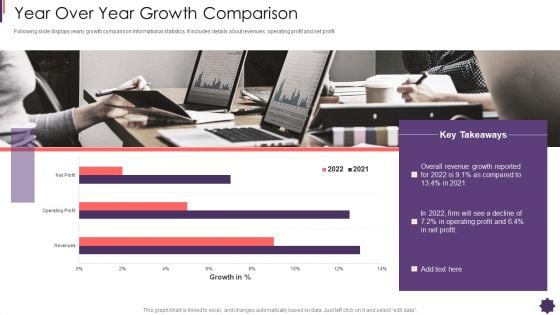
Year Over Year Growth Comparison Brand Techniques Structure Designs PDF
Following slide displays yearly growth comparison informational statistics. It includes details about revenues, operating profit and net profit. Deliver an awe inspiring pitch with this creative year over year growth comparison brand techniques structure designs pdf bundle. Topics like revenue, growth, profit can be discussed with this completely editable template. It is available for immediate download depending on the needs and requirements of the user.
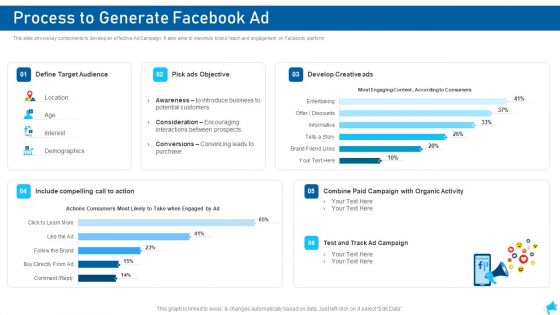
Social Media Marketing Process To Generate Facebook Ad Demonstration PDF
This slide shows key components to develop an effective Ad Campaign. It also aims to maximize brand reach and engagement on Facebook platform. Deliver and pitch your topic in the best possible manner with this social media marketing process to generate facebook ad demonstration pdf. Use them to share invaluable insights on organic, purchase, potential, demographics, target and impress your audience. This template can be altered and modified as per your expectations. So, grab it now.
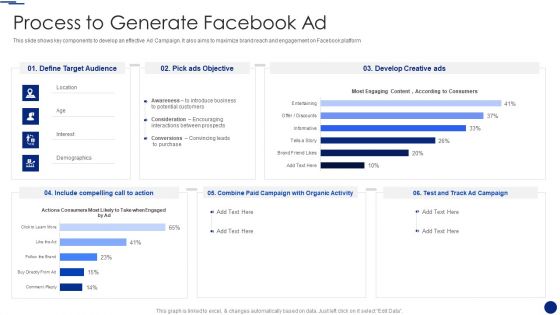
Social Media Marketing Through Facebook Process To Generate Facebook Ad Slides PDF
This slide shows key components to develop an effective Ad Campaign. It also aims to maximize brand reach and engagement on Facebook platform. Deliver an awe inspiring pitch with this creative Social Media Marketing Through Facebook Process To Generate Facebook Ad Slides PDF bundle. Topics like Include Compelling, Organic Activity, Develop Creative can be discussed with this completely editable template. It is available for immediate download depending on the needs and requirements of the user.
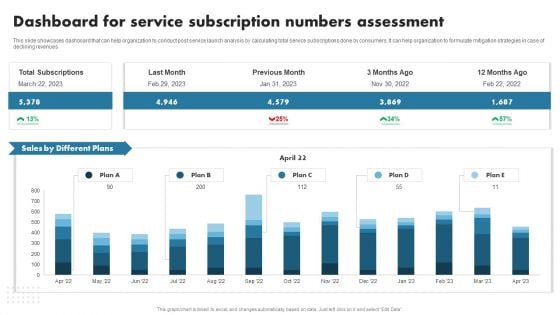
Enhancing Customer Outreach Dashboard For Service Subscription Numbers Template PDF
This slide showcases dashboard that can help organization to conduct post service launch analysis by calculating total service subscriptions done by consumers. It can help organization to formulate mitigation strategies in case of declining revenues. This Enhancing Customer Outreach Dashboard For Service Subscription Numbers Template PDF from Slidegeeks makes it easy to present information on your topic with precision. It provides customization options, so you can make changes to the colors, design, graphics, or any other component to create a unique layout. It is also available for immediate download, so you can begin using it right away. Slidegeeks has done good research to ensure that you have everything you need to make your presentation stand out. Make a name out there for a brilliant performance.
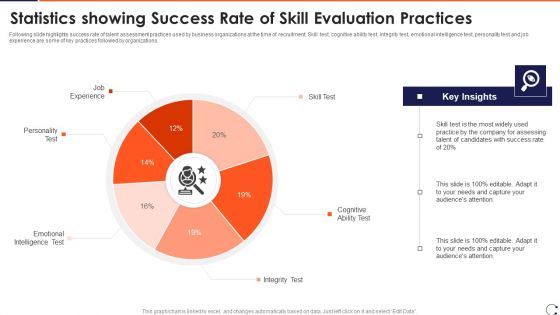
Statistics Showing Success Rate Of Skill Evaluation Practices Topics PDF
Following slide highlights success rate of talent assessment practices used by business organizations at the time of recruitment. Skill test, cognitive ability test, integrity test, emotional intelligence test, personality test and job experience are some of key practices followed by organizations.Pitch your topic with ease and precision using this Statistics Showing Success Rate Of Skill Evaluation Practices Topics PDF This layout presents information on Emotional Intelligence, Test Cognitive, Personality Test It is also available for immediate download and adjustment. So, changes can be made in the color, design, graphics or any other component to create a unique layout.
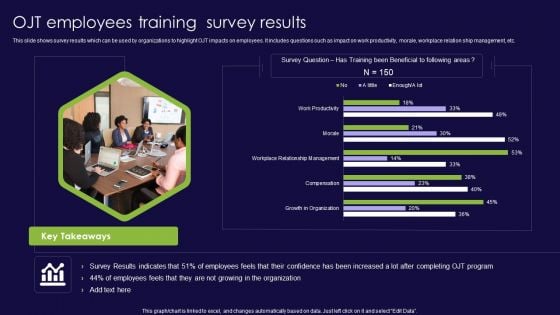
OJT Employees Training Survey Results Ppt PowerPoint Presentation File Master Slide PDF
This slide shows survey results which can be used by organizations to highlight OJT impacts on employees. It includes questions such as impact on work productivity, morale, workplace relation ship management, etc. Pitch your topic with ease and precision using this OJT Employees Training Survey Results Ppt PowerPoint Presentation File Master Slide PDF. This layout presents information on Growth Organization, Compensation, Workplace Relationship Management. It is also available for immediate download and adjustment. So, changes can be made in the color, design, graphics or any other component to create a unique layout.
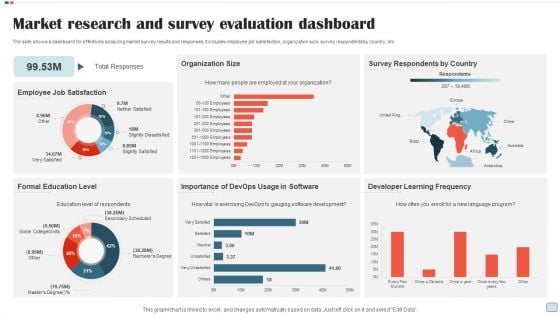
Market Research And Survey Evaluation Dashboard Rules PDF
The slide shows a dashboard for effectively analyzing market survey results and responses. It includes employee job satisfaction, organization size, survey respondents by country, etc. Pitch your topic with ease and precision using this Market Research And Survey Evaluation Dashboard Rules PDF. This layout presents information on Employee Job Satisfaction, Organization Size, Survey Respondents By Country. It is also available for immediate download and adjustment. So, changes can be made in the color, design, graphics or any other component to create a unique layout.
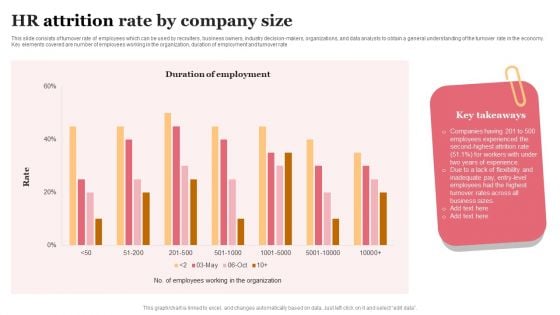
HR Attrition Rate By Company Size Elements PDF
This slide consists of turnover rate of employees which can be used by recruiters, business owners, industry decision-makers, organizations, and data analysts to obtain a general understanding of the turnover rate in the economy. Key elements covered are number of employees working in the organization, duration of employment and turnover rate. Pitch your topic with ease and precision using this HR Attrition Rate By Company Size Elements PDF. This layout presents information on Key Takeaways, Business Sizes, Employees. It is also available for immediate download and adjustment. So, changes can be made in the color, design, graphics or any other component to create a unique layout.
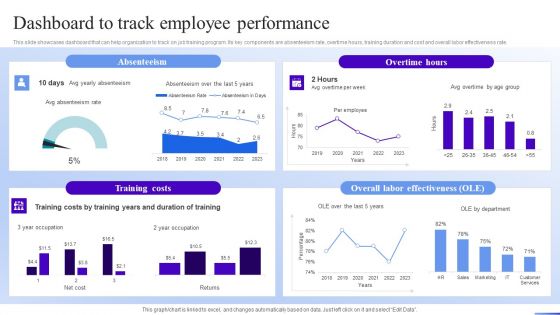
Business Development Program Dashboard To Track Employee Performance Portrait PDF
This slide showcases dashboard that can help organization to track on job training program. Its key components are absenteeism rate, overtime hours, training duration and cost and overall labor effectiveness rate. From laying roadmaps to briefing everything in detail, our templates are perfect for you. You can set the stage with your presentation slides. All you have to do is download these easy-to-edit and customizable templates. Business Development Program Dashboard To Track Employee Performance Portrait PDF will help you deliver an outstanding performance that everyone would remember and praise you for. Do download this presentation today.
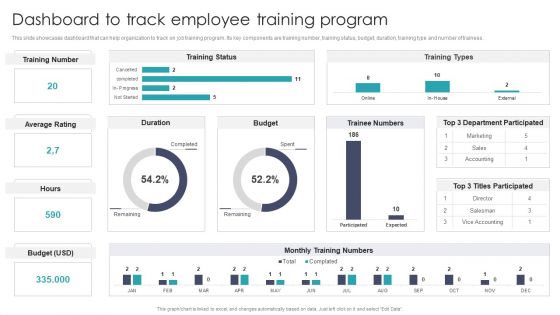
Dashboard To Track Employee Training Program Slides PDF
This slide showcases dashboard that can help organization to track on job training program. Its key components are training number, training status, budget, duration, training type and number of trainees. Want to ace your presentation in front of a live audience Our Dashboard To Track Employee Training Program Slides PDF can help you do that by engaging all the users towards you. Slidegeeks experts have put their efforts and expertise into creating these impeccable powerpoint presentations so that you can communicate your ideas clearly. Moreover, all the templates are customizable, and easy to edit and downloadable. Use these for both personal and commercial use.
Customer Service Metrics Dashboard With Customer Retention Rate Icons PDF
This slide showcases KPIs dashboard for customer service that can help organization to track the consumer satisfaction score and improve product or service by improving customer loyalty. Its key components are net promoter score, customer retention and support costs. Showcasing this set of slides titled Customer Service Metrics Dashboard With Customer Retention Rate Icons PDF. The topics addressed in these templates are Customer Retention, Net Promoter Score, Service Level. All the content presented in this PPT design is completely editable. Download it and make adjustments in color, background, font etc. as per your unique business setting.

Performance Analysis Using Operating Revenue Business Operational Expenditure And Income Metrics Diagrams PDF
This slide illustrates performance analysis using operating revenue, operating expenditure opex and income metrics which can be referred by organizations to evaluate their inflows and outflows to make relevant decisions for increasing profitability. It includes information about operating revenue, operating expense and income before taxes. Pitch your topic with ease and precision using this Performance Analysis Using Operating Revenue Business Operational Expenditure And Income Metrics Diagrams PDF. This layout presents information on Taxes, Highest Operating, Recorded. It is also available for immediate download and adjustment. So, changes can be made in the color, design, graphics or any other component to create a unique layout.
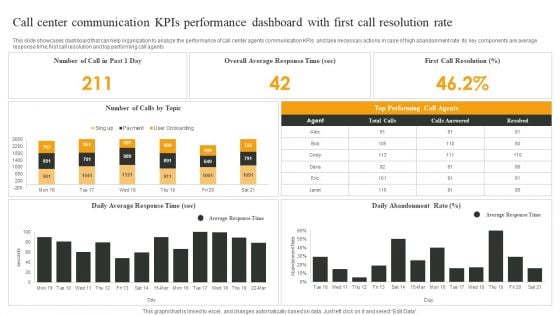
Call Center Communication Kpis Performance Dashboard With First Call Resolution Rate Graphics PDF
This slide showcases dashboard that can help organization to analyze the performance of call center agents communication KPIs and take necessary actions in case of high abandonment rate. Its key components are average response time, first call resolution and top performing call agents. Showcasing this set of slides titled Call Center Communication Kpis Performance Dashboard With First Call Resolution Rate Graphics PDF. The topics addressed in these templates are Overall Average, Response Time, First Call Resolution, Daily Abandonment Rate. All the content presented in this PPT design is completely editable. Download it and make adjustments in color, background, font etc. as per your unique business setting.
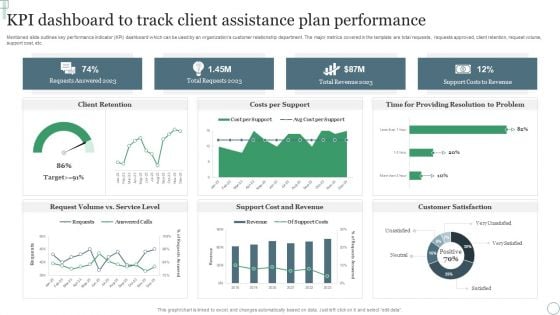
KPI Dashboard To Track Client Assistance Plan Performance Ppt Professional Outfit PDF
Mentioned slide outlines key performance indicator KPI dashboard which can be used by an organizations customer relationship department. The major metrics covered in the template are total requests, requests approved, client retention, request volume, support cost, etc. Pitch your topic with ease and precision using this KPI Dashboard To Track Client Assistance Plan Performance Ppt Professional Outfit PDF. This layout presents information on Requests Answered 2023, Total Requests 2023, Total Revenue 2023. It is also available for immediate download and adjustment. So, changes can be made in the color, design, graphics or any other component to create a unique layout.
Digital Marketing Dashboard For Tracking Lead Generation Guidelines PDF
This slide showcases dashboard for digital marketing that can help organization track the monthly leads generated and performance of online marketing campaigns. Its key components are lead breakdown, total lead by program, web traffic targets, key conversion metrics, trial leads by region, total social media channels and key conversion metrics. Showcasing this set of slides titled Digital Marketing Dashboard For Tracking Lead Generation Guidelines PDF. The topics addressed in these templates are Lead By Program, Lead Breakdown, Key Conversion Metrics. All the content presented in this PPT design is completely editable. Download it and make adjustments in color, background, font etc. as per your unique business setting.
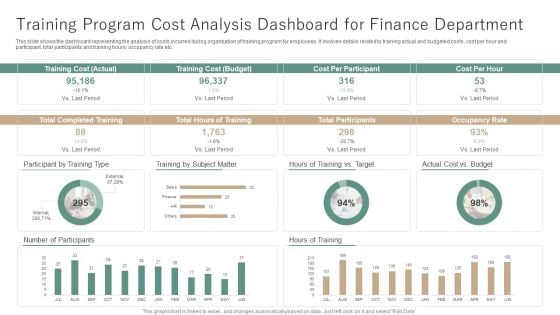
Training Program Cost Analysis Dashboard For Finance Department Ppt Example PDF
This slide shows the dashboard representing the analysis of costs incurred during organization of training program for employees. It involves details related to training actual and budgeted costs, cost per hour and participant, total participants and training hours, occupancy rate etc. Pitch your topic with ease and precision using this Training Program Cost Analysis Dashboard For Finance Department Ppt Example PDF. This layout presents information on Training Cost, Number Participants, Hours Of Training. It is also available for immediate download and adjustment. So, changes can be made in the color, design, graphics or any other component to create a unique layout.


 Continue with Email

 Home
Home


