Hierarchy Chart Organizational
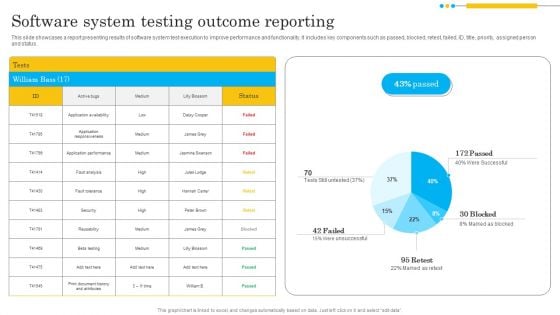
Software System Testing Outcome Reporting Infographics PDF
This slide showcases a report presenting results of software system test execution to improve performance and functionality. It includes key components such as passed, blocked, retest, failed, ID, title, priority, assigned person and status. Showcasing this set of slides titled Software System Testing Outcome Reporting Infographics PDF. The topics addressed in these templates are Application Responsiveness, Application Performance, Security. All the content presented in this PPT design is completely editable. Download it and make adjustments in color, background, font etc. as per your unique business setting.
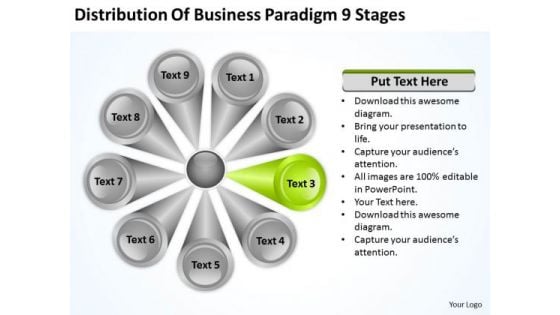
Business PowerPoint Presentation Paradigm 9 Stages Plan Templates
We present our business powerpoint presentation paradigm 9 stages plan templates.Use our Circle Charts PowerPoint Templates because You can Stir your ideas in the cauldron of our PowerPoint Templates and Slides. Cast a magic spell on your audience. Download and present our Shapes PowerPoint Templates because you can Add colour to your speech with our PowerPoint Templates and Slides. Your presentation will leave your audience speechless. Download our Business PowerPoint Templates because you should Whip up a frenzy with our PowerPoint Templates and Slides. They will fuel the excitement of your team. Download our Signs PowerPoint Templates because you should Whip up a frenzy with our PowerPoint Templates and Slides. They will fuel the excitement of your team. Download and present our Curves and Lines PowerPoint Templates because Your ideas provide food for thought. Our PowerPoint Templates and Slides will help you create a dish to tickle the most discerning palate.Use these PowerPoint slides for presentations relating to diagram, model, business, chart, processes, sales, components, concept, vector, selling, distribution, marketing, abstract, management, illustration, icon, strategy, activities, executive, design, procedure, organization, advertising, conceptual, resource, promotion, editable. The prominent colors used in the PowerPoint template are Green lime, Gray, White. Carry your team with our Business PowerPoint Presentation Paradigm 9 Stages Plan Templates. You will come out on top.
Statistics Indicating Recurring Business Operational Expenditure In Telecom Operations Icons PDF
This slide shows statistics indicating recurring operating expenditure OPEX in telecom operations which can benefit their executives in evaluating the current expenses and make cost effective amendments for future operations. It includes information about maintenance, repair, network charging and billing, customer support, marketing and operational planning costs. Pitch your topic with ease and precision using this Statistics Indicating Recurring Business Operational Expenditure In Telecom Operations Icons PDF. This layout presents information on Company, Costs, Marketing Costs. It is also available for immediate download and adjustment. So, changes can be made in the color, design, graphics or any other component to create a unique layout.
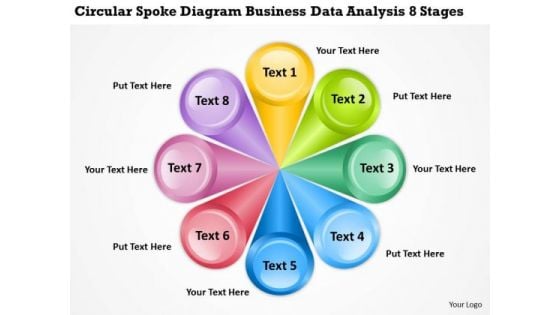
Diagram Business Data Analysis 8 Stages Real Estate Plan Examples PowerPoint Slides
We present our diagram business data analysis 8 stages real estate plan examples PowerPoint Slides.Use our Circle Charts PowerPoint Templates because You will get more than you ever bargained for. Use our Shapes PowerPoint Templates because Our PowerPoint Templates and Slides will help you be quick off the draw. Just enter your specific text and see your points hit home. Download our Business PowerPoint Templates because It can be used to Set your controls for the heart of the sun. Our PowerPoint Templates and Slides will be the propellant to get you there. Download our Signs PowerPoint Templates because you should Whip up a frenzy with our PowerPoint Templates and Slides. They will fuel the excitement of your team. Present our Curves and Lines PowerPoint Templates because Our PowerPoint Templates and Slides are effectively colour coded to prioritise your plans They automatically highlight the sequence of events you desire.Use these PowerPoint slides for presentations relating to diagram, model, business, chart, processes, sales, components, concept, vector, selling, distribution, marketing, abstract, management, illustration, icon, strategy, activities, executive, design, procedure, organization, advertising, conceptual, resource, promotion, editable. The prominent colors used in the PowerPoint template are Yellow, Green, Blue. Lead your argument with our Diagram Business Data Analysis 8 Stages Real Estate Plan Examples PowerPoint Slides. You will come out on top.
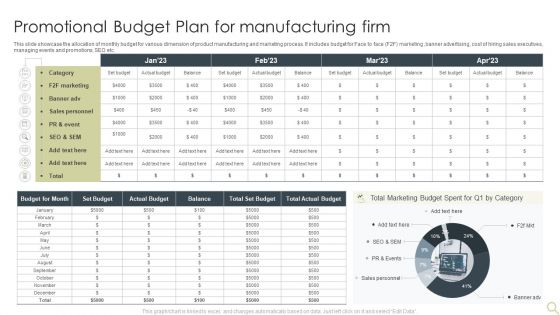
Promotional Budget Plan For Manufacturing Firm Information PDF
This slide showcase the allocation of monthly budget for various dimension of product manufacturing and marketing process. It includes budget for Face to face F2F marketing ,banner advertising, cost of hiring sales executives, managing events and promotions, SEO etc. Pitch your topic with ease and precision using this Promotional Budget Plan For Manufacturing Firm Information PDF. This layout presents information on Marketing, Budget, Sales Personnel. It is also available for immediate download and adjustment. So, changes can be made in the color, design, graphics or any other component to create a unique layout.
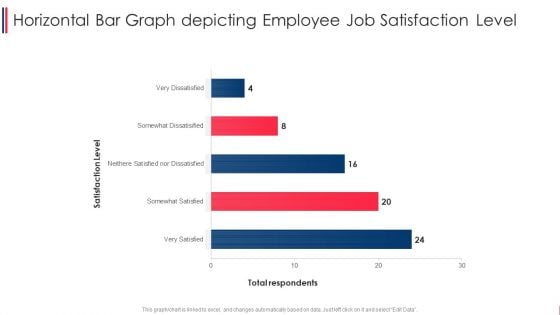
Horizontal Bar Graph Depicting Employee Job Satisfaction Level Summary PDF
Pitch your topic with ease and precision using this horizontal bar graph depicting employee job satisfaction level summary pdf. This layout presents information on horizontal bar graph depicting employee job satisfaction level. It is also available for immediate download and adjustment. So, changes can be made in the color, design, graphics or any other component to create a unique layout.
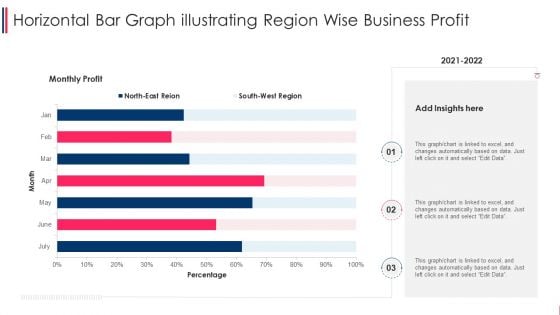
Horizontal Bar Graph Illustrating Region Wise Business Profit Microsoft PDF
Pitch your topic with ease and precision using this horizontal bar graph illustrating region wise business profit microsoft pdf. This layout presents information on horizontal bar graph illustrating region wise business profit. It is also available for immediate download and adjustment. So, changes can be made in the color, design, graphics or any other component to create a unique layout.
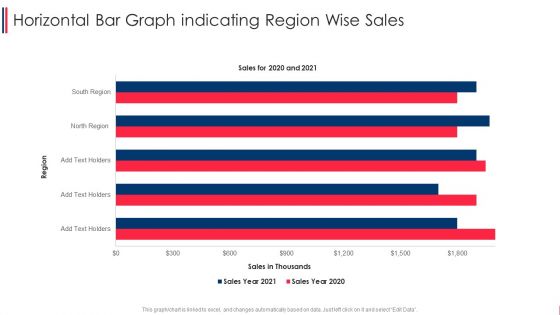
Horizontal Bar Graph Indicating Region Wise Sales Formats PDF
Pitch your topic with ease and precision using this horizontal bar graph indicating region wise sales formats pdf. This layout presents information on horizontal bar graph indicating region wise sales. It is also available for immediate download and adjustment. So, changes can be made in the color, design, graphics or any other component to create a unique layout.
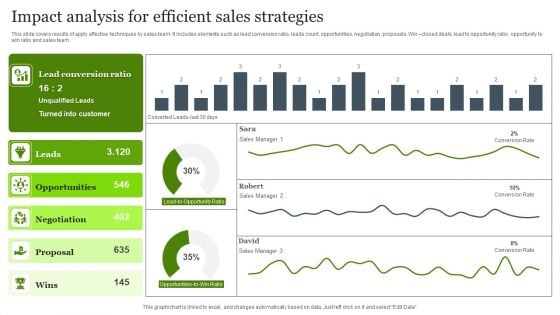
Impact Analysis For Efficient Sales Strategies Diagrams PDF
This slide covers results of apply effective techniques by sales team. It includes elements such as lead conversion ratio, leads count, opportunities, negotiation, proposals. Win closed deals, lead to opportunity ratio, opportunity to win ratio and sales team. Pitch your topic with ease and precision using this Impact Analysis For Efficient Sales Strategies Diagrams PDF. This layout presents information on Customer, Opportunities, Efficient Sales Strategies. It is also available for immediate download and adjustment. So, changes can be made in the color, design, graphics or any other component to create a unique layout.
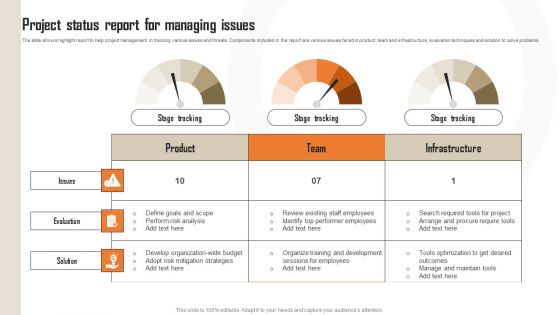
Project Status Report For Managing Issues Mockup PDF
The slide shows highlight report to help project management in tracking various issues and threats. Components included in the report are various issues faced in product, team and infrastructure, evaluation techniques and solution to solve problems. Showcasing this set of slides titled Project Status Report For Managing Issues Mockup PDF. The topics addressed in these templates are Issues, Evaluation, Solution. All the content presented in this PPT design is completely editable. Download it and make adjustments in color, background, font etc. as per your unique business setting.
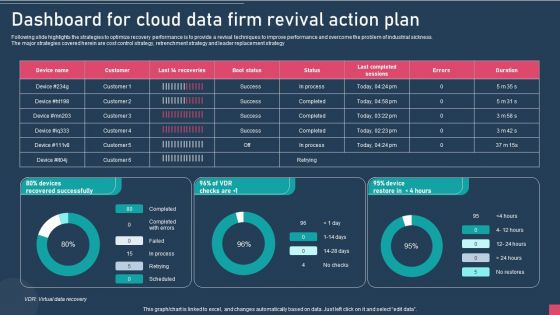
Dashboard For Cloud Data Firm Revival Action Plan Summary PDF
Following slide highlights the strategies to optimize recovery performance is to provide a revival techniques to improve performance and overcome the problem of industrial sickness. The major strategies covered herein are cost control strategy, retrenchment strategy and leader replacement strategy. Pitch your topic with ease and precision using this Dashboard For Cloud Data Firm Revival Action Plan Summary PDF. This layout presents information on Device, Success, Process. It is also available for immediate download and adjustment. So, changes can be made in the color, design, graphics or any other component to create a unique layout.
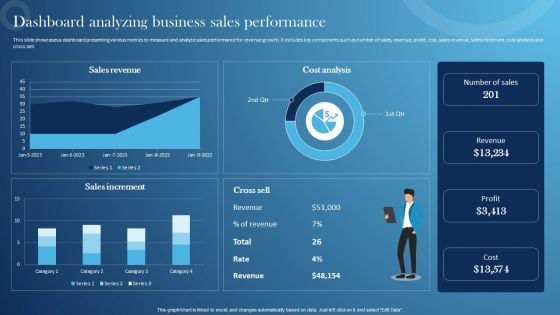
Inspecting Sales Optimization Areas Dashboard Analyzing Business Sales Performance Slides PDF
This slide showcases a dashboard presenting various metrics to measure and analyze sales performance for revenue growth. It includes key components such as number of sales, revenue, profit, cost, sales revenue, sales increment, cost analysis and cross sell. Create an editable Inspecting Sales Optimization Areas Dashboard Analyzing Business Sales Performance Slides PDF that communicates your idea and engages your audience. Whether youre presenting a business or an educational presentation, pre-designed presentation templates help save time. Inspecting Sales Optimization Areas Dashboard Analyzing Business Sales Performance Slides PDF is highly customizable and very easy to edit, covering many different styles from creative to business presentations. Slidegeeks has creative team members who have crafted amazing templates. So, go and get them without any delay.
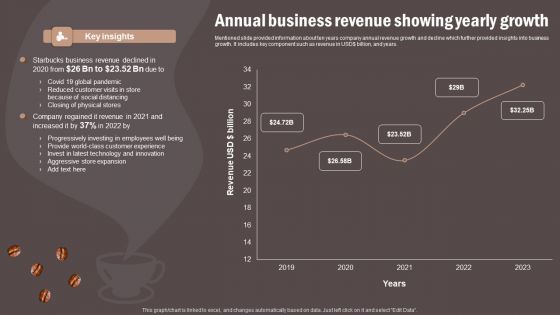
Coffee Cafe Company Profile Annual Business Revenue Showing Yearly Growth Sample PDF
Mentioned slide provided information about ten years company annual revenue growth and decline which further provided insights into business growth. It includes key component such as revenue in USD doller billion, and years. Create an editable Coffee Cafe Company Profile Annual Business Revenue Showing Yearly Growth Sample PDF that communicates your idea and engages your audience. Whether youre presenting a business or an educational presentation, pre designed presentation templates help save time. Coffee Cafe Company Profile Annual Business Revenue Showing Yearly Growth Sample PDF is highly customizable and very easy to edit, covering many different styles from creative to business presentations. Slidegeeks has creative team members who have crafted amazing templates. So, go and get them without any delay.
Bar Graph Showing Income Of Business Segments Ppt PowerPoint Presentation Icon Example PDF
Pitch your topic with ease and precision using this bar graph showing income of business segments ppt powerpoint presentation icon example pdf. This layout presents information on bar graph showing income of business segments. It is also available for immediate download and adjustment. So, changes can be made in the color, design, graphics or any other component to create a unique layout.
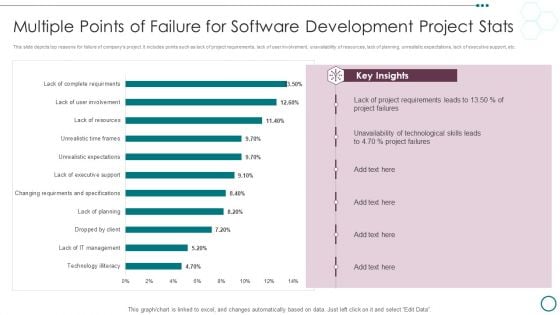
Multiple Points Of Failure For Software Development Project Stats Ppt PowerPoint Presentation Infographics Slides PDF
This slide depicts top reasons for failure of companys project. It includes points such as lack of project requirements, lack of user involvement, unavailability of resources, lack of planning, unrealistic expectations, lack of executive support, etc.Pitch your topic with ease and precision using this Multiple Points Of Failure For Software Development Project Stats Ppt PowerPoint Presentation Infographics Slides PDF. This layout presents information on Project Requirements, Unavailability Technological, Project Failures. It is also available for immediate download and adjustment. So, changes can be made in the color, design, graphics or any other component to create a unique layout.
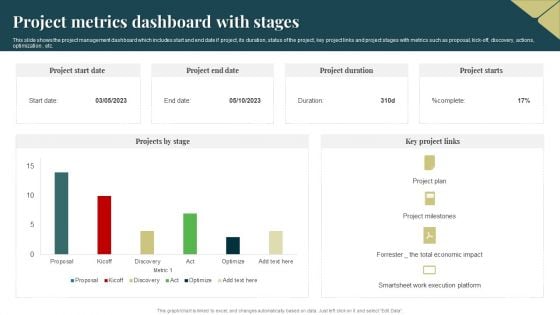
Project Metrics Dashboard With Stages Download PDF
This slide shows the project management dashboard which includes start and end date if project, its duration, status of the project, key project links and project stages with metrics such as proposal, kick off, discovery, actions, optimization , etc. Pitch your topic with ease and precision using this Project Metrics Dashboard With Stages Download PDF. This layout presents information on Economic, Project Plan, Execution. It is also available for immediate download and adjustment. So, changes can be made in the color, design, graphics or any other component to create a unique layout.
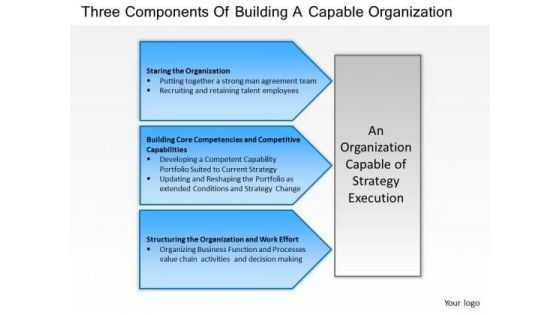
Business Diagram Three Components Of Building A Capable Organization PowerPoint Ppt Presentation
Our Business Diagram Three Components Of Building A Capable Organization PowerPoint PPT Presentation Powerpoint Templates And Your Ideas Make A Great Doubles Pair. Play The Net With Assured Hands.
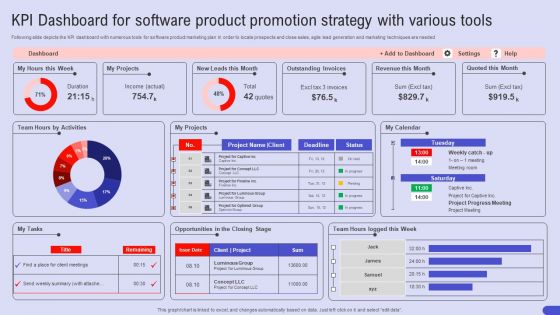
KPI Dashboard For Software Product Promotion Strategy With Various Tools Portrait PDF
Following slide depicts the KPI dashboard with numerous tools for software product marketing plan In order to locate prospects and close sales, agile lead generation and marketing techniques are needed. Pitch your topic with ease and precision using this KPI Dashboard For Software Product Promotion Strategy With Various Tools Portrait PDF. This layout presents information on KPI Dashboard, Software Product Promotion, Strategy With Various Tools. It is also available for immediate download and adjustment. So, changes can be made in the color, design, graphics or any other component to create a unique layout.
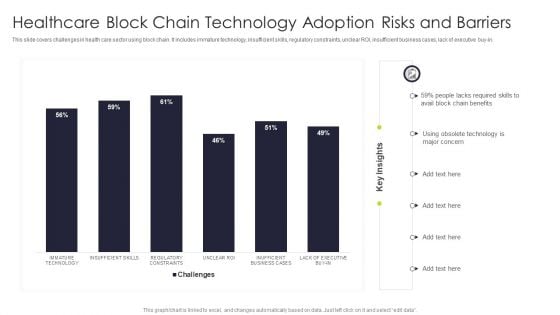
Healthcare Block Chain Technology Adoption Risks And Barriers Portrait PDF
This slide covers challenges in health care sector using block chain. It includes immature technology, insufficient skills, regulatory constraints, unclear ROI, insufficient business cases, lack of executive buy in. Pitch your topic with ease and precision using this Healthcare Block Chain Technology Adoption Risks And Barriers Portrait PDF This layout presents information on Immature Technology, Insufficient Skills, Regulatory Constraints It is also available for immediate download and adjustment. So, changes can be made in the color, design, graphics or any other component to create a unique layout.
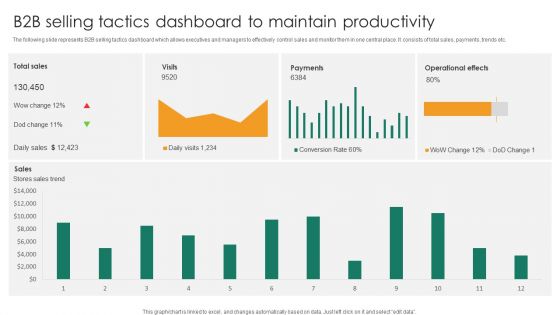
B2b Selling Tactics Dashboard To Maintain Productivity Introduction PDF
The following slide represents B2B selling tactics dashboard which allows executives and managers to effectively control sales and monitor them in one central place. It consists of total sales, payments, trends etc.Pitch your topic with ease and precision using this B2b Selling Tactics Dashboard To Maintain Productivity Introduction PDF. This layout presents information on Operational Effects, Stores Sales Trend, Conversion Rate. It is also available for immediate download and adjustment. So, changes can be made in the color, design, graphics or any other component to create a unique layout.
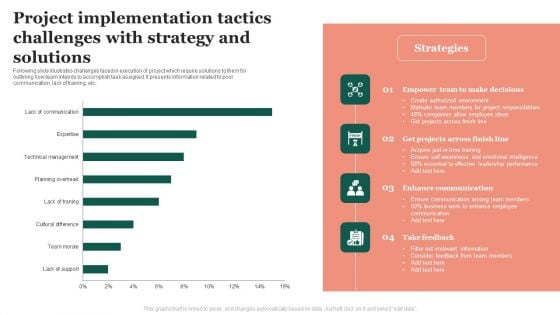
Project Implementation Tactics Challenges With Strategy And Solutions Microsoft PDF
Following slide illustrates challenges faced in execution of project which require solutions to them for outlining how team intends to accomplish task assigned. It presents information related to poor communication, lack of training, etc. Pitch your topic with ease and precision using this Project Implementation Tactics Challenges With Strategy And Solutions Microsoft PDF. This layout presents information on Enhance Communication, Empower Team, Leadership Performance. It is also available for immediate download and adjustment. So, changes can be made in the color, design, graphics or any other component to create a unique layout.
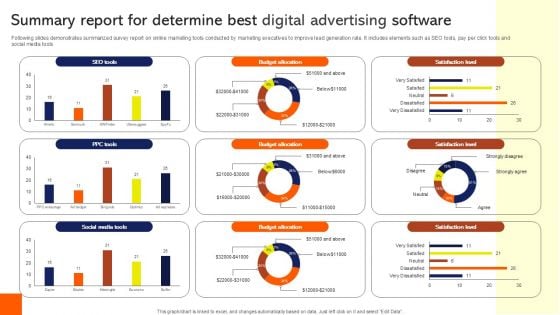
Summary Report For Determine Best Digital Advertising Software Survey SS
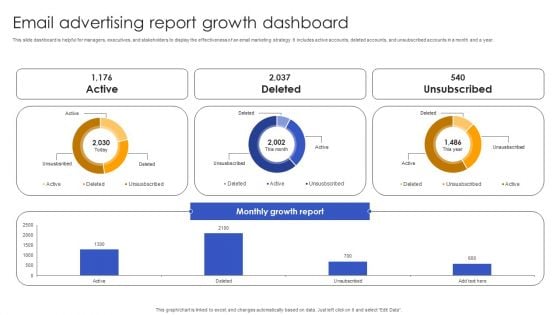
Email Advertising Report Growth Dashboard Formats PDF
This slide dashboard is helpful for managers, executives, and stakeholders to display the effectiveness of an email marketing strategy. It includes active accounts, deleted accounts, and unsubscribed accounts in a month and a year. Pitch your topic with ease and precision using this Email Advertising Report Growth Dashboard Formats PDF. This layout presents information on Email Advertising, Report Growth Dashboard . It is also available for immediate download and adjustment. So, changes can be made in the color, design, graphics or any other component to create a unique layout.
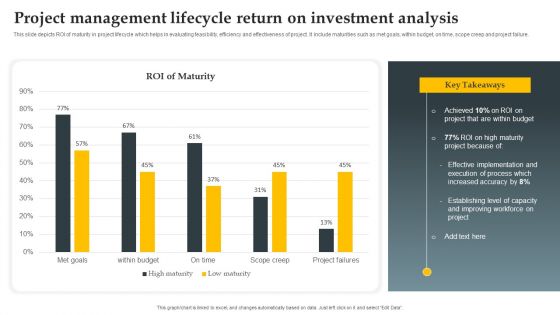
Project Management Lifecycle Return On Investment Analysis Demonstration PDF
This slide depicts ROI of maturity in project lifecycle which helps in evaluating feasibility, efficiency and effectiveness of project. It include maturities such as met goals, within budget, on time, scope creep and project failure. Pitch your topic with ease and precision using this Project Management Lifecycle Return On Investment Analysis Demonstration PDF. This layout presents information on Implementation, Execution Of Process, Budget. It is also available for immediate download and adjustment. So, changes can be made in the color, design, graphics or any other component to create a unique layout.
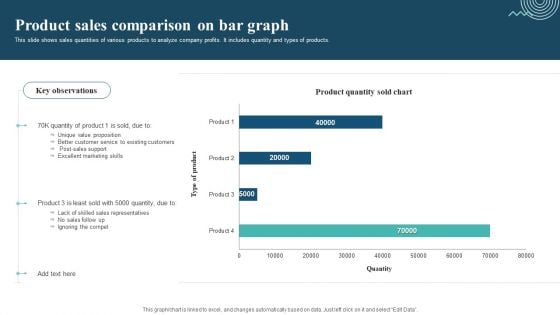
Product Sales Comparison On Bar Graph Sample PDF
This slide shows sales quantities of various products to analyze company profits. It includes quantity and types of products. Pitch your topic with ease and precision using this Product Sales Comparison On Bar Graph Sample PDF. This layout presents information on Unique Value Proposition, Excellent Marketing Skills, Ignoring The Compet. It is also available for immediate download and adjustment. So, changes can be made in the color, design, graphics or any other component to create a unique layout.
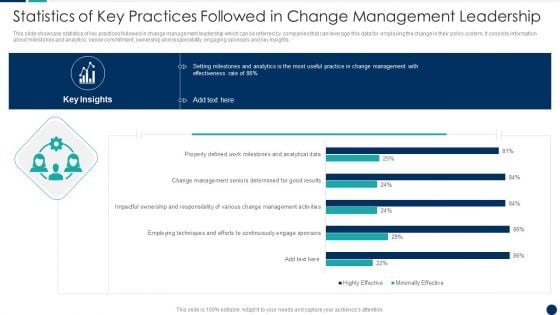
Statistics Of Key Practices Followed In Change Management Leadership Ideas PDF
This slide showcase statistics of key practices followed in change management leadership which can be referred by companies that can leverage this data for employing the change in their policy system. It consists information about milestones and analytics, senior commitment, ownership and responsibility, engaging sponsors and key insights.Pitch your topic with ease and precision using this Statistics Of Key Practices Followed In Change Management Leadership Ideas PDF This layout presents information on Employing Techniques, Efforts Continuously, Engage Sponsors It is also available for immediate download and adjustment. So, changes can be made in the color, design, graphics or any other component to create a unique layout.
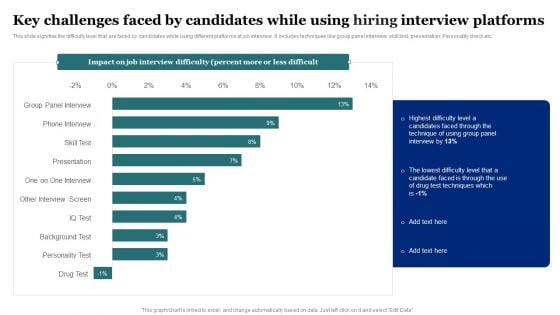
Key Challenges Faced By Candidates While Using Hiring Interview Platforms Rules PDF
This slide signifies the difficulty level that are faced by candidates while using different platforms at job interview. It includes techniques like group panel interview, skill test, presentation, Personality check etc. Pitch your topic with ease and precision using this Key Challenges Faced By Candidates While Using Hiring Interview Platforms Rules PDF. This layout presents information on Group Panel Interview, Phone Interview, Skill Test, Presentation. It is also available for immediate download and adjustment. So, changes can be made in the color, design, graphics or any other component to create a unique layout.
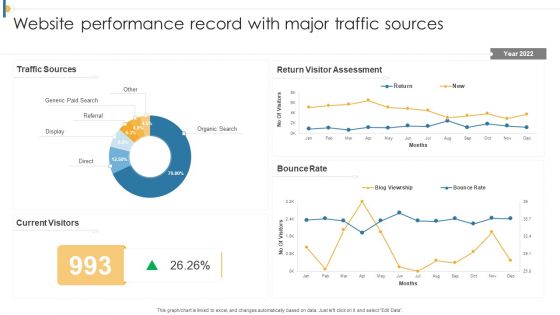
Website Performance Record With Major Traffic Sources Clipart PDF
Pitch your topic with ease and precision using this Website Performance Record With Major Traffic Sources Clipart PDF. This layout presents information on Website Performance Record, Major Traffic Sources. It is also available for immediate download and adjustment. So, changes can be made in the color, design, graphics or any other component to create a unique layout.
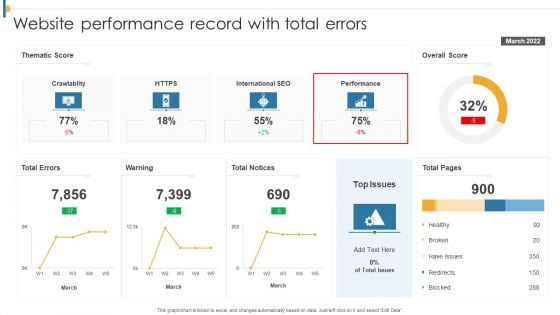
Website Performance Record With Total Errors Rules PDF
Pitch your topic with ease and precision using this Website Performance Record With Total Errors Rules PDF. This layout presents information on Record With Total Errors, Website Performance. It is also available for immediate download and adjustment. So, changes can be made in the color, design, graphics or any other component to create a unique layout.
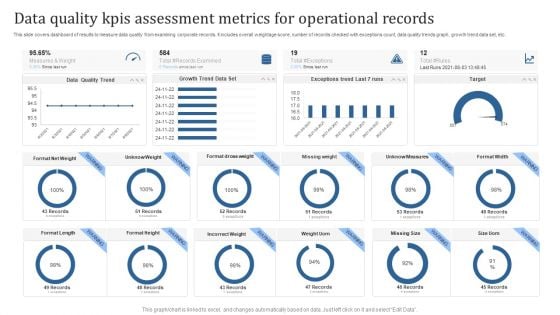
Data Quality Kpis Assessment Metrics For Operational Records Sample PDF
Pitch your topic with ease and precision using this Data Quality Kpis Assessment Metrics For Operational Records Sample PDF. This layout presents information on Data Quality, Assessment Metrics, Operational Records. It is also available for immediate download and adjustment. So, changes can be made in the color, design, graphics or any other component to create a unique layout.
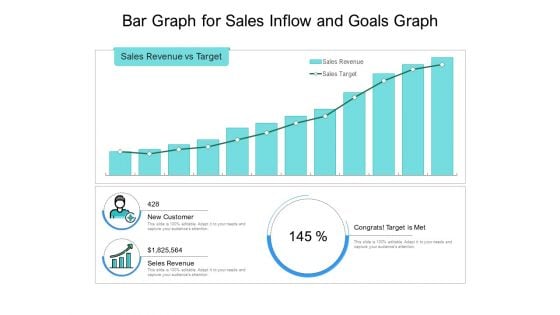
Bar Graph For Sales Inflow And Goals Graph Ppt PowerPoint Presentation Infographics Visual Aids PDF
Pitch your topic with ease and precision using this bar graph for sales inflow and goals graph ppt powerpoint presentation infographics visual aids pdf. This layout presents information on sales revenue vs target, new customer, congrats target is met. It is also available for immediate download and adjustment. So, changes can be made in the color, design, graphics or any other component to create a unique layout.
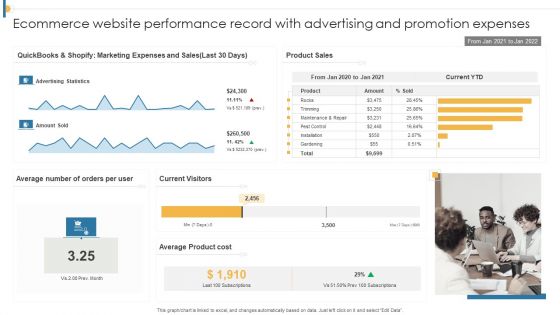
Ecommerce Website Performance Record With Advertising And Promotion Expenses Elements PDF
Pitch your topic with ease and precision using this Ecommerce Website Performance Record With Advertising And Promotion Expenses Elements PDF. This layout presents information on Ecommerce Website Performance Record, Advertising And Promotion Expenses. It is also available for immediate download and adjustment. So, changes can be made in the color, design, graphics or any other component to create a unique layout.

Stages Of Growth Ppt PowerPoint Presentation Complete Deck With Slides
Boost your confidence and team morale with this well-structured Stages Of Growth Ppt PowerPoint Presentation Complete Deck With Slides. This prefabricated set gives a voice to your presentation because of its well-researched content and graphics. Our experts have added all the components very carefully, thus helping you deliver great presentations with a single click. Not only that, it contains a set of seventeen slides that are designed using the right visuals, graphics, etc. Various topics can be discussed, and effective brainstorming sessions can be conducted using the wide variety of slides added in this complete deck. Apart from this, our PPT design contains clear instructions to help you restructure your presentations and create multiple variations. The color, format, design anything can be modified as deemed fit by the user. Not only this, it is available for immediate download. So, grab it now.
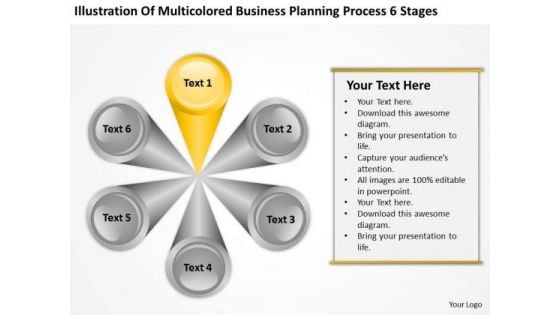
Business Planning Process 6 Stages Consulting Template PowerPoint Templates
We present our business planning process 6 stages consulting template PowerPoint templates.Present our Circle Charts PowerPoint Templates because Our PowerPoint Templates and Slides will provide you a launch platform. Give a lift off to your ideas and send them into orbit. Download and present our Shapes PowerPoint Templates because They will bring a lot to the table. Their alluring flavours will make your audience salivate. Use our Business PowerPoint Templates because Our PowerPoint Templates and Slides will steer your racing mind. Hit the right buttons and spur on your audience. Download our Signs PowerPoint Templates because Our PowerPoint Templates and Slides will let Your superior ideas hit the target always and everytime. Use our Curves and Lines PowerPoint Templates because you should once Tap the ingenuity of our PowerPoint Templates and Slides. They are programmed to succeed.Use these PowerPoint slides for presentations relating to diagram, model, business, chart, processes, sales, components, concept, vector, selling, distribution, marketing, abstract, management, illustration, icon, strategy, activities, executive, design, procedure, organization, advertising, conceptual, resource, promotion, editable. The prominent colors used in the PowerPoint template are Yellow, Gray, White. Be an eyeopener with our Business Planning Process 6 Stages Consulting Template PowerPoint Templates. Educate your audience on the decisive details.
Mobile User Interface Issue Tracker Dashboard In Information Technology Ideas PDF
This slide shows mobile user interface issue tracker dashboard in information technology which can be referred by software engineers to rectify smartphone issues. It contains information about project, component, generated vs. completed issues, issue by status, issue count by project and component and incomplete issues. Pitch your topic with ease and precision using this Mobile User Interface Issue Tracker Dashboard In Information Technology Ideas PDF. This layout presents information on Issues Count By, Project And Components, Incomplete Issues By, Priority And Project. It is also available for immediate download and adjustment. So, changes can be made in the color, design, graphics or any other component to create a unique layout.
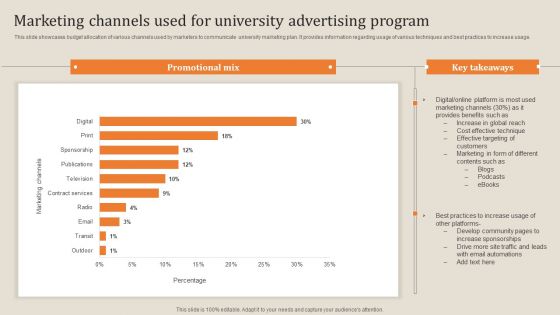
Marketing Channels Used For University Advertising Program Information PDF
This slide showcases budget allocation of various channels used by marketers to communicate university marketing plan. It provides information regarding usage of various techniques and best practices to increase usage. Showcasing this set of slides titled Marketing Channels Used For University Advertising Program Information PDF. The topics addressed in these templates are Digital, Online Platform, Blogs, Podcasts. All the content presented in this PPT design is completely editable. Download it and make adjustments in color, background, font etc. as per your unique business setting.
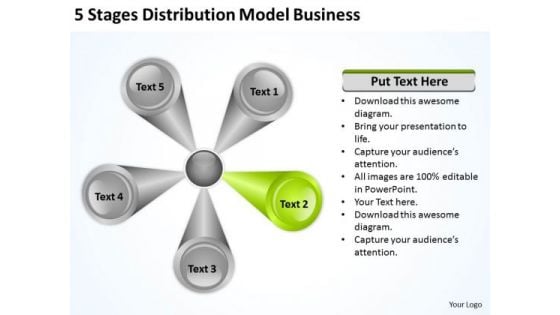
5 Stages Distribution Model Business Plan PowerPoint Templates
We present our 5 stages distribution model business plan PowerPoint templates.Use our Circle Charts PowerPoint Templates because Our PowerPoint Templates and Slides help you pinpoint your timelines. Highlight the reasons for your deadlines with their use. Download and present our Shapes PowerPoint Templates because Our PowerPoint Templates and Slides are a sure bet. Gauranteed to win against all odds. Download our Business PowerPoint Templates because Our PowerPoint Templates and Slides are a sure bet. Gauranteed to win against all odds. Download and present our Signs PowerPoint Templates because Our PowerPoint Templates and Slides have the Brilliant backdrops. Guaranteed to illuminate the minds of your audience. Download and present our Curves and Lines PowerPoint Templates because Our PowerPoint Templates and Slides are truly out of this world. Even the MIB duo has been keeping tabs on our team.Use these PowerPoint slides for presentations relating to diagram, model, business, chart, processes, sales, components, concept, vector, selling, distribution, marketing, abstract, management, illustration, icon, strategy, activities, executive, design, procedure, organization, advertising, conceptual, resource, promotion, editable. The prominent colors used in the PowerPoint template are Green lime, Gray, White. Analyse the evidence accurately with our 5 Stages Distribution Model Business Plan PowerPoint Templates. Steer your audience away from fallacy.
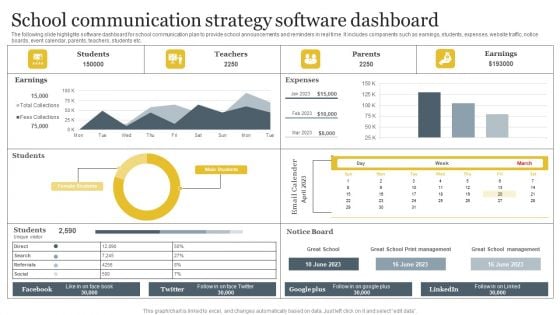
School Communication Strategy Software Dashboard Template PDF
The following slide highlights software dashboard for school communication plan to provide school announcements and reminders in real time. It includes components such as earnings, students, expenses, website traffic, notice boards, event calendar, parents, teachers, students etc. Pitch your topic with ease and precision using this School Communication Strategy Software Dashboard Template PDF. This layout presents information on Earnings, Students, Teachers, Parents. It is also available for immediate download and adjustment. So, changes can be made in the color, design, graphics or any other component to create a unique layout.
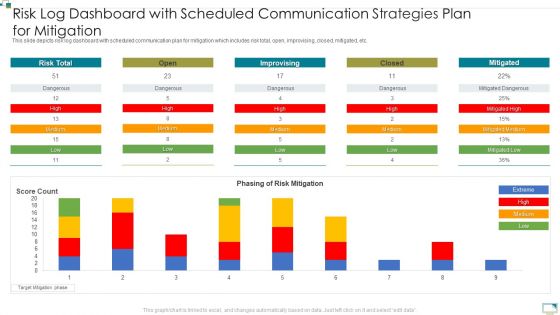
Risk Log Dashboard With Scheduled Communication Strategies Plan For Mitigation Brochure PDF
This slide depicts risk log dashboard with scheduled communication plan for mitigation which includes risk total, open, improvising, closed, mitigated, etc. Pitch your topic with ease and precision using this Risk Log Dashboard With Scheduled Communication Strategies Plan For Mitigation Brochure PDF. This layout presents information on Risk Total, Phasing, Risk Mitigation. It is also available for immediate download and adjustment. So, changes can be made in the color, design, graphics or any other component to create a unique layout.

Customer Relationship Management Lifecycle Analytics Dashboard With Sales Record Brochure PDF
This slide signifies the customer relationship management analytics dashboard. It covers information about sales record by different representative, total products sold, sales by different month, etc.Pitch your topic with ease and precision using this Customer Relationship Management Lifecycle Analytics Dashboard With Sales Record Brochure PDF. This layout presents information on Sales Record, Representative, Total Items. It is also available for immediate download and adjustment. So, changes can be made in the color, design, graphics or any other component to create a unique layout.

Business Revenue Bar Graph With Business Operational Expenditure Details Summary PDF
This slide represents business revenue bar graph with OPEX details which can be referred by companies to earn more revenue by controlling expenditures. It also provides information about marketing and sales, research and development, administration, total revenue, etc. Pitch your topic with ease and precision using this Business Revenue Bar Graph With Business Operational Expenditure Details Summary PDF. This layout presents information on Cost Of Marketing, Sales, Highest Amount. It is also available for immediate download and adjustment. So, changes can be made in the color, design, graphics or any other component to create a unique layout.
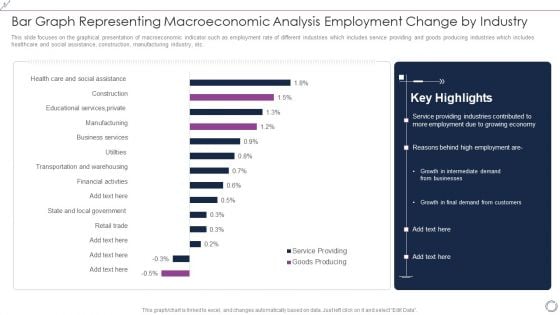
Bar Graph Representing Macroeconomic Analysis Employment Change By Industry Background PDF
This slide focuses on the graphical presentation of macroeconomic indicator such as employment rate of different industries which includes service providing and goods producing industries which includes healthcare and social assistance, construction, manufacturing industry, etc. Pitch your topic with ease and precision using this Bar Graph Representing Macroeconomic Analysis Employment Change By Industry Background PDF. This layout presents information on Goods Producing, Service Providing, Financial, Business. It is also available for immediate download and adjustment. So, changes can be made in the color, design, graphics or any other component to create a unique layout.
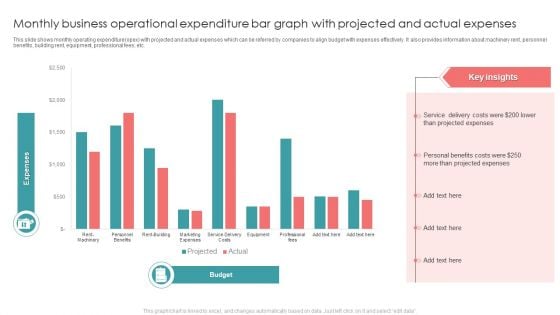
Monthly Business Operational Expenditure Bar Graph With Projected And Actual Expenses Introduction PDF
This slide shows monthly operating expenditure opex with projected and actual expenses which can be referred by companies to align budget with expenses effectively. It also provides information about machinery rent, personnel benefits, building rent, equipment, professional fees, etc. Pitch your topic with ease and precision using this Monthly Business Operational Expenditure Bar Graph With Projected And Actual Expenses Introduction PDF. This layout presents information on Projected Expenses, Costs, Service. It is also available for immediate download and adjustment. So, changes can be made in the color, design, graphics or any other component to create a unique layout.
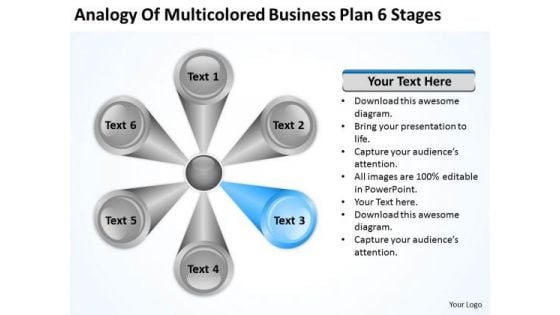
Business PowerPoint Presentations Plan 6 Stages Slides
We present our business powerpoint presentations plan 6 stages Slides.Present our Circle Charts PowerPoint Templates because Our PowerPoint Templates and Slides are conceived by a dedicated team. Use them and give form to your wondrous ideas. Download and present our Shapes PowerPoint Templates because Watching this your Audience will Grab their eyeballs, they wont even blink. Use our Business PowerPoint Templates because You have the co-ordinates for your destination of success. Let our PowerPoint Templates and Slides map out your journey. Download our Signs PowerPoint Templates because You can Stir your ideas in the cauldron of our PowerPoint Templates and Slides. Cast a magic spell on your audience. Download our Curves and Lines PowerPoint Templates because It can Bubble and burst with your ideas.Use these PowerPoint slides for presentations relating to diagram, model, business, chart, processes, sales, components, concept, vector, selling, distribution, marketing, abstract, management, illustration, icon, strategy, activities, executive, design, procedure, organization, advertising, conceptual, resource, promotion, editable. The prominent colors used in the PowerPoint template are Blue, Gray, White. Plan your field work with our Business PowerPoint Presentations Plan 6 Stages Slides. Let your team know what you expect.
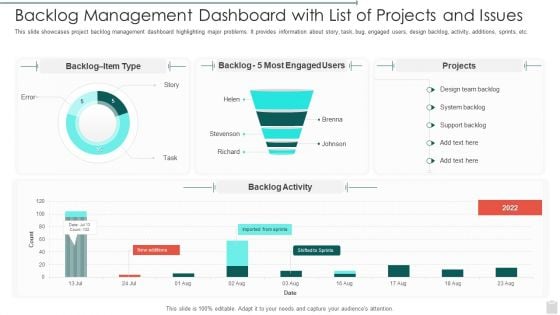
Backlog Management Dashboard With List Of Projects And Issues Template PDF
This slide showcases project backlog management dashboard highlighting major problems. It provides information about story, task, bug, engaged users, design backlog, activity, additions, sprints, etc. Pitch your topic with ease and precision using this Backlog Management Dashboard With List Of Projects And Issues Template PDF. This layout presents information on Backlog Management Dashboard With List Of Projects And Issues. It is also available for immediate download and adjustment. So, changes can be made in the color, design, graphics or any other component to create a unique layout.
Project Scheduling Tool Time Tracking Dashboard With Usage Details Brochure PDF
Pitch your topic with ease and precision using this project scheduling tool time tracking dashboard with usage details brochure pdf. This layout presents information on project scheduling tool time tracking dashboard with usage details. It is also available for immediate download and adjustment. So, changes can be made in the color, design, graphics or any other component to create a unique layout.
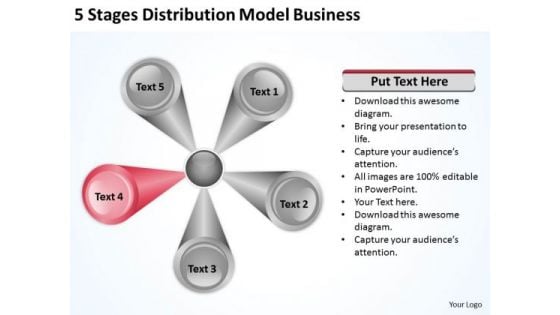
5 Stages Distribution Model Business Plan PowerPoint Slides
We present our 5 stages distribution model business plan PowerPoint Slides.Download our Circle Charts PowerPoint Templates because Our PowerPoint Templates and Slides are truly out of this world. Even the MIB duo has been keeping tabs on our team. Use our Shapes PowerPoint Templates because Our PowerPoint Templates and Slides will Embellish your thoughts. They will help you illustrate the brilliance of your ideas. Present our Business PowerPoint Templates because Our PowerPoint Templates and Slides will let you Illuminate the road ahead to Pinpoint the important landmarks along the way. Download our Signs PowerPoint Templates because You can Flag mark the road ahead with our PowerPoint Templates and Slides. They will unfurl your brilliant plans to your audience. Download our Curves and Lines PowerPoint Templates because our PowerPoint Templates and Slides will give your ideas the shape.Use these PowerPoint slides for presentations relating to diagram, model, business, chart, processes, sales, components, concept, vector, selling, distribution, marketing, abstract, management, illustration, icon, strategy, activities, executive, design, procedure, organization, advertising, conceptual, resource, promotion, editable. The prominent colors used in the PowerPoint template are Red, Gray, White. Get them to applaud you with our 5 Stages Distribution Model Business Plan PowerPoint Slides. You will come out on top.
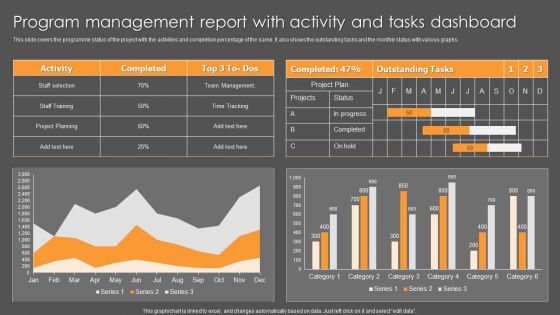
Program Management Report With Activity And Tasks Dashboard Ppt File Objects PDF
This slide covers the programme status of the project with the activities and completion percentage of the same. It also shows the outstanding tasks and the monthly status with various graphs. Pitch your topic with ease and precision using this Program Management Report With Activity And Tasks Dashboard Ppt File Objects PDF. This layout presents information on Activity, Team Management, Time Tracking. It is also available for immediate download and adjustment. So, changes can be made in the color, design, graphics or any other component to create a unique layout.
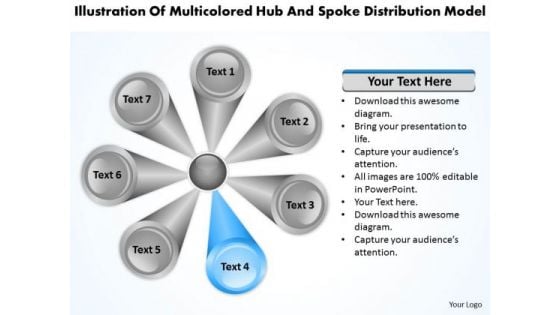
And Spoke Distribution Model 7 Stages How To Write Small Business Plan PowerPoint Slides
We present our and spoke distribution model 7 stages how to write small business plan PowerPoint Slides.Download and present our Circle Charts PowerPoint Templates because Our PowerPoint Templates and Slides will embellish your thoughts. See them provide the desired motivation to your team. Download our Shapes PowerPoint Templates because You should Bet on your luck with our PowerPoint Templates and Slides. Be assured that you will hit the jackpot. Download and present our Business PowerPoint Templates because Our PowerPoint Templates and Slides are a sure bet. Gauranteed to win against all odds. Use our Signs PowerPoint Templates because Our PowerPoint Templates and Slides will let you Hit the target. Go the full distance with ease and elan. Use our Curves and Lines PowerPoint Templates because Our PowerPoint Templates and Slides are created by a hardworking bunch of busybees. Always flitting around with solutions gauranteed to please.Use these PowerPoint slides for presentations relating to diagram, model, business, chart, processes, sales, components, concept, vector, selling, distribution, marketing, abstract, management, illustration, icon, strategy, activities, executive, design, procedure, organization, advertising, conceptual, resource, promotion, editable. The prominent colors used in the PowerPoint template are Blue, Gray, White. You are known to be erudite. Share your learning with our And Spoke Distribution Model 7 Stages How To Write Small Business Plan PowerPoint Slides.
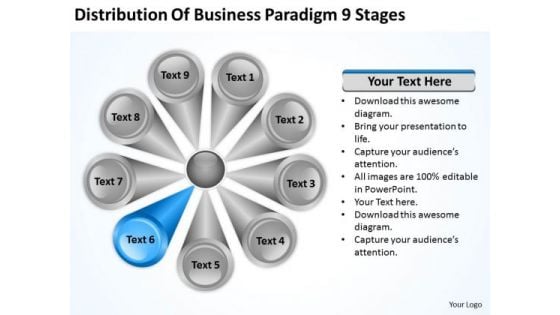
Business PowerPoint Presentation Paradigm 9 Stages Ppt 6 Plans Samples Slides
We present our business powerpoint presentation paradigm 9 stages ppt 6 plans samples Slides.Use our Circle Charts PowerPoint Templates because You can Rise to the occasion with our PowerPoint Templates and Slides. You will bring your audience on their feet in no time. Download and present our Shapes PowerPoint Templates because Our PowerPoint Templates and Slides will let your words and thoughts hit bullseye everytime. Download and present our Business PowerPoint Templates because Our PowerPoint Templates and Slides will let you Leave a lasting impression to your audiences. They possess an inherent longstanding recall factor. Download our Signs PowerPoint Templates because Our PowerPoint Templates and Slides will let your ideas bloom. Create a bed of roses for your audience. Present our Curves and Lines PowerPoint Templates because You can safely bank on our PowerPoint Templates and Slides. They will provide a growth factor to your valuable thoughts.Use these PowerPoint slides for presentations relating to diagram, model, business, chart, processes, sales, components, concept, vector, selling, distribution, marketing, abstract, management, illustration, icon, strategy, activities, executive, design, procedure, organization, advertising, conceptual, resource, promotion, editable. The prominent colors used in the PowerPoint template are Blue, Gray, White. Our Business PowerPoint Presentation Paradigm 9 Stages Ppt 6 Plans Samples Slides empower educators. Conveying concepts and ideas becomes easier.
Business Project Problems Management Plan With Impact And Status Ppt PowerPoint Presentation Icon Diagrams PDF
Pitch your topic with ease and precision using this business project problems management plan with impact and status ppt powerpoint presentation icon diagrams pdf. This layout presents information on project manager, supplies late, progress. It is also available for immediate download and adjustment. So, changes can be made in the color, design, graphics or any other component to create a unique layout.
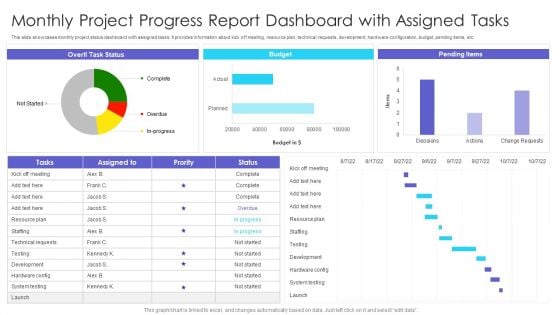
Monthly Project Progress Report Dashboard With Assigned Tasks Ppt Styles Clipart PDF
This slide showcases monthly project status dashboard with assigned tasks. It provides information about kick off meeting, resource plan, technical requests, development, hardware configuration, budget, pending items, etc. Pitch your topic with ease and precision using this Monthly Project Progress Report Dashboard With Assigned Tasks Ppt Styles Clipart PDF. This layout presents information on Pending Items, Budget, Kick Off Meeting. It is also available for immediate download and adjustment. So, changes can be made in the color, design, graphics or any other component to create a unique layout.
Software Development Icon With Industrial Engineering Metrics Themes PDF
Pitch your topic with ease and precision using this Software Development Icon With Industrial Engineering Metrics Themes PDF. This layout presents information on Software Development, Industrial Engineering, Metrics. It is also available for immediate download and adjustment. So, changes can be made in the color, design, graphics or any other component to create a unique layout.
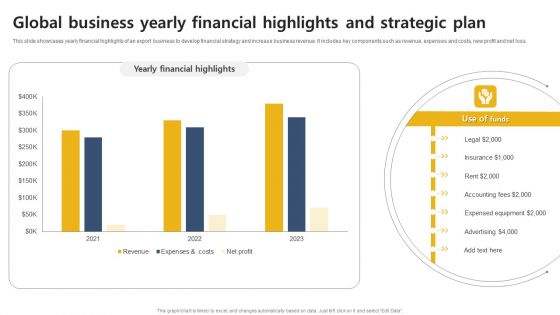
Global Business Yearly Financial Highlights And Strategic Plan Themes PDF
This slide highlights statistical presentation of import export business to quarterly evaluate balance of trade. It includes key components such as export, import, quarterly trends and balance of trade. Pitch your topic with ease and precision using this Global Business Yearly Financial Highlights And Strategic Plan Themes PDF. This layout presents information on Global Business, Yearly Financial Highlights, Strategic Plan. It is also available for immediate download and adjustment. So, changes can be made in the color, design, graphics or any other component to create a unique layout.
International High Performance Statistical Analysis Market Ppt PowerPoint Presentation Icon Template PDF
Pitch your topic with ease and precision using this international high performance statistical analysis market ppt powerpoint presentation icon template pdf. This layout presents information on historic analysis, forecast, customization, dollar in billions, 2014 to 2023. It is also available for immediate download and adjustment. So, changes can be made in the color, design, graphics or any other component to create a unique layout.
Dashboard Of A Car Vehicle Ppt PowerPoint Presentation Icon Infographic Template PDF
Pitch your topic with ease and precision using this dashboard of a car vehicle ppt powerpoint presentation icon infographic template pdf. This layout presents information on dashboard of a car vehicle. It is also available for immediate download and adjustment. So, changes can be made in the color, design, graphics or any other component to create a unique layout.

Online Promotion Plan Dashboard With Total Traffic Visit Ppt Infographic Template Display PDF
Pitch your topic with ease and precision using this online promotion plan dashboard with total traffic visit ppt infographic template display pdf. This layout presents information on engagement, promotion, product. It is also available for immediate download and adjustment. So, changes can be made in the color, design, graphics or any other component to create a unique layout.
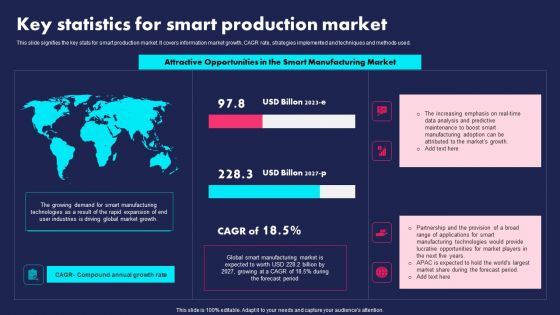
Key Statistics For Smart Production Market Ppt PowerPoint Presentation File Inspiration PDF
This slide signifies the key stats for smart production market. It covers information market growth, CAGR rate, strategies implemented and techniques and methods used. Showcasing this set of slides titled Key Statistics For Smart Production Market Ppt PowerPoint Presentation File Inspiration PDF. The topics addressed in these templates are Attractive Opportunities, Smart Manufacturing Market, Global. All the content presented in this PPT design is completely editable. Download it and make adjustments in color, background, font etc. as per your unique business setting.
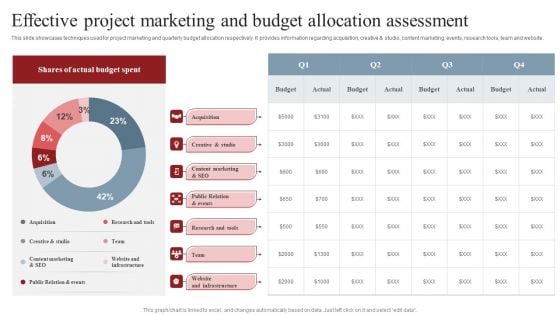
Effective Project Marketing And Budget Allocation Assessment Professional PDF
This slide showcases techniques used for project marketing and quarterly budget allocation respectively. It provides information regarding acquisition, creative and studio, content marketing, events, research tools, team and website. Showcasing this set of slides titled Effective Project Marketing And Budget Allocation Assessment Professional PDF. The topics addressed in these templates are Acquisition, Creative Studio, Research Tools. All the content presented in this PPT design is completely editable. Download it and make adjustments in color, background, font etc. as per your unique business setting.
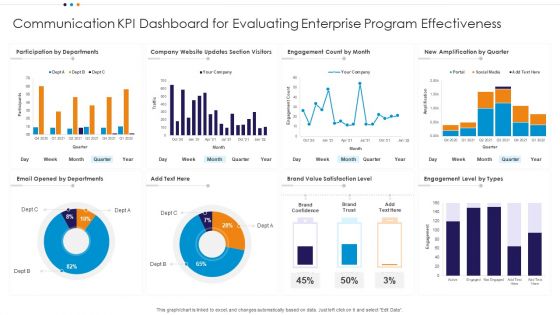
Communication KPI Dashboard For Evaluating Enterprise Program Effectiveness Demonstration PDF
Pitch your topic with ease and precision using this Communication KPI Dashboard For Evaluating Enterprise Program Effectiveness Demonstration PDF This layout presents information on Participation Departments, Company Section Visitors Engagement It is also available for immediate download and adjustment. So, changes can be made in the color, design, graphics or any other component to create a unique layout.


 Continue with Email

 Home
Home


