Hierarchy Chart Organizational
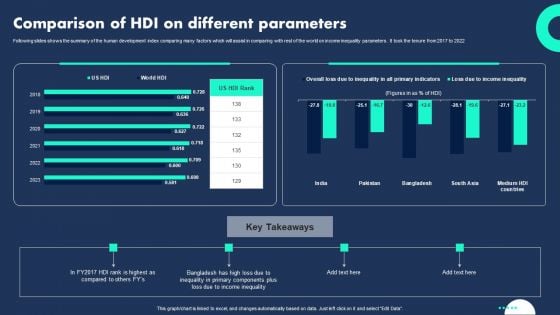
Comparison Of HDI On Different Parameters Diagrams PDF
Following slides shows the summary of the human development index comparing many factors which will assist in comparing with rest of the world on income inequality parameters . It took the tenure from 2017 to 2022. Showcasing this set of slides titled Comparison Of HDI On Different Parameters Diagrams PDF. The topics addressed in these templates are Inequality Primary Components, Plus Loss Income Inequality, Different Parameters . All the content presented in this PPT design is completely editable. Download it and make adjustments in color, background, font etc. as per your unique business setting.
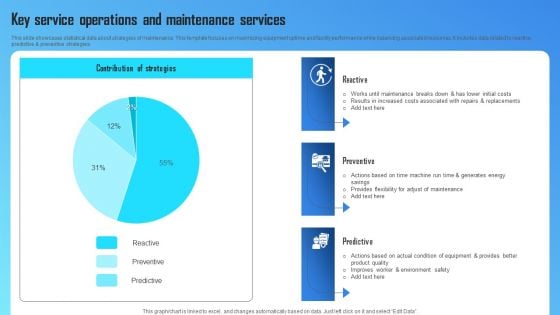
Key Service Operations And Maintenance Services Diagrams PDF
This slide showcases statistical data about strategies of maintenance. This template focuses on maximizing equipment uptime and facility performance while balancing associated resources. It includes data related to reactive, predictive and preventive strategies. Pitch your topic with ease and precision using this Key Service Operations And Maintenance Services Diagrams PDF. This layout presents information on Costs Associated, Environment Safety, Condition Of Equipment. It is also available for immediate download and adjustment. So, changes can be made in the color, design, graphics or any other component to create a unique layout.
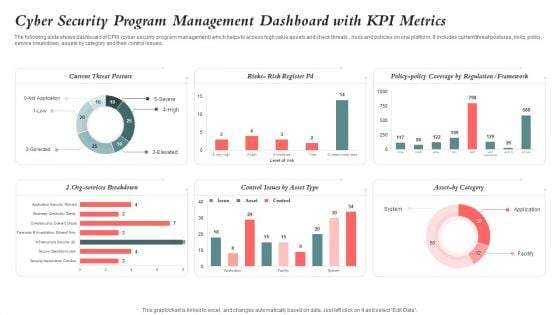
Cyber Security Program Management Dashboard With KPI Metrics Ideas PDF
The following slide shows dashboard of CPM cyber security program management which helps to access high value assets and check threats , risks and policies on one platform. It includes current threat postures, risks, policy, service breakdown, assets by category and their control issues. Pitch your topic with ease and precision using this Cyber Security Program Management Dashboard With KPI Metrics Ideas PDF. This layout presents information on Cyber Security, Program Management Dashboard, Kpi Metrics. It is also available for immediate download and adjustment. So, changes can be made in the color, design, graphics or any other component to create a unique layout.

HR Cost Budget For Training And Development Program Brochure PDF
This slide displays the training budget to improve individuals skills and competencies required to complete the job. Some of the training programs include employee induction, soft skills training, web based training, software training, etc. Pitch your topic with ease and precision using this HR Cost Budget For Training And Development Program Brochure PDF. This layout presents information on HR Cost Budget, Training And Development Program. It is also available for immediate download and adjustment. So, changes can be made in the color, design, graphics or any other component to create a unique layout.
Market Penetration Dashboard With Sales Metrics Ppt Icon Examples PDF
This slide shows market penetration dashboard for sales team. It provides information about regions, emerging markets, planned sales, actual sales, revenue, gender wise sales, etc. Pitch your topic with ease and precision using this Market Penetration Dashboard With Sales Metrics Ppt Icon Examples PDF. This layout presents information on Emerging Markets, Sales Gender, Actual Sales. It is also available for immediate download and adjustment. So, changes can be made in the color, design, graphics or any other component to create a unique layout.
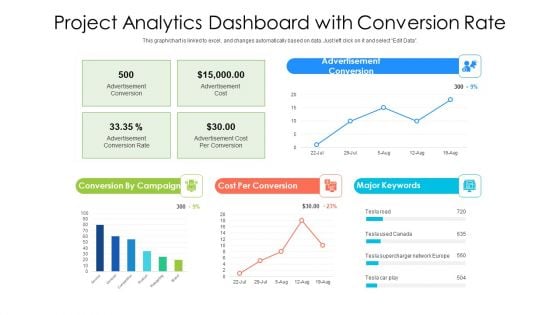
Project Analytics Dashboard With Conversion Rate Ppt PowerPoint Presentation File Deck PDF
Pitch your topic with ease and precision using this project analytics dashboard with conversion rate ppt powerpoint presentation gallery graphics template pdf. This layout presents information on cost per conversion, supercharger network, advertisement conversion, conversion by campaign. It is also available for immediate download and adjustment. So, changes can be made in the color, design, graphics or any other component to create a unique layout.
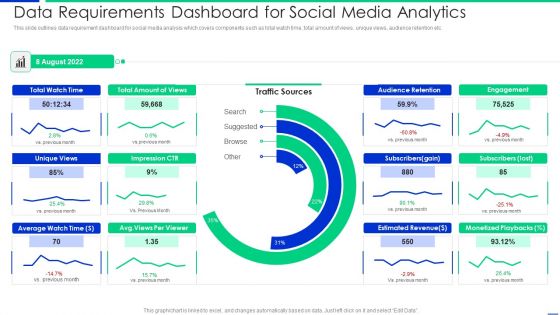
Data Requirements Dashboard For Social Media Analytics Professional PDF
This slide outlines data requirement dashboard for social media analysis which covers components such as total watch time, total amount of views, unique views, audience retention etc. Showcasing this set of slides titled data requirements dashboard for social media analytics professional pdf. The topics addressed in these templates are data requirements dashboard for social media analytics. All the content presented in this PPT design is completely editable. Download it and make adjustments in color, background, font etc. as per your unique business setting.
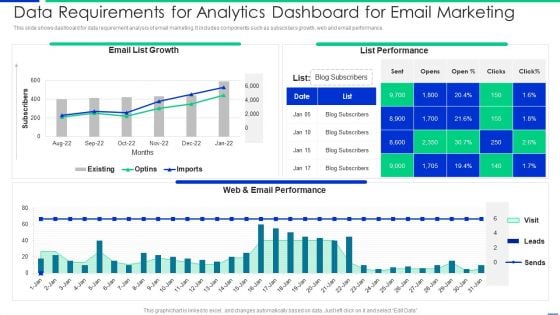
Data Requirements For Analytics Dashboard For Email Marketing Mockup PDF
This slide shows dashboard for data requirement analysis of email marketing. It includes components such as subscribers growth, web and email performance. Showcasing this set of slides titled data requirements for analytics dashboard for email marketing mockup pdf. The topics addressed in these templates are growth, performance. All the content presented in this PPT design is completely editable. Download it and make adjustments in color, background, font etc. as per your unique business setting.
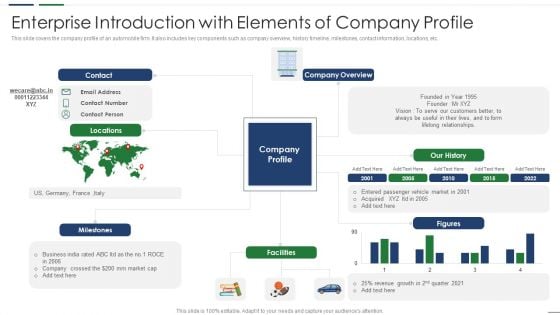
Enterprise Introduction With Elements Of Company Profile Portrait PDF
This slide covers the company profile of an automobile firm. It also includes key components such as company overview, history timeline, milestones, contact information, locations, etc. Showcasing this set of slides titled Enterprise Introduction With Elements Of Company Profile Portrait PDF. The topics addressed in these templates are Customers, Market, Revenue. All the content presented in this PPT design is completely editable. Download it and make adjustments in color, background, font etc. as per your unique business setting.
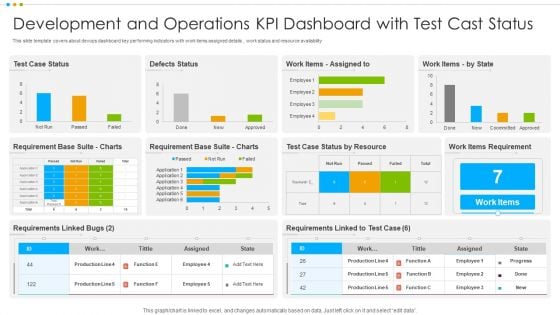
Development And Operations KPI Dashboard With Test Cast Status Graphics PDF
This slide template covers about devops dashboard key performing indicators with work items assigned details , work status and resource availability.Pitch your topic with ease and precision using this Development And Operations KPI Dashboard With Test Cast Status Graphics PDF This layout presents information on Items Requirement, Requirement Base, Assigned It is also available for immediate download and adjustment. So, changes can be made in the color, design, graphics or any other component to create a unique layout.
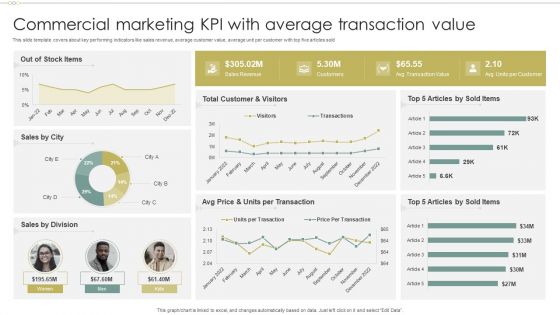
Commercial Marketing KPI With Average Transaction Value Formats PDF
This slide template covers about key performing indicators like sales revenue, average customer value, average unit per customer with top five articles sold. Pitch your topic with ease and precision using this Commercial Marketing KPI With Average Transaction Value Formats PDF. This layout presents information on Total Customer, Per Transaction, Transaction Value. It is also available for immediate download and adjustment. So, changes can be made in the color, design, graphics or any other component to create a unique layout.
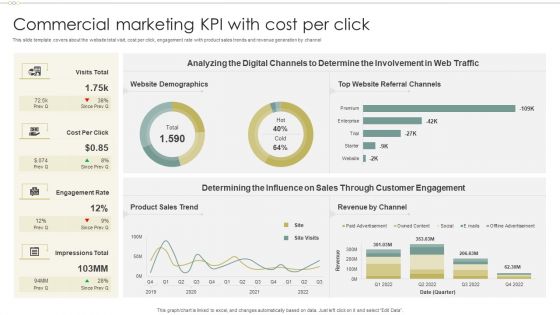
Commercial Marketing KPI With Cost Per Click Guidelines PDF
This slide template covers about the website total visit, cost per click, engagement rate with product sales trends and revenue generation by channel. Pitch your topic with ease and precision using this Commercial Marketing KPI With Cost Per Click Guidelines PDF. This layout presents information on Website Demographics, Referral Channels, Determining Influence. It is also available for immediate download and adjustment. So, changes can be made in the color, design, graphics or any other component to create a unique layout.
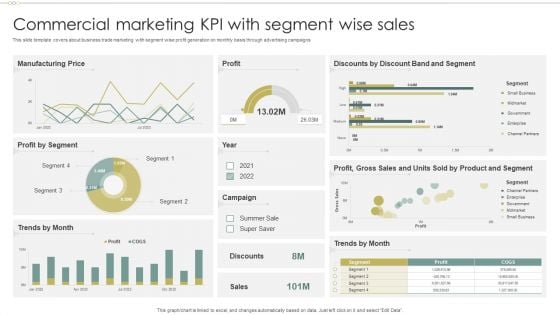
Commercial Marketing KPI With Segment Wise Sales Inspiration PDF
This slide template covers about business trade marketing with segment wise profit generation on monthly basis through advertising campaigns.Pitch your topic with ease and precision using this Commercial Marketing KPI With Segment Wise Sales Inspiration PDF. This layout presents information on Manufacturing Price, Campaign, Discounts Discount. It is also available for immediate download and adjustment. So, changes can be made in the color, design, graphics or any other component to create a unique layout.
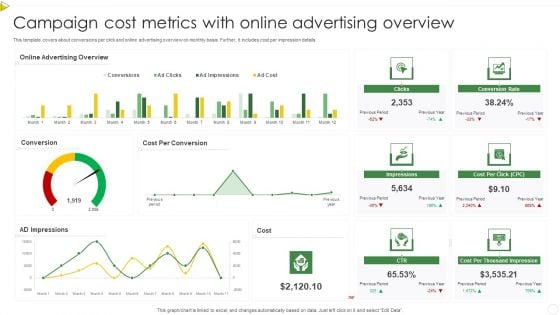
Campaign Cost Metrics With Online Advertising Overview Pictures PDF
This template covers about conversions per click and online advertising overview on monthly basis. Further, it includes cost per impression details. Pitch your topic with ease and precision using this Campaign Cost Metrics With Online Advertising Overview Pictures PDF. This layout presents information on Cost Per Conversion, Cost Per Click, Conversion Rate. It is also available for immediate download and adjustment. So, changes can be made in the color, design, graphics or any other component to create a unique layout.
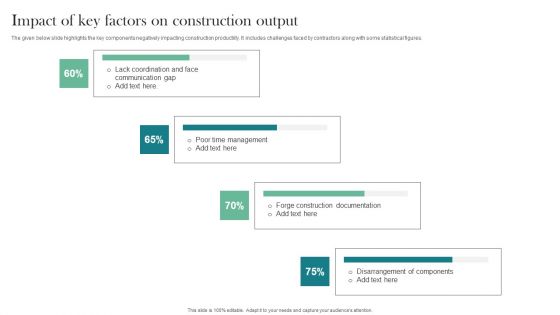
Impact Of Key Factors On Construction Output Download PDF
The given below slide highlights the key components negatively impacting construction productiity. It includes challenges faced by contractors along with some statistical figures. Showcasing this set of slides titled Impact Of Key Factors On Construction Output Download PDF. The topics addressed in these templates are Introduce Right Technology, Source Of Data, Integrate Team. All the content presented in this PPT design is completely editable. Download it and make adjustments in color, background, font etc. as per your unique business setting.
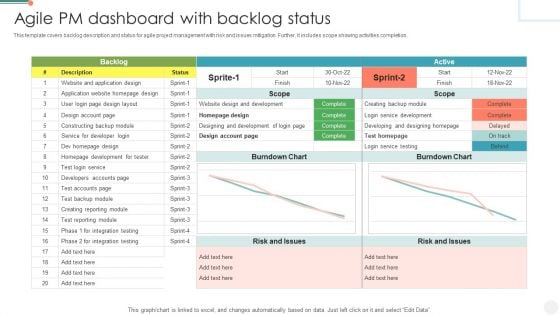
Agile PM Dashboard With Backlog Status Summary PDF
This template covers backlog description and status for agile project management with risk and issues mitigation. Further, it includes scope showing activities completion. Pitch your topic with ease and precision using this Agile PM Dashboard With Backlog Status Summary PDF. This layout presents information on Service For Developer Login, Risk And Issues, Service Development. It is also available for immediate download and adjustment. So, changes can be made in the color, design, graphics or any other component to create a unique layout.
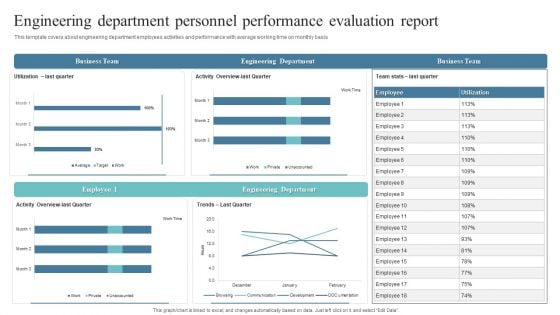
Engineering Department Personnel Performance Evaluation Report Formats PDF
This template covers about engineering department employees activities and performance with average working time on monthly basis. Pitch your topic with ease and precision using this Engineering Department Personnel Performance Evaluation Report Formats PDF. This layout presents information on Business Team, Engineering Department, Business Team. It is also available for immediate download and adjustment. So, changes can be made in the color, design, graphics or any other component to create a unique layout.

Personnel Performance Evaluation Report With Overall Labor Effectiveness Guidelines PDF
This template covers about employee performance report with absenteeism rate of workforce on yearly basis and department wise details.Pitch your topic with ease and precision using this Personnel Performance Evaluation Report With Overall Labor Effectiveness Guidelines PDF. This layout presents information on Average Absenteeism, Absenteeism Rate, Overall Labor Effectiveness. It is also available for immediate download and adjustment. So, changes can be made in the color, design, graphics or any other component to create a unique layout.
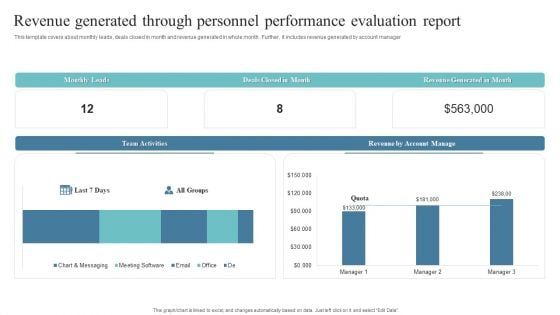
Revenue Generated Through Personnel Performance Evaluation Report Mockup PDF
This template covers about monthly leads, deals closed in month and revenue generated in whole month . Further, it includes revenue generated by account manager.Pitch your topic with ease and precision using this Revenue Generated Through Personnel Performance Evaluation Report Mockup PDF. This layout presents information on Monthly Lead, Team Activities, Account Manage. It is also available for immediate download and adjustment. So, changes can be made in the color, design, graphics or any other component to create a unique layout.
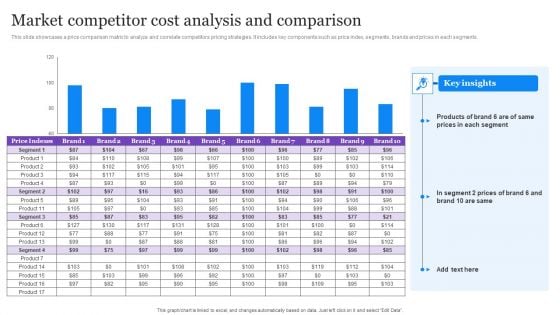
Market Competitor Cost Analysis And Comparison Demonstration PDF
This slide showcases a price comparison matrix to analyze and correlate competitors pricing strategies. It includes key components such as price index, segments, brands and prices in each segments. Showcasing this set of slides titled Market Competitor Cost Analysis And Comparison Demonstration PDF. The topics addressed in these templates are Market Competitor, Cost Analysis And Comparison. All the content presented in this PPT design is completely editable. Download it and make adjustments in color, background, font etc. as per your unique business setting.
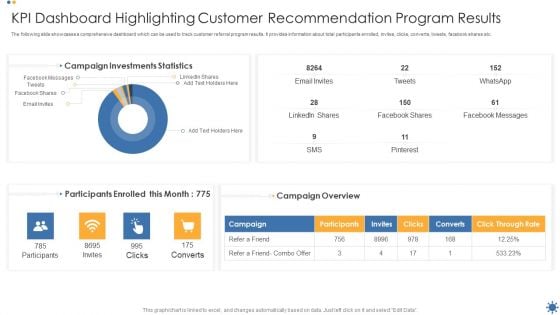
KPI Dashboard Highlighting Customer Recommendation Program Results Rules PDF
The following slide showcases a comprehensive dashboard which can be used to track customer referral program results. It provides information about total participants enrolled, invites, clicks, converts, tweets, facebook shares etc. Pitch your topic with ease and precision using this KPI Dashboard Highlighting Customer Recommendation Program Results Rules PDF. This layout presents information on Participants, Invites, Converts. It is also available for immediate download and adjustment. So, changes can be made in the color, design, graphics or any other component to create a unique layout.
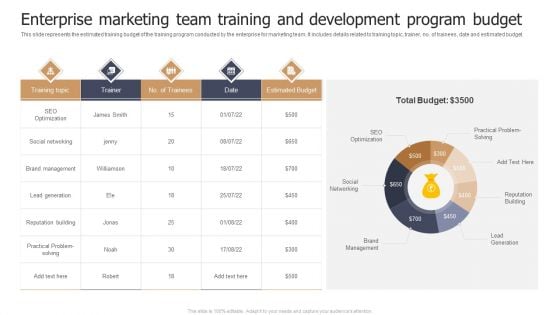
Enterprise Marketing Team Training And Development Program Budget Infographics PDF
This slide represents the estimated training budget of the training program conducted by the enterprise for marketing team. It includes details related to training topic, trainer, no. of trainees, date and estimated budget. Pitch your topic with ease and precision using this Enterprise Marketing Team Training And Development Program Budget Infographics PDF. This layout presents information on SEO Optimization, Social Networking, Brand Management. It is also available for immediate download and adjustment. So, changes can be made in the color, design, graphics or any other component to create a unique layout.
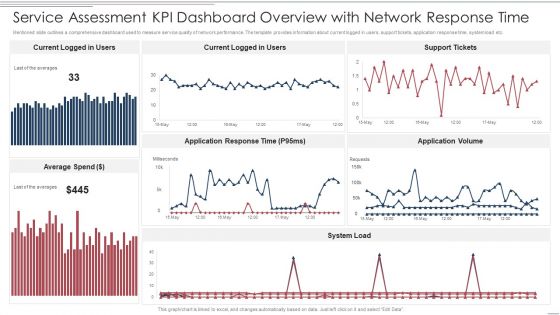
Service Assessment Kpi Dashboard Overview With Network Response Time Themes PDF
Mentioned slide outlines a comprehensive dashboard used to measure service quality of network performance. The template provides information about current logged in users, support tickets, application response time, system load etc. Pitch your topic with ease and precision using this Service Assessment Kpi Dashboard Overview With Network Response Time Themes PDF. This layout presents information on Average Spend, System Load, Application Response Time. It is also available for immediate download and adjustment. So, changes can be made in the color, design, graphics or any other component to create a unique layout.
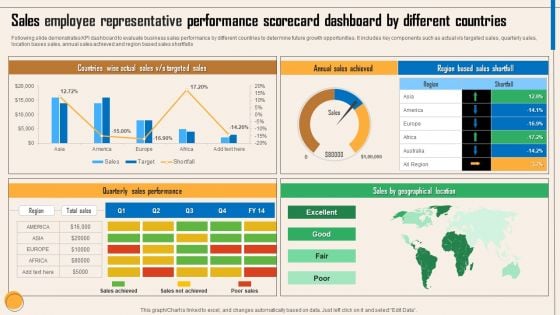
Sales Employee Representative Performance Scorecard Dashboard By Different Countries Themes PDF
Following slide demonstrates KPI dashboard to evaluate business sales performance by different countries to determine future growth opportunities. It includes key components such as actual v or s targeted sales, quarterly sales, location bases sales, annual sales achieved and region based sales shortfalls. Showcasing this set of slides titled Sales Employee Representative Performance Scorecard Dashboard By Different Countries Themes PDF. The topics addressed in these templates are Countries Wise Actual Sales, V Or S Targeted Sales, Annual Sales Achieved, Quarterly Sales Performance, Sales By Geographical Location. All the content presented in this PPT design is completely editable. Download it and make adjustments in color, background, font etc. as per your unique business setting.
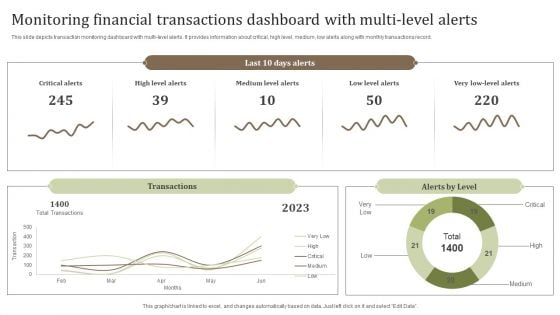
Monitoring Financial Transactions Dashboard With Multi Level Alerts Background PDF
This slide depicts transaction monitoring dashboard with multi-level alerts. It provides information about critical, high level, medium, low alerts along with monthly transactions record. Pitch your topic with ease and precision using this Monitoring Financial Transactions Dashboard With Multi Level Alerts Background PDF. This layout presents information on Critical Alerts, Medium Level Alerts, Total Transactions. It is also available for immediate download and adjustment. So, changes can be made in the color, design, graphics or any other component to create a unique layout.
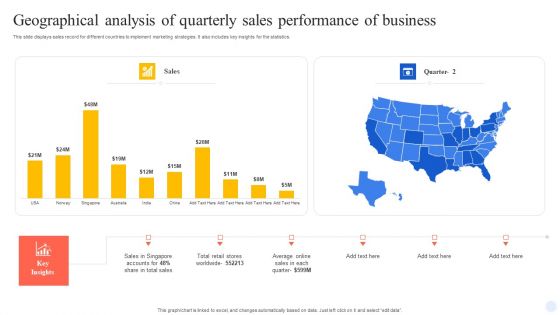
Geographical Analysis Of Quarterly Sales Performance Of Business Portrait PDF
This slide displays sales record for different countries to implement marketing strategies. It also includes key insights for the statistics. Pitch your topic with ease and precision using this Geographical Analysis Of Quarterly Sales Performance Of Business Portrait PDF. This layout presents information on Geographical Analysis, Quarterly Sales, Performance Of Business. It is also available for immediate download and adjustment. So, changes can be made in the color, design, graphics or any other component to create a unique layout.
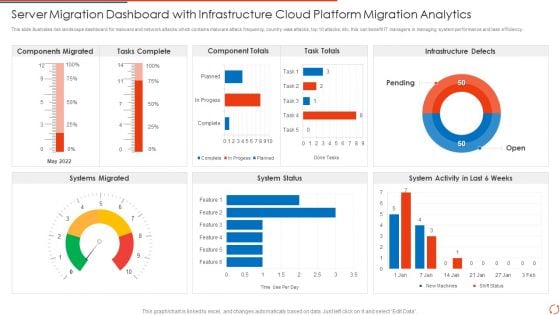
Server Migration Dashboard With Infrastructure Cloud Platform Migration Analytics Elements PDF Portrait PDF
This slide illustrates risk landscape dashboard for malware and network attacks which contains malware attack frequency, country wise attacks, top 10 attacks, etc. this can benefit IT managers in managing system performance and task efficiency Pitch your topic with ease and precision using this Server Migration Dashboard With Infrastructure Cloud Platform Migration Analytics Elements PDF Portrait PDF. This layout presents information on Tasks Complete, Component Totals, Task Totals. It is also available for immediate download and adjustment. So, changes can be made in the color, design, graphics or any other component to create a unique layout.
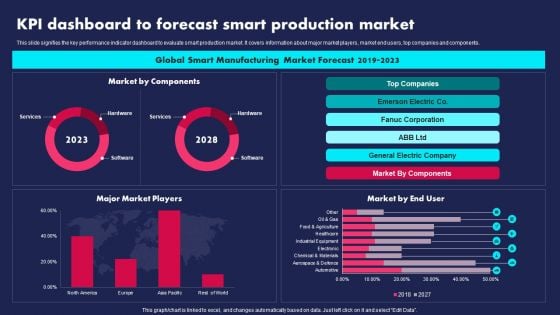
KPI Dashboard To Forecast Smart Production Market Ppt PowerPoint Presentation Gallery Visual Aids PDF
This slide signifies the key performance indicator dashboard to evaluate smart production market. It covers information about major market players, market end users, top companies and components. Pitch your topic with ease and precision using this KPI Dashboard To Forecast Smart Production Market Ppt PowerPoint Presentation Gallery Visual Aids PDF. This layout presents information on Global Smart Manufacturing, Market Forecast, 2019 To 2023. It is also available for immediate download and adjustment. So, changes can be made in the color, design, graphics or any other component to create a unique layout.
Implementation Challenges For Tracking And Assessment Framework Slides PDF
The slide displays statistical report for potential failures in effective implementation of monitoring and evaluation framework. It includes key components such as insufficient funds, employee resistance, poor communication, etc. Pitch your topic with ease and precision using this Implementation Challenges For Tracking And Assessment Framework Slides PDF. This layout presents information on Budget Allocated, Monitoring, Framework. It is also available for immediate download and adjustment. So, changes can be made in the color, design, graphics or any other component to create a unique layout.
Report On Cost Of High Restaurant Attrition Tracking With Key Insights Topics PDF
This slide depicts breakdown of cost incurred due to restaurant employees turnover. It includes components such as productivity loss, recruitment costs, selection costs, pre-departure costs, orientation and training costs, along with turnover rates, cost per churned employee, total annual cost. Pitch your topic with ease and precision using this Report On Cost Of High Restaurant Attrition Tracking With Key Insights Topics PDF. This layout presents information on Average Turnover Cost, Employee, Productivity. It is also available for immediate download and adjustment. So, changes can be made in the color, design, graphics or any other component to create a unique layout.
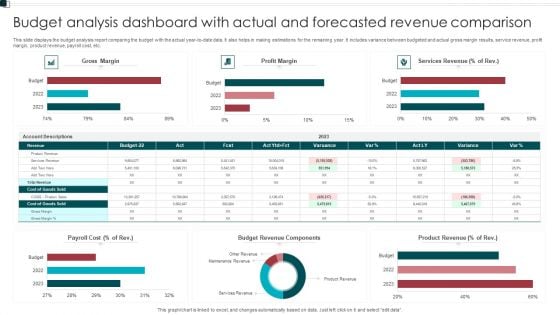
Budget Analysis Dashboard With Actual And Forecasted Revenue Comparison Structure PDF
This slide displays the budget analysis report comparing the budget with the actual year to date data. It also helps in making estimations for the remaining year. It includes variance between budgeted and actual gross margin results, service revenue, profit margin, product revenue, payroll cost, etc. Pitch your topic with ease and precision using this Budget Analysis Dashboard With Actual And Forecasted Revenue Comparison Structure PDF. This layout presents information on Payroll Cost, Budget Revenue Components, Product Revenue. It is also available for immediate download and adjustment. So, changes can be made in the color, design, graphics or any other component to create a unique layout.
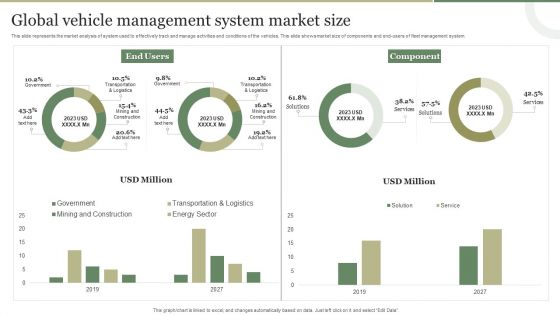
Global Vehicle Management System Market Size Guidelines PDF
This slide represents the market analysis of system used to effectively track and manage activities and conditions of the vehicles. This slide shows market size of components and end-users of fleet management system. Pitch your topic with ease and precision using this Global Vehicle Management System Market Size Guidelines PDF. This layout presents information on Global Vehicle, Management System, Market Size. It is also available for immediate download and adjustment. So, changes can be made in the color, design, graphics or any other component to create a unique layout.
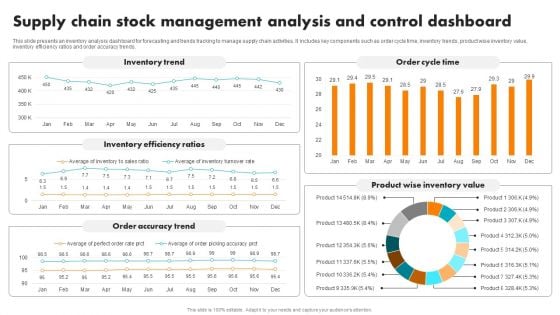
Supply Chain Stock Management Analysis And Control Dashboard Brochure PDF
This slide presents an inventory analysis dashboard for forecasting and trends tracking to manage supply chain activities. It includes key components such as order cycle time, inventory trends, product wise inventory value, inventory efficiency ratios and order accuracy trends. Pitch your topic with ease and precision using this Supply Chain Stock Management Analysis And Control Dashboard Brochure PDF. This layout presents information on Inventory Trend, Inventory Efficiency Ratios, Order Accuracy Trend, Order Cycle Time, Product Wise Inventory Value. It is also available for immediate download and adjustment. So, changes can be made in the color, design, graphics or any other component to create a unique layout.
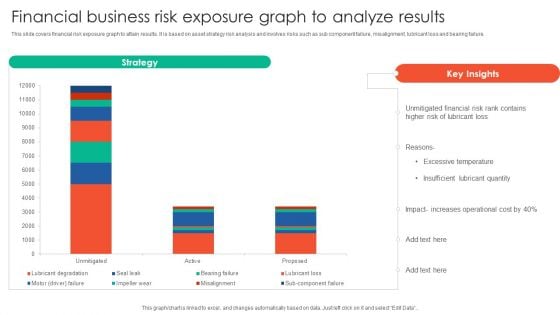
Financial Business Risk Exposure Graph To Analyze Results Elements PDF
This slide covers financial risk exposure graph to attain results. It is based on asset strategy risk analysis and involves risks such as sub component failure, misalignment, lubricant loss and bearing failure. Pitch your topic with ease and precision using this Financial Business Risk Exposure Graph To Analyze Results Elements PDF. This layout presents information on Strategy, Unmitigated Financial, Risk Rank Contains. It is also available for immediate download and adjustment. So, changes can be made in the color, design, graphics or any other component to create a unique layout.
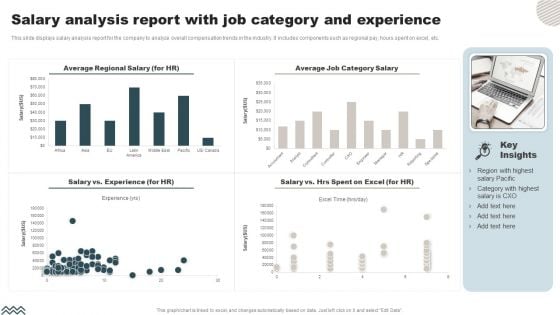
Salary Analysis Report With Job Category And Experience Microsoft PDF
This slide displays salary analysis report for the company to analyze overall compensation trends in the industry. It includes components such as regional pay, hours spent on excel, etc. Pitch your topic with ease and precision using this Salary Analysis Report With Job Category And Experience Microsoft PDF. This layout presents information on Average Regional Salary, Average Job Category Salary . It is also available for immediate download and adjustment. So, changes can be made in the color, design, graphics or any other component to create a unique layout.
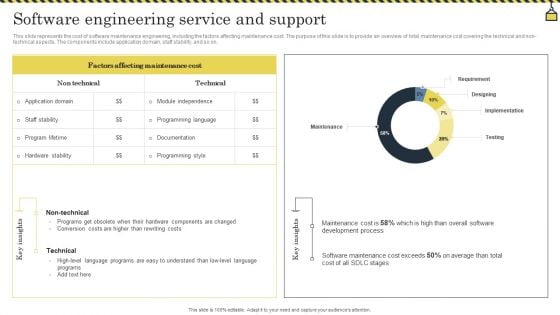
Software Engineering Service And Support Information PDF
This slide represents the cost of software maintenance engineering, including the factors affecting maintenance cost. The purpose of this slide is to provide an overview of total maintenance cost covering the technical and non technical aspects. The components include application domain, staff stability, and so on. Pitch your topic with ease and precision using this Software Engineering Service And Support Information PDF. This layout presents information on Rewriting Costs, Conversion Costs, Development Process. It is also available for immediate download and adjustment. So, changes can be made in the color, design, graphics or any other component to create a unique layout.
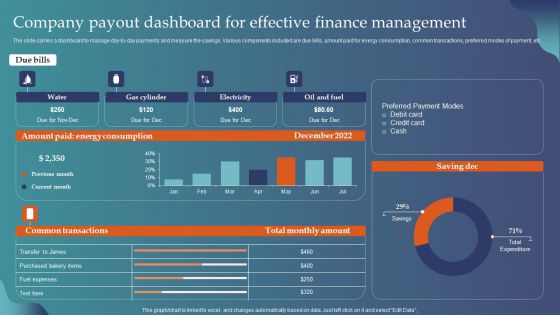
Company Payout Dashboard For Effective Finance Management Introduction PDF
The slide carries a dashboard to manage day-to-day payments and measure the savings. Various components included are due bills, amount paid for energy consumption, common transactions, preferred modes of payment, etc. Pitch your topic with ease and precision using this Company Payout Dashboard For Effective Finance Management Introduction PDF. This layout presents information on Electricity, Oil And Fuel, Gas Cylinder. It is also available for immediate download and adjustment. So, changes can be made in the color, design, graphics or any other component to create a unique layout.
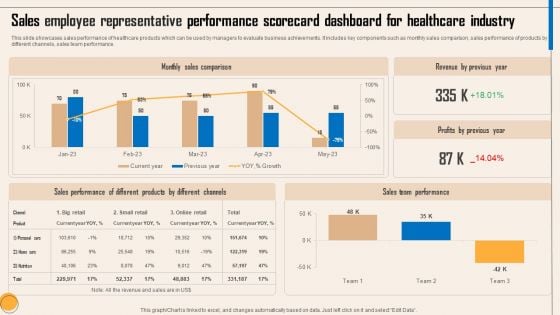
Sales Employee Representative Performance Scorecard Dashboard For Healthcare Industry Clipart PDF
This slide showcases sales performance of healthcare products which can be used by managers to evaluate business achievements. It includes key components such as monthly sales comparison, sales performance of products by different channels, sales team performance. Pitch your topic with ease and precision using this Sales Employee Representative Performance Scorecard Dashboard For Healthcare Industry Clipart PDF. This layout presents information on Monthly Sales Comparison, Revenue By Previous Year, Sales Performance, Different Products, Different Channels, Sales Team Performance . It is also available for immediate download and adjustment. So, changes can be made in the color, design, graphics or any other component to create a unique layout.
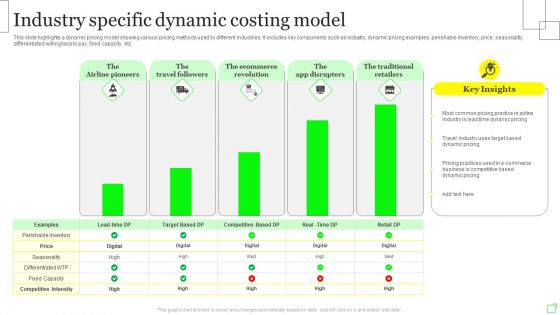
Industry Specific Dynamic Costing Model Demonstration PDF
This slide highlights a dynamic pricing model showing various pricing methods used by different industries. It includes key components such as industry, dynamic pricing examples, perishable inventory, price, seasonality, differentiated willingness to pay, fixed capacity, etc. Pitch your topic with ease and precision using this Industry Specific Dynamic Costing Model Demonstration PDF. This layout presents information on Dynamic Pricing, E Commerce, Target. It is also available for immediate download and adjustment. So, changes can be made in the color, design, graphics or any other component to create a unique layout.
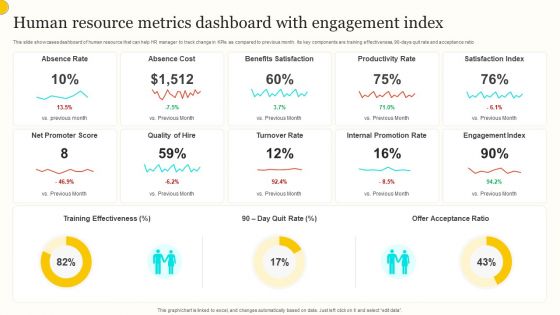
Human Resource Metrics Dashboard With Engagement Index Guidelines PDF
This slide showcases dashboard of human resource that can help HR manager to track change in KPIs as compared to previous month. Its key components are training effectiveness, 90 days quit rate and acceptance ratio. Pitch your topic with ease and precision using this Human Resource Metrics Dashboard With Engagement Index Guidelines PDF. This layout presents information on Absence Rate, Absence Cost, Benefits Satisfaction. It is also available for immediate download and adjustment. So, changes can be made in the color, design, graphics or any other component to create a unique layout.
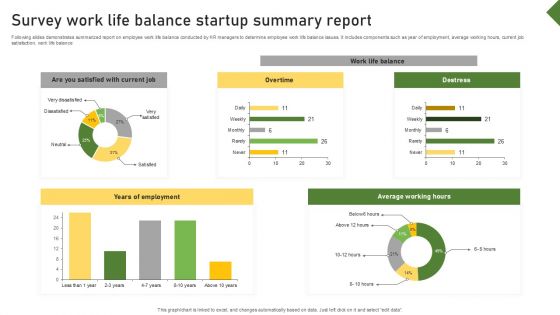
Survey Work Life Balance Startup Summary Report Survey SS
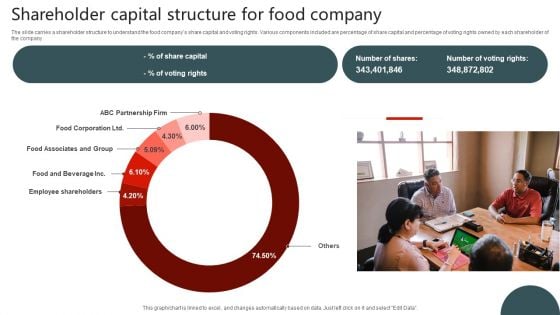
Shareholder Capital Structure For Food Company Inspiration PDF
The slide carries a shareholder structure to understand the food companys share capital and voting rights. Various components included are percentage of share capital and percentage of voting rights owned by each shareholder of the company. Pitch your topic with ease and precision using this Shareholder Capital Structure For Food Company Inspiration PDF. This layout presents information on Shareholder Capital Structure, Food Company. It is also available for immediate download and adjustment. So, changes can be made in the color, design, graphics or any other component to create a unique layout.
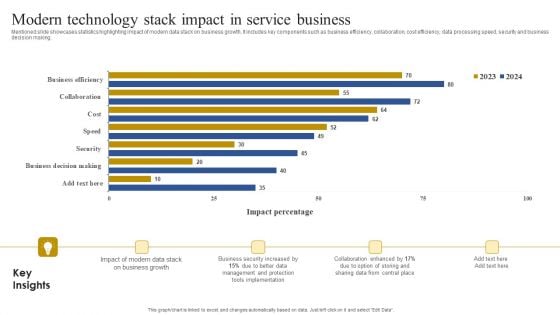
Modern Technology Stack Impact In Service Business Clipart PDF
Mentioned slide showcases statistics highlighting impact of modern data stack on business growth. It includes key components such as business efficiency, collaboration, cost efficiency, data processing speed, security and business decision making. Pitch your topic with ease and precision using this Modern Technology Stack Impact In Service Business Clipart PDF. This layout presents information on Business Security, Implementation, Management And Protection. It is also available for immediate download and adjustment. So, changes can be made in the color, design, graphics or any other component to create a unique layout.
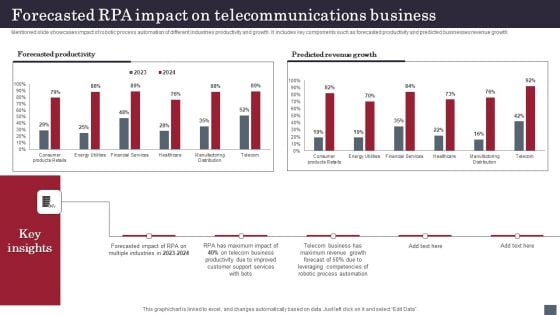
Forecasted RPA Impact On Telecommunications Business Professional PDF
Mentioned slide showcases impact of robotic process automation of different industries productivity and growth. It includes key components such as forecasted productivity and predicted businesses revenue growth. Pitch your topic with ease and precision using this Forecasted RPA Impact On Telecommunications Business Professional PDF. This layout presents information on Forecasted Productivity, Predicted Revenue Growth, Telecom Business. It is also available for immediate download and adjustment. So, changes can be made in the color, design, graphics or any other component to create a unique layout.
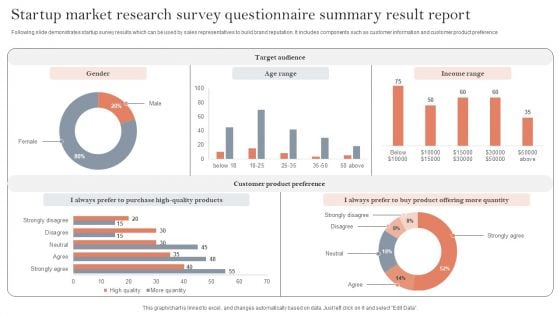
Startup Market Research Survey Questionnaire Summary Result Report Survey SS
Following slide demonstrates startup survey results which can be used by sales representatives to build brand reputation. It includes components such as customer information and customer product preference. Pitch your topic with ease and precision using this Startup Market Research Survey Questionnaire Summary Result Report Survey SS. This layout presents information on Target Audience, Customer Product Preference, Income Range, Purchase High-Quality Products. It is also available for immediate download and adjustment. So, changes can be made in the color, design, graphics or any other component to create a unique layout.
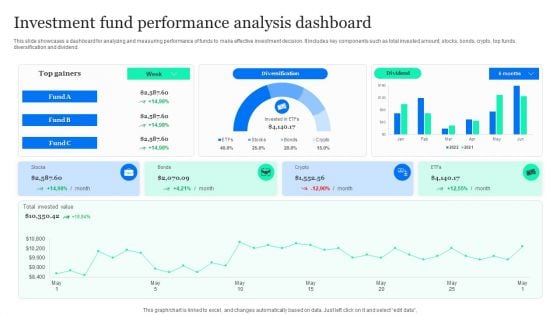
Investment Fund Performance Analysis Dashboard Professional PDF
This slide showcases a dashboard for analyzing and measuring performance of funds to make effective investment decision. It includes key components such as total invested amount, stocks, bonds, crypto, top funds, diversification and dividend. Pitch your topic with ease and precision using this Investment Fund Performance Analysis Dashboard Professional PDF. This layout presents information on Diversification, Invested Value, Bonds. It is also available for immediate download and adjustment. So, changes can be made in the color, design, graphics or any other component to create a unique layout.
Investment Fund Performance Tracking Dashboard Microsoft PDF
This slide showcases a dashboard to track and supervise funds performance for portfolio balancing . it includes key components such as amount invested in funds, number of invested funds, rate of return, annual investments and rating wise investments. Pitch your topic with ease and precision using this Investment Fund Performance Tracking Dashboard Microsoft PDF. This layout presents information on Amount Invented Funds, Rate Return, Rating Wise Investments. It is also available for immediate download and adjustment. So, changes can be made in the color, design, graphics or any other component to create a unique layout.
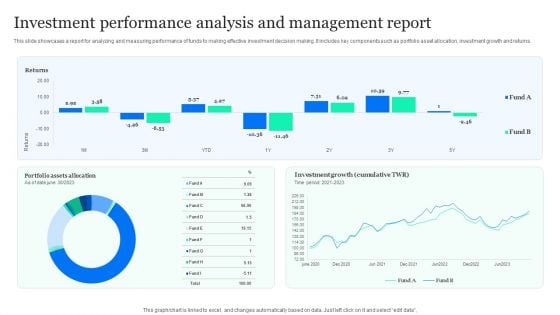
Investment Performance Analysis And Management Report Sample PDF
This slide showcases a report for analyzing and measuring performance of funds to making effective investment decision making. It includes key components such as portfolio asset allocation, investment growth and returns. Pitch your topic with ease and precision using this Investment Performance Analysis And Management Report Sample PDF. This layout presents information on Portfolio Assets Allocation, Investment Growth, Returns. It is also available for immediate download and adjustment. So, changes can be made in the color, design, graphics or any other component to create a unique layout.
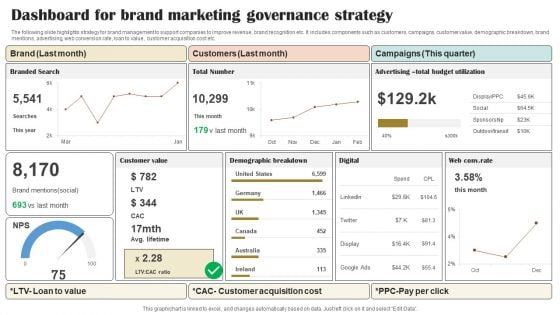
Dashboard For Brand Marketing Governance Strategy Portrait PDF
The following slide highlights strategy for brand management to support companies to improve revenue, brand recognition etc. It includes components such as customers, campaigns, customer value, demographic breakdown, brand mentions, advertising, web conversion rate, loan to value, customer acquisition cost etc. Pitch your topic with ease and precision using this Dashboard For Brand Marketing Governance Strategy Portrait PDF. This layout presents information on Brand, Customers, Campaigns. It is also available for immediate download and adjustment. So, changes can be made in the color, design, graphics or any other component to create a unique layout.
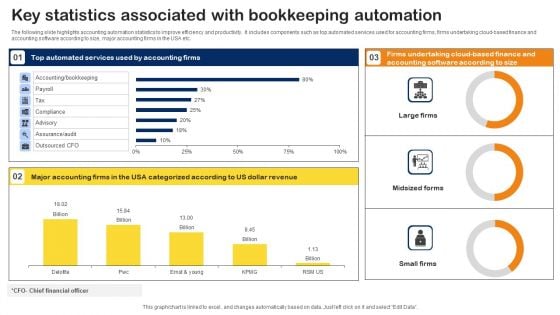
Key Statistics Associated With Bookkeeping Automation Demonstration PDF
The following slide highlights accounting automation statistics to improve efficiency and productivity. It includes components such as top automated services used for accounting firms, firms undertaking cloud-based finance and accounting software according to size, major accounting firms in the USA etc. Pitch your topic with ease and precision using this Key Statistics Associated With Bookkeeping Automation Demonstration PDF. This layout presents information on Key Statistics Associated, Bookkeeping Automation. It is also available for immediate download and adjustment. So, changes can be made in the color, design, graphics or any other component to create a unique layout.
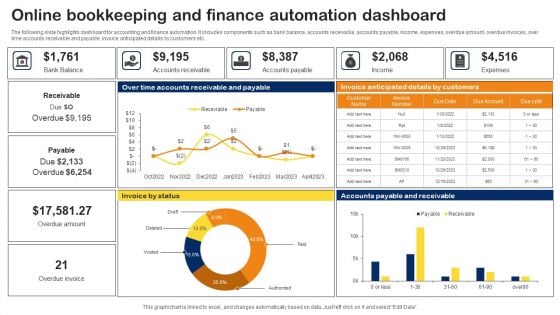
Online Bookkeeping And Finance Automation Dashboard Topics PDF
The following slide highlights dashboard for accounting and finance automation. It includes components such as bank balance, accounts receivable, accounts payable, income, expenses, overdue amount, overdue invoices, over time accounts receivable and payable, invoice anticipated details by customers etc. Pitch your topic with ease and precision using this Online Bookkeeping And Finance Automation Dashboard Topics PDF. This layout presents information on Online Bookkeeping, Finance Automation Dashboard. It is also available for immediate download and adjustment. So, changes can be made in the color, design, graphics or any other component to create a unique layout.
KPI Dashboard Of Client Support Icons PDF
This slide shows customer service delivery key performance indicators dashboard. It includes KPIs such as issues received, average time to close issues, first call resolution, top performers, etc. Pitch your topic with ease and precision using this KPI Dashboard Of Client Support Icons PDF. This layout presents information on KPI Dashboard, Client Support. It is also available for immediate download and adjustment. So, changes can be made in the color, design, graphics or any other component to create a unique layout.
New Commodity Development Assessment Metrics Icons PDF
The following slide highlights the key metrics to evaluate product performance. It includes elements such as product wise revenue, time to the market etc.Pitch your topic with ease and precision using this New Commodity Development Assessment Metrics Icons PDF. This layout presents information on Annual Product, Wise Revenue, Shown Continuous. It is also available for immediate download and adjustment. So, changes can be made in the color, design, graphics or any other component to create a unique layout.
Icon For Investment Risk Analysis Infographics PDF
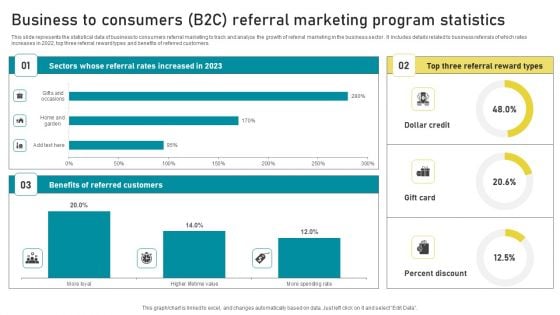
Business To Consumers B2C Referral Marketing Program Statistics Information PDF
This slide represents the statistical data of business to consumers referral marketing to track and analyze the growth of referral marketing in the business sector . It includes details related to business referrals of which rates increases in 2022, top three referral reward types and benefits of referred customers. Pitch your topic with ease and precision using this Business To Consumers B2C Referral Marketing Program Statistics Information PDF. This layout presents information on Top Three Referral, Reward Types, Dollar Credit, Percent Discount, Gift Card. It is also available for immediate download and adjustment. So, changes can be made in the color, design, graphics or any other component to create a unique layout.
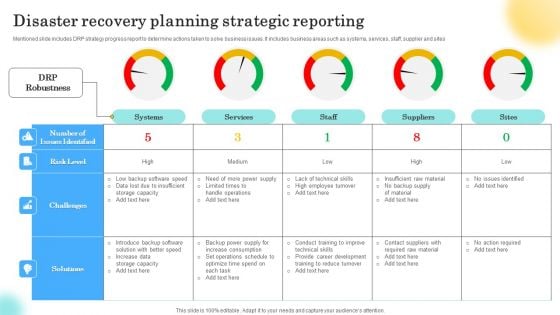
Disaster Recovery Planning Strategic Reporting Inspiration PDF
Mentioned slide includes DRP strategy progress report to determine actions taken to solve business issues. It includes business areas such as systems, services, staff, supplier and sites Pitch your topic with ease and precision using this Disaster Recovery Planning Strategic Reporting Inspiration PDF. This layout presents information on Systems, Services, Staff. It is also available for immediate download and adjustment. So, changes can be made in the color, design, graphics or any other component to create a unique layout.
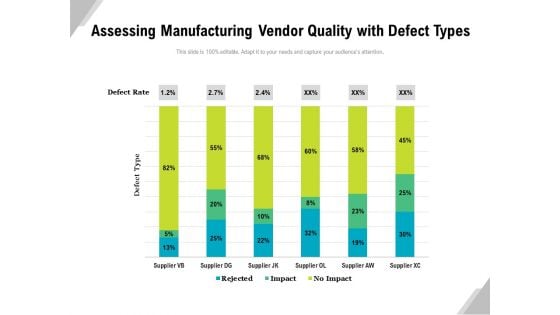
Assessing Manufacturing Vendor Quality With Defect Types Ppt PowerPoint Presentation Infographics Grid PDF
Pitch your topic with ease and precision using this assessing manufacturing vendor quality with defect types ppt powerpoint presentation infographics grid pdf. This layout presents information on defect rate, impact, manufacturing. It is also available for immediate download and adjustment. So, changes can be made in the color, design, graphics or any other component to create a unique layout.
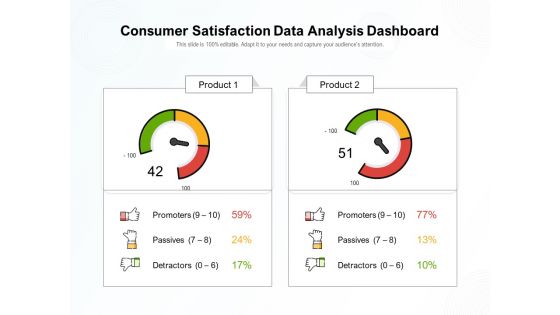
Consumer Satisfaction Data Analysis Dashboard Ppt PowerPoint Presentation Gallery Microsoft PDF
Pitch your topic with ease and precision using this consumer satisfaction data analysis dashboard ppt powerpoint presentation gallery microsoft pdf. This layout presents information on promoters, passives, detractors. It is also available for immediate download and adjustment. So, changes can be made in the color, design, graphics or any other component to create a unique layout.
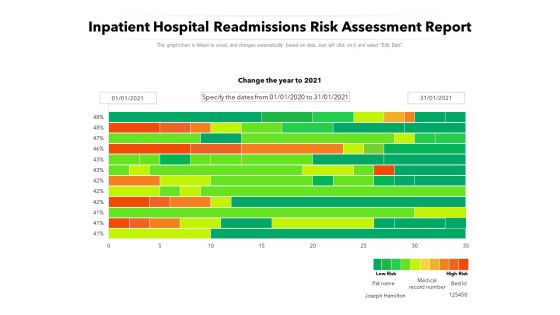
Inpatient Hospital Readmissions Risk Assessment Report Ppt PowerPoint Presentation File Rules PDF
Pitch your topic with ease and precision using this inpatient hospital readmissions risk assessment report ppt powerpoint presentation file rules pdf. This layout presents information on inpatient hospital readmissions risk assessment report. It is also available for immediate download and adjustment. So, changes can be made in the color, design, graphics or any other component to create a unique layout.
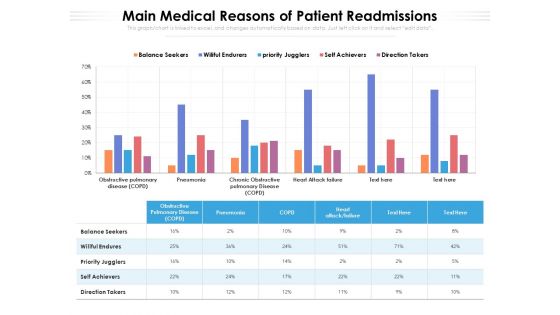
Main Medical Reasons Of Patient Readmissions Ppt PowerPoint Presentation Gallery Rules PDF
Pitch your topic with ease and precision using this main medical reasons of patient readmissions ppt powerpoint presentation gallery rules pdf. This layout presents information on balance seekers, willful endures, priority jugglers, self achievers, direction takers. It is also available for immediate download and adjustment. So, changes can be made in the color, design, graphics or any other component to create a unique layout.


 Continue with Email

 Home
Home


