Improvement Plan
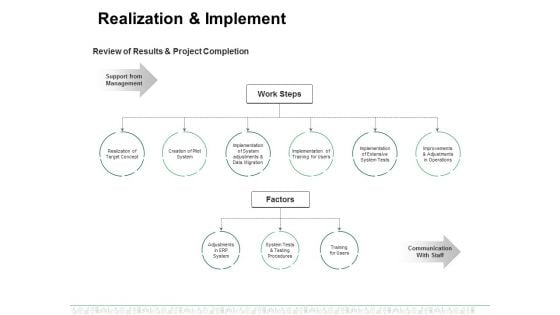
Realization And Implement Ppt PowerPoint Presentation Pictures Guide
This is a realization and implement ppt powerpoint presentation pictures guide. This is a two stage process. The stages in this process are realization of target concept, creation of pilot system, implementation of training for users, implementation of extensive system tests, adjustments in erp system.
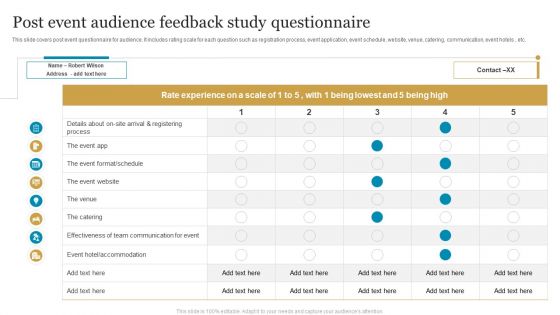
Post Event Audience Feedback Study Questionnaire Ideas PDF
This slide covers post event questionnaire for audience. It includes rating scale for each question such as registration process, event application, event schedule, website, venue, catering, communication, event hotels , etc. Showcasing this set of slides titled Post Event Audience Feedback Study Questionnaire Ideas PDF. The topics addressed in these templates are Team Communication, Post Event Audience, Feedback Study Questionnaire. All the content presented in this PPT design is completely editable. Download it and make adjustments in color, background, font etc. as per your unique business setting.
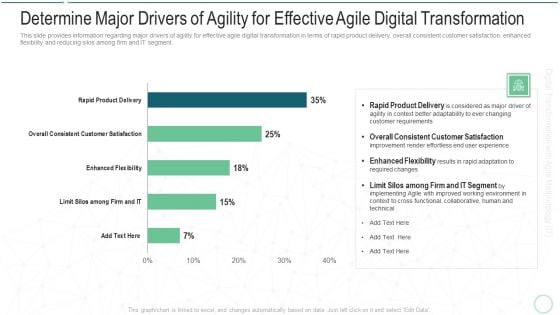
Determine Major Drivers Of Agility For Effective Agile Digital Transformation Sample PDF
This slide provides information regarding major drivers of agility for effective agile digital transformation in terms of rapid product delivery, overall consistent customer satisfaction, enhanced flexibility and reducing silos among firm and IT segment. Deliver an awe inspiring pitch with this creative determine major drivers of agility for effective agile digital transformation sample pdf bundle. Topics like rapid product delivery, enhanced flexibility, overall consistent customer satisfaction, limit silos among firm and it segment can be discussed with this completely editable template. It is available for immediate download depending on the needs and requirements of the user.
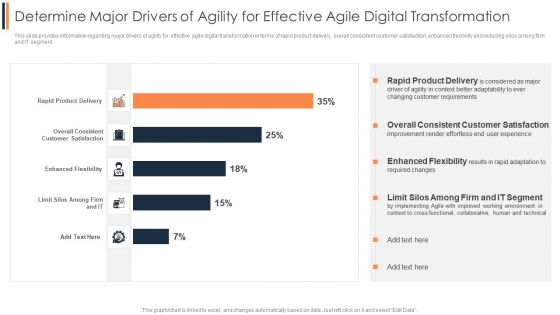
Agile Approach To Digital Transformation IT Determine Major Drivers Of Agility For Effective Agile Demonstration PDF
This slide provides information regarding major drivers of agility for effective agile digital transformation in terms of rapid product delivery, overall consistent customer satisfaction, enhanced flexibility and reducing silos among firm and IT segment. Deliver and pitch your topic in the best possible manner with this Agile Approach To Digital Transformation IT Determine Major Drivers Of Agility For Effective Agile Demonstration PDF Use them to share invaluable insights on Overall Consistent, Enhanced Flexibility, Customer Satisfaction and impress your audience. This template can be altered and modified as per your expectations. So, grab it now.
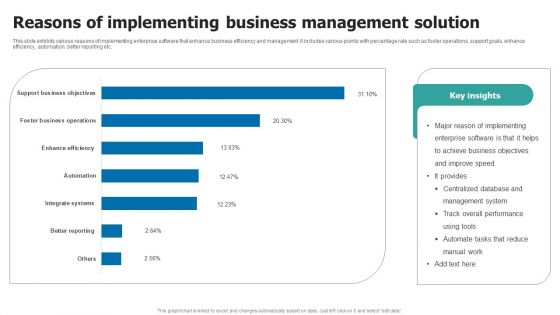
Reasons Of Implementing Business Management Solution Inspiration PDF
This slide exhibits various reasons of implementing enterprise software that enhance business efficiency and management. It includes various points with percentage rate such as foster operations, support goals, enhance efficiency, automation, better reporting etc. Showcasing this set of slides titled Reasons Of Implementing Business Management Solution Inspiration PDF. The topics addressed in these templates are Reasons Of Implementing, Business Management Solution. All the content presented in this PPT design is completely editable. Download it and make adjustments in color, background, font etc. as per your unique business setting.
Focus On World Target Business PowerPoint Templates Ppt Backgrounds For Slides 0113
We present our Focus On World Target Business PowerPoint Templates PPT Backgrounds For Slides 0113.Download and present our Success PowerPoint Templates because It will get your audience in sync. Download our Business PowerPoint Templates because It will Raise the bar of your Thoughts. They are programmed to take you to the next level. Use our Targets PowerPoint Templates because Our PowerPoint Templates and Slides are designed to help you succeed. They have all the ingredients you need. Use our Arrows PowerPoint Templates because Our PowerPoint Templates and Slides will let your words and thoughts hit bullseye everytime. Download our Globe PowerPoint Templates because Our PowerPoint Templates and Slides are aesthetically designed to attract attention. We gaurantee that they will grab all the eyeballs you need.Use these PowerPoint slides for presentations relating to Global And Dart for Business Concept, globe, success, targets, business, arrows. The prominent colors used in the PowerPoint template are Blue, Red, White. You can be sure our Focus On World target Business PowerPoint Templates PPT Backgrounds For Slides 0113 will make you look like a winner. Professionals tell us our Concept PowerPoint templates and PPT Slides will get their audience's attention. Customers tell us our Focus On World target Business PowerPoint Templates PPT Backgrounds For Slides 0113 are topically designed to provide an attractive backdrop to any subject. Presenters tell us our success PowerPoint templates and PPT Slides are aesthetically designed to attract attention. We guarantee that they will grab all the eyeballs you need. We assure you our Focus On World target Business PowerPoint Templates PPT Backgrounds For Slides 0113 help you meet deadlines which are an element of today's workplace. Just browse and pick the slides that appeal to your intuitive senses. Presenters tell us our targets PowerPoint templates and PPT Slides are visually appealing. Our Focus On World Target Business PowerPoint Templates Ppt Backgrounds For Slides 0113 are clairyovant. They discern your demands before you make them.
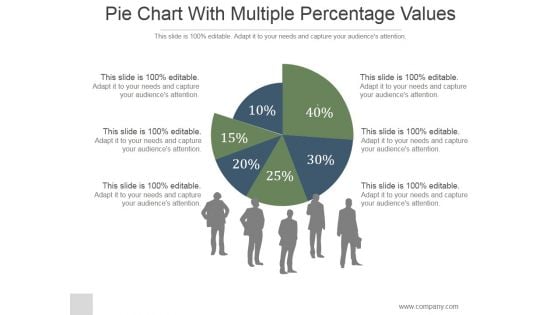
Pie Chart With Multiple Percentage Values Ppt PowerPoint Presentation Show
This is a pie chart with multiple percentage values ppt powerpoint presentation show. This is a six stage process. The stages in this process are pie, finance, people, silhouettes, communication.
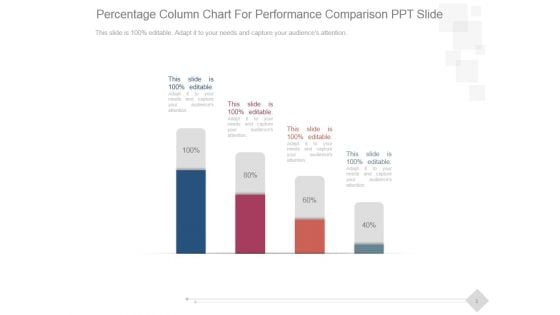
Percentage Column Chart For Performance Comparison Ppt PowerPoint Presentation Good
This is a percentage column chart for performance comparison ppt powerpoint presentation good. This is a four stage process. The stages in this process are business, marketing, technology, presentation, management.
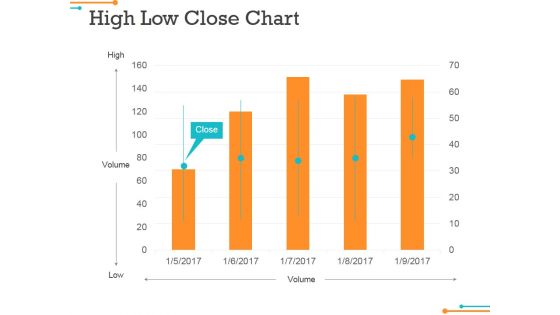
High Low Close Chart Ppt Powerpoint Presentation Gallery Slides
This is a high low close chart ppt powerpoint presentation gallery slides. This is a five stage process. The stages in this process are close, volume, high, low, graph.
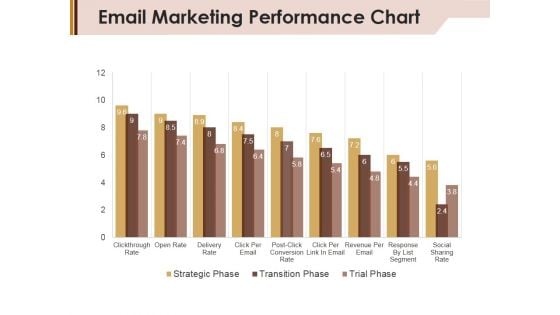
Email Marketing Performance Chart Ppt Powerpoint Presentation Layouts Graphics Pictures
This is a email marketing performance chart ppt powerpoint presentation layouts graphics pictures. This is a nine stage process. The stages in this process are strategic phase, transition phase, trial phase.
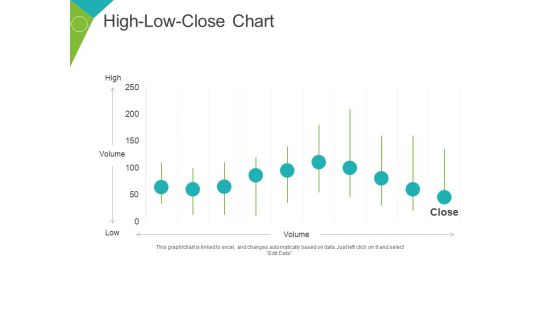
High Low Close Chart Ppt PowerPoint Presentation Layouts Guide
This is a high low close chart ppt powerpoint presentation layouts guide. This is a ten stage process. The stages in this process are high, volume, low, business, marketing, finance.
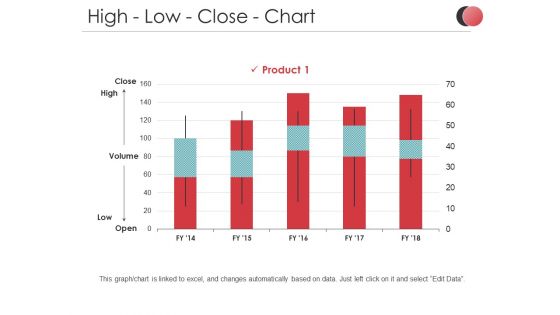
High Low Close Chart Ppt PowerPoint Presentation Ideas Brochure
This is a high low close chart ppt powerpoint presentation ideas brochure. This is a three stage process. The stages in this process are in percentage, product, business, marketing, finance.
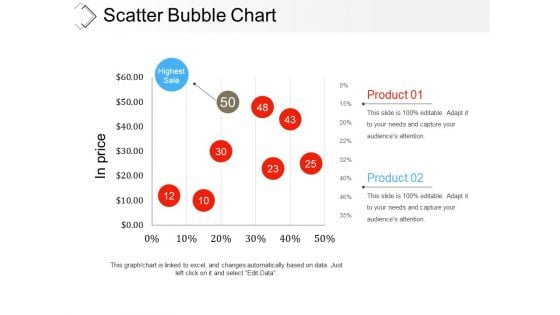
Scatter Bubble Chart Ppt PowerPoint Presentation Infographic Template Examples
This is a scatter bubble chart ppt powerpoint presentation infographic template examples. This is a two stage process. The stages in this process are highest sale, product, in price, finance, business.
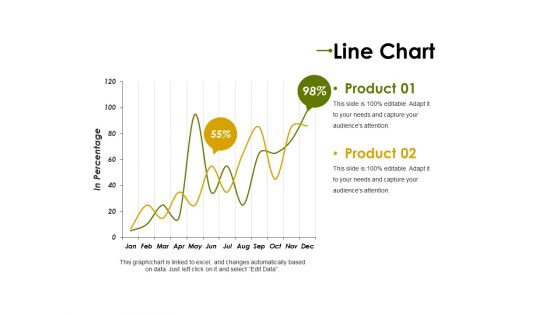
Line Chart Ppt PowerPoint Presentation Professional Clipart Images
This is a line chart ppt powerpoint presentation professional clipart images. This is a two stage process. The stages in this process are product, in percentage, graph, percentage, finance, business.
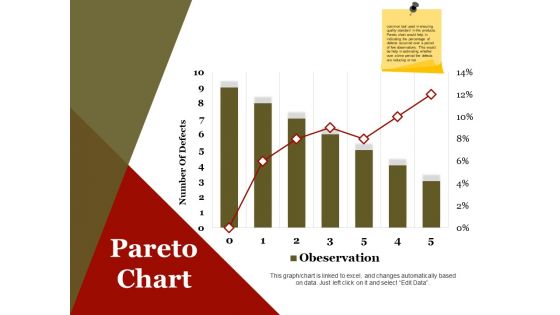
Pareto Chart Ppt PowerPoint Presentation Infographics Design Inspiration
This is a pareto chart ppt powerpoint presentation infographics design inspiration. This is a seven stage process. The stages in this process are number of defects, business, marketing, finance.
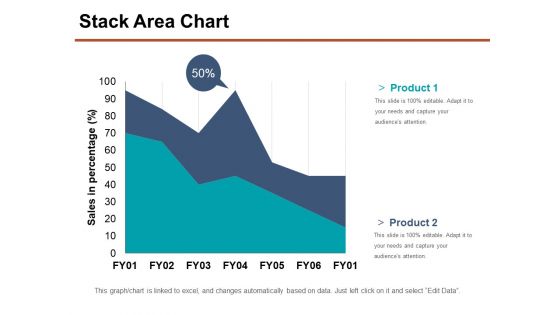
Stack Area Chart Ppt PowerPoint Presentation Show Samples
This is a stack area chart ppt powerpoint presentation show samples. This is a two stage process. The stages in this process are product, sales in percentage, business, marketing, percentage.
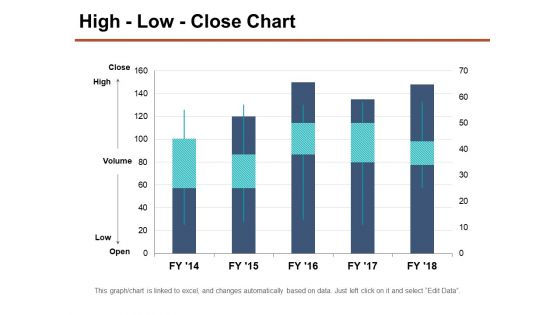
High Low Close Chart Ppt PowerPoint Presentation Layouts Objects
This is a high low close chart ppt powerpoint presentation layouts objects. This is a five stage process. The stages in this process are high, volume, low, business, marketing.
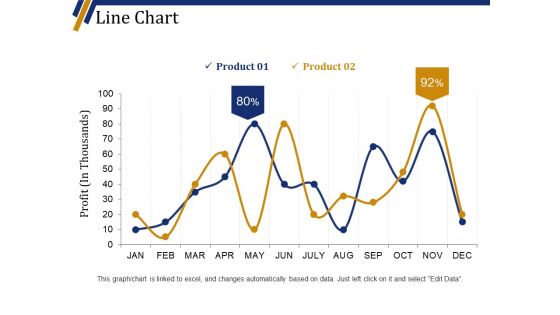
Line Chart Ppt PowerPoint Presentation Portfolio Background Designs
This is a line chart ppt powerpoint presentation portfolio background designs. This is a two stage process. The stages in this process are product, business, finance, marketing, profit in thousands.
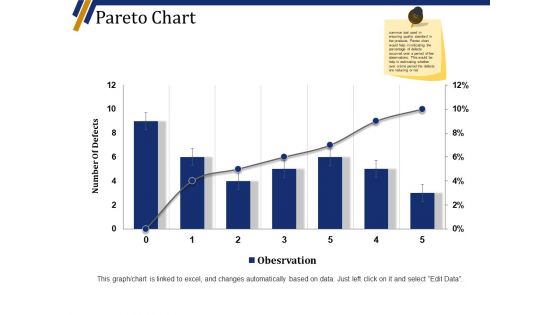
Pareto Chart Ppt PowerPoint Presentation File Infographic Template
This is a pareto chart ppt powerpoint presentation file infographic template. This is a six stage process. The stages in this process are number of defects, business, marketing, graph.
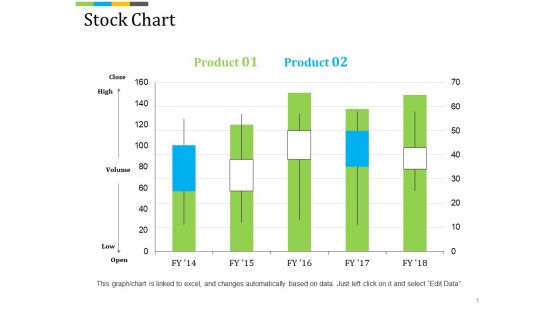
Stock Chart Ppt PowerPoint Presentation Professional Background Image
This is a stock chart ppt powerpoint presentation professional background image. This is a five stage process. The stages in this process are high, volume, low, finance, business, marketing.
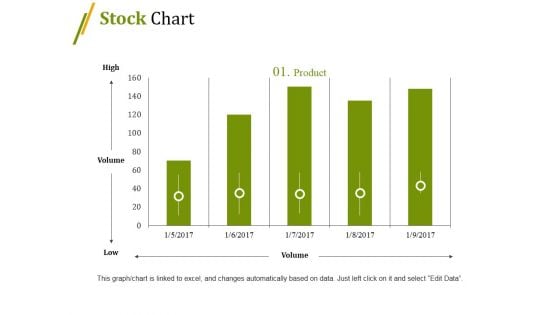
Stock Chart Ppt PowerPoint Presentation Summary File Formats
This is a stock chart ppt powerpoint presentation summary file formats. This is a five stage process. The stages in this process are high, volume, low, business, graph, finance.
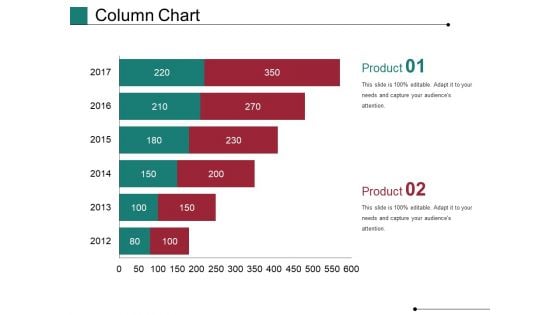
Column Chart Ppt PowerPoint Presentation Show Master Slide
This is a column chart ppt powerpoint presentation show master slide. This is a six stage process. The stages in this process are financial, years, business, marketing, finance, graph.
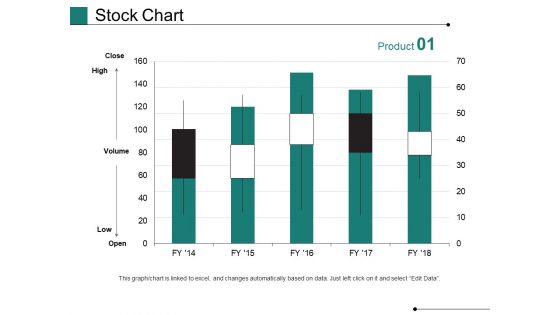
Stock Chart Ppt PowerPoint Presentation Pictures Graphics Design
This is a stock chart ppt powerpoint presentation pictures graphics design. This is a five stage process. The stages in this process are high, volume, low, business, marketing, graph.
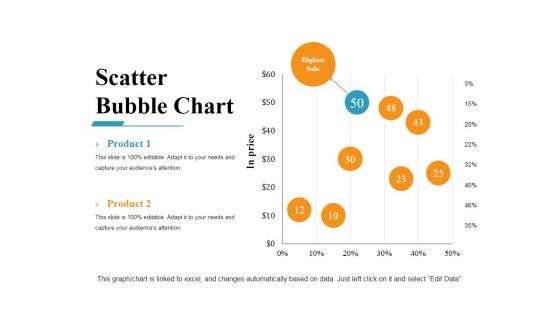
Scatter Bubble Chart Ppt PowerPoint Presentation Gallery Example Introduction
This is a scatter bubble chart ppt powerpoint presentation gallery example introduction. This is a eight stage process. The stages in this process are business, marketing, finance, bubble, scatter.
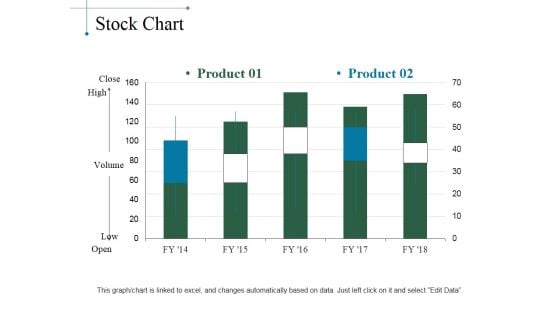
Stock Chart Ppt PowerPoint Presentation Layouts Designs Download
This is a stock chart ppt powerpoint presentation layouts designs download. This is a five stage process. The stages in this process are product, close, high, volume, low, open.
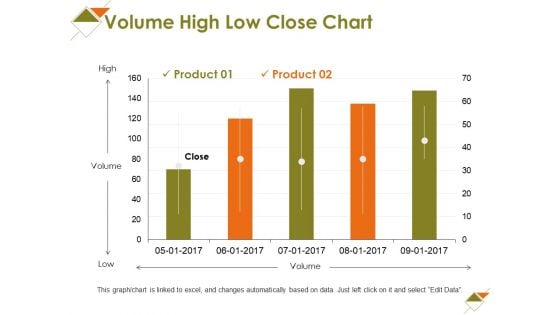
Volume High Low Close Chart Ppt PowerPoint Presentation Slides Styles
This is a volume high low close chart ppt powerpoint presentation slides styles. This is a two stage process. The stages in this process are high, volume, low, business, marketing.
Scatter Chart Template 2 Ppt PowerPoint Presentation Slides Icons
This is a scatter chart template 2 ppt powerpoint presentation slides icons. This is a two stage process. The stages in this process are business, marketing, graph, in percentage, finance.
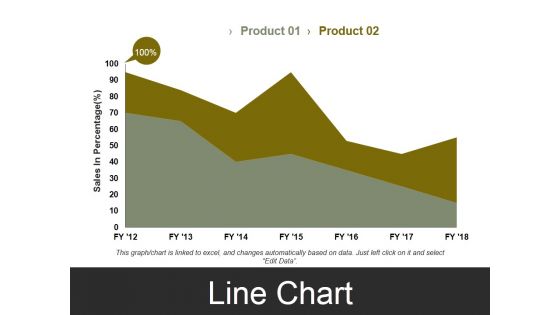
Line Chart Template 3 Ppt PowerPoint Presentation Styles Visual Aids
This is a line chart template 3 ppt powerpoint presentation styles visual aids. This is a two stage process. The stages in this process are sales in percentage, business, marketing, finance, graph.
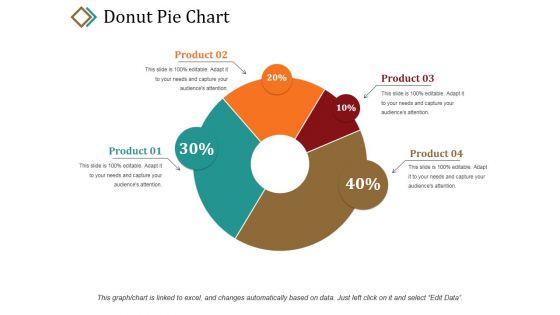
Donut Pie Chart Ppt PowerPoint Presentation Portfolio Graphic Tips
This is a donut pie chart ppt powerpoint presentation portfolio graphic tips. This is a four stage process. The stages in this process are product, percentage, business, marketing, donut.
Donut Pie Chart Ppt PowerPoint Presentation Icon Background Designs
This is a donut pie chart ppt powerpoint presentation icon background designs. This is a four stage process. The stages in this process are product, percentage, finance, donut, business.
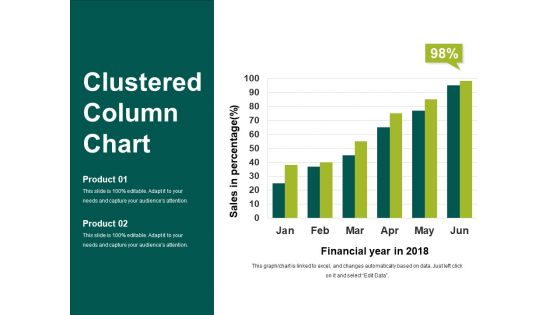
Clustered Column Chart Ppt PowerPoint Presentation Show Slideshow
This is a clustered column chart ppt powerpoint presentation show slideshow. This is a six stage process. The stages in this process are financial year in, sales in percentage, business, marketing, finance.
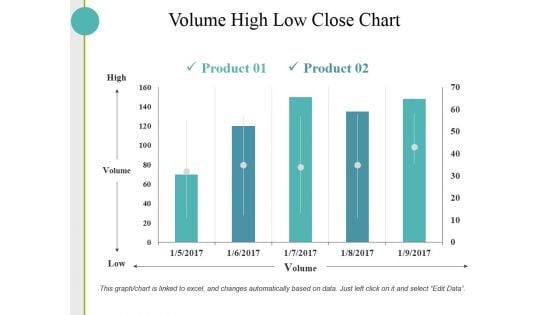
Volume High Low Close Chart Ppt PowerPoint Presentation Inspiration Skills
This is a volume high low close chart ppt powerpoint presentation inspiration skills. This is a two stage process. The stages in this process are high, volume, low, business.
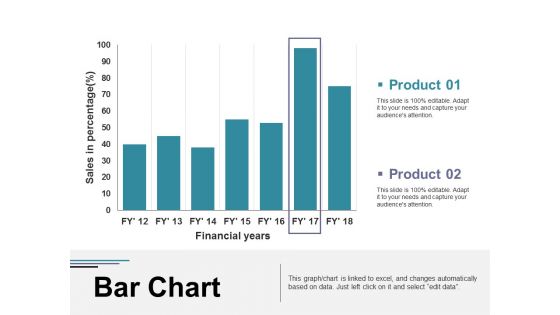
Bar Chart Ppt PowerPoint Presentation Visual Aids Diagrams
This is a bar chart ppt powerpoint presentation visual aids diagrams. This is a two stage process. The stages in this process are business, marketing, financial years, sales in percentage, graph.
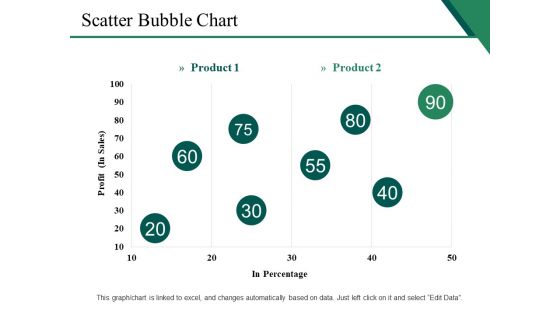
Scatter Bubble Chart Ppt PowerPoint Presentation Gallery Show
This is a scatter bubble chart ppt powerpoint presentation gallery show. This is a two stage process. The stages in this process are profit, in percentage, finance, marketing, business.
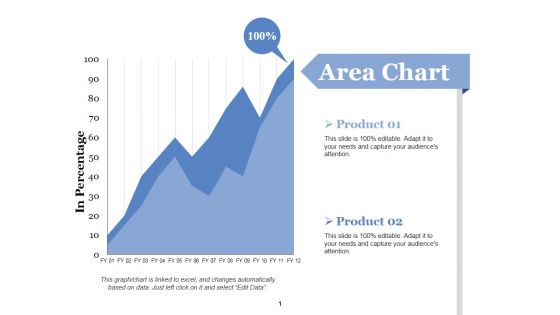
Area Chart Ppt PowerPoint Presentation Portfolio Graphics Design
This is a area chart ppt powerpoint presentation portfolio graphics design. This is a two stage process. The stages in this process are business, marketing, in percentage, graph, finance.
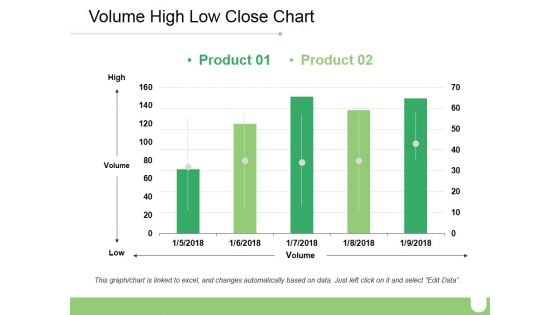
Volume High Low Close Chart Ppt PowerPoint Presentation Inspiration Brochure
This is a volume high low close chart ppt powerpoint presentation inspiration brochure. This is a two stage process. The stages in this process are business, high, volume, low, marketing.
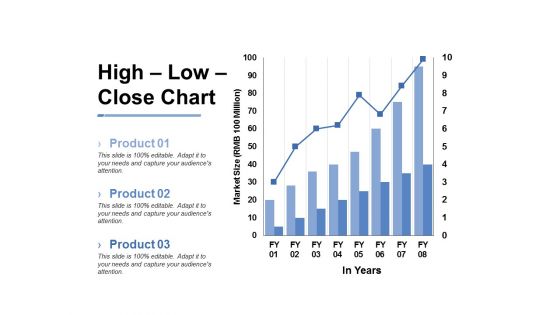
High Low Close Chart Ppt PowerPoint Presentation Inspiration Slide
This is a high low close chart ppt powerpoint presentation inspiration slide. This is a three stage process. The stages in this process are business, marketing, market size, in years, graph.
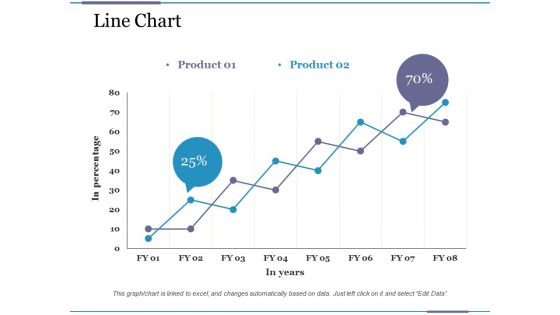
Line Chart Ppt PowerPoint Presentation Pictures File Formats
This is a line chart ppt powerpoint presentation pictures file formats. This is a two stage process. The stages in this process are business, financial, in percentage, in years, graph.
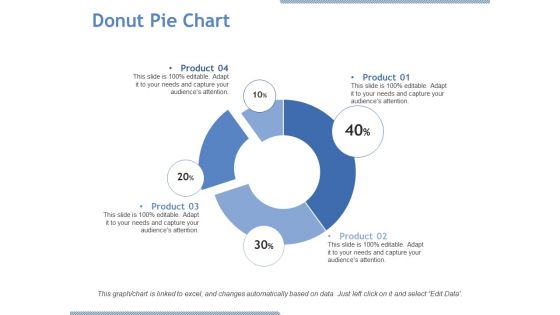
Donut Pie Chart Ppt PowerPoint Presentation Visual Aids Model
This is a donut pie chart ppt powerpoint presentation visual aids model. This is a four stage process. The stages in this process are product, percentage, finance, donut, business.
Column Chart Ppt PowerPoint Presentation Infographic Template Icon
This is a column chart ppt powerpoint presentation infographic template icon. This is a two stage process. The stages in this process are business, marketing, sales in percentage, financial year, graph.
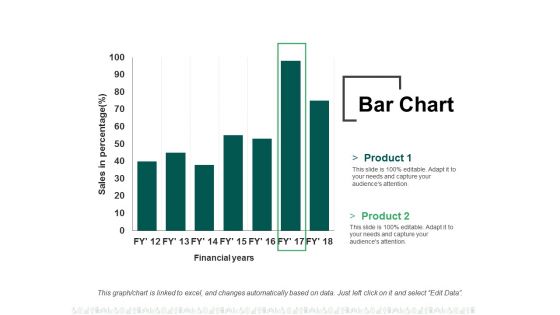
Bar Chart Ppt PowerPoint Presentation Summary File Formats
This is a bar chart ppt powerpoint presentation summary file formats. This is a two stage process. The stages in this process are business, finance, financial years, sales in percentage, graph.

Column Chart Ppt PowerPoint Presentation Layouts Graphic Images
This is a column chart ppt powerpoint presentation layouts graphic images. This is a two stage process. The stages in this process are business, finance, years, graph, expenditure in, marketing.
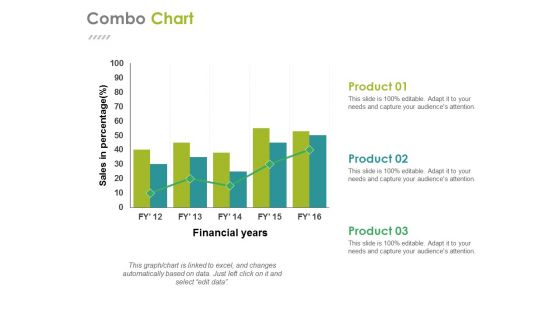
Combo Chart Ppt PowerPoint Presentation Gallery Design Ideas
This is a combo chart ppt powerpoint presentation gallery design ideas. This is a three stage process. The stages in this process are business, financial years, sales in percentage, finance, graph.
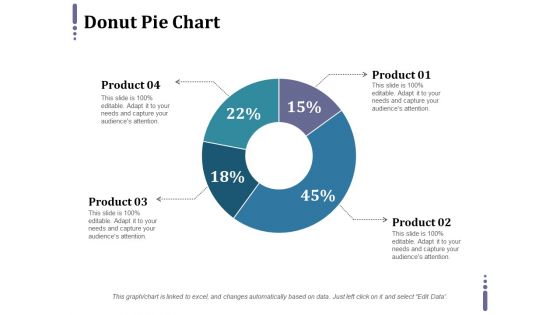
Donut Pie Chart Ppt PowerPoint Presentation Pictures Layout Ideas
This is a donut pie chart ppt powerpoint presentation pictures layout ideas. This is a four stage process. The stages in this process are percentage, finance, donut, business, product.
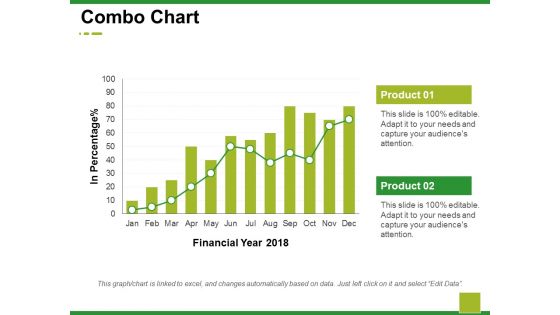
Combo Chart Ppt PowerPoint Presentation Summary Background Images
This is a combo chart ppt powerpoint presentation summary background images. This is a two stage process. The stages in this process are business, marketing, financial year, in percentage, graph.
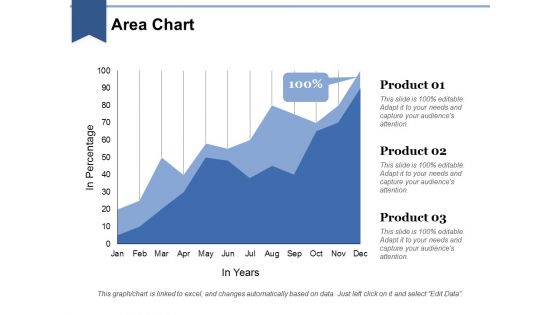
Area Chart Ppt PowerPoint Presentation Layouts Graphic Images
This is a area chart ppt powerpoint presentation layouts graphic images. This is a three stage process. The stages in this process are business, in years, marketing, in percentage, finance, graph.
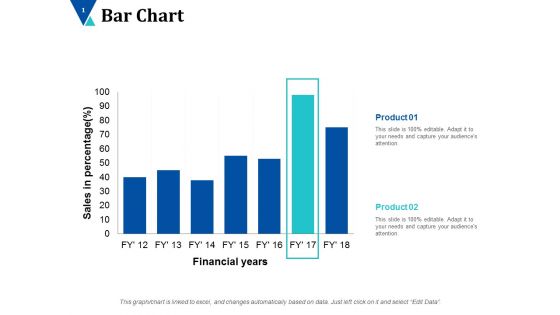
Bar Chart Finance Ppt PowerPoint Presentation Infographics Background Images
This is a bar chart finance ppt powerpoint presentation infographics background images. This is a seven stages process. The stages in this process are alpha testing, beta testing, full scale show.
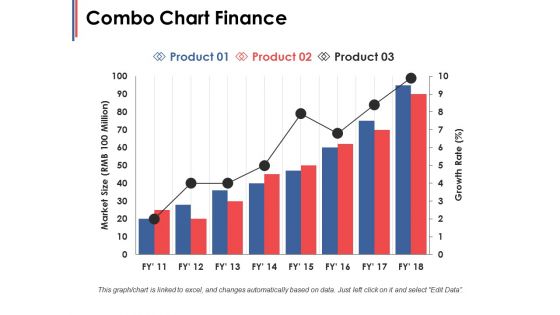
Combo Chart Finance Ppt PowerPoint Presentation Infographic Template Microsoft
This is a combo chart finance ppt powerpoint presentation infographic template microsoft. This is a three stage process. The stages in this process are finance, marketing, management, investment, analysis.
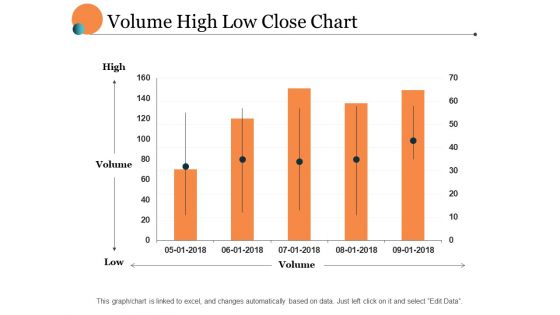
Volume High Low Close Chart Ppt PowerPoint Presentation Portfolio Layout
This is a volume high low close chart ppt powerpoint presentation portfolio layout. This is a five stage process. The stages in this process are finance, marketing, management, investment, analysis.
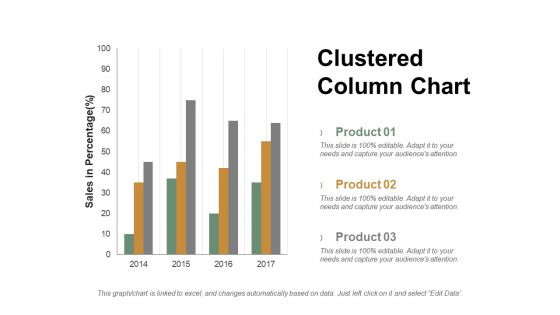
Clustered Column Chart Ppt PowerPoint Presentation Professional Ideas
This is a clustered column chart ppt powerpoint presentation professional ideas. This is a three stage process. The stages in this process are product, sales in percentage, column, years.
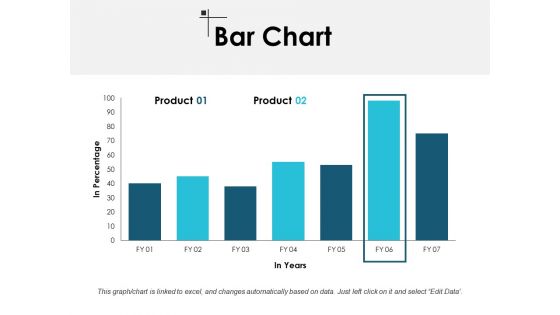
Bar Chart Finance Ppt PowerPoint Presentation Model Master Slide
This is a bar chart finance ppt powerpoint presentation model master slide. This is a two stage process. The stages in this process are finance, marketing, management, investment, analysis.
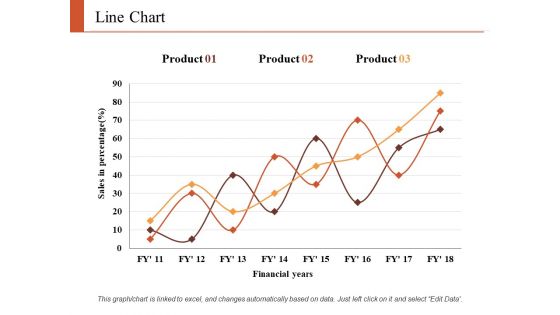
Line Chart Finance Ppt PowerPoint Presentation Infographic Template Graphics Tutorials
This is a line chart finance ppt powerpoint presentation infographic template graphics tutorials. This is a three stage process. The stages in this process are finance, marketing, analysis, business, investment.
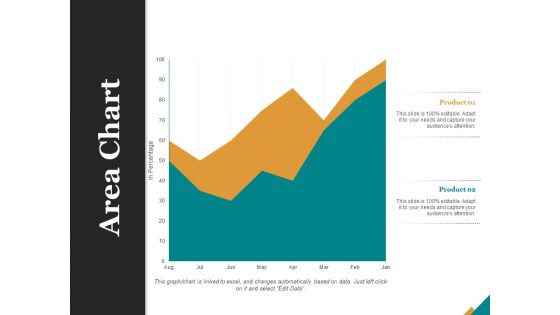
Area Chart Finance Ppt PowerPoint Presentation Summary Design Templates
This is a area chart finance ppt powerpoint presentation summary design templates. This is a two stage process. The stages in this process are finance, marketing, management, investment, analysis.
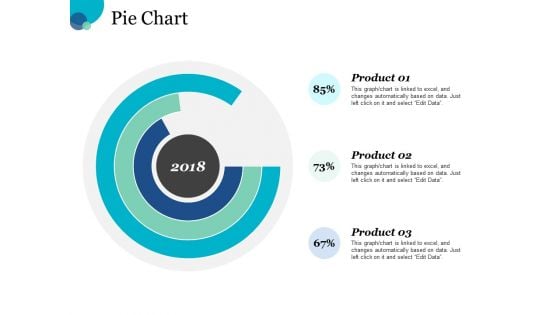
Pie Chart Finance Ppt PowerPoint Presentation Slides Graphic Images
This is a pie chart finance ppt powerpoint presentation slides graphic images. This is a three stage process. The stages in this process are finance, marketing, management, investment, analysis.
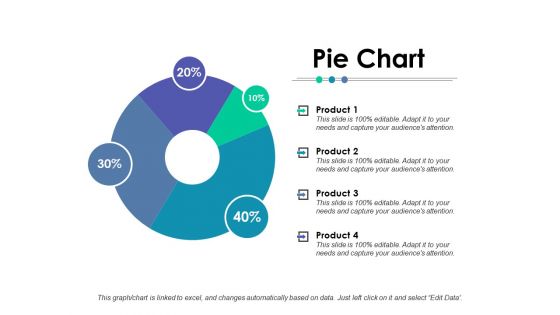
Pie Chart Finance Ppt PowerPoint Presentation Styles File Formats
This is a pie chart finance ppt powerpoint presentation styles file formats. This is a four stage process. The stages in this process are finance, analysis, business, investment, marketing.
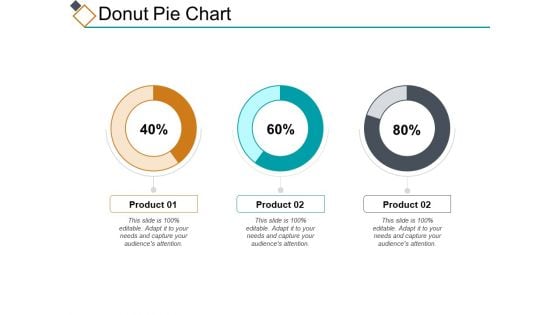
Donut Pie Chart Ppt PowerPoint Presentation Infographic Template Slides
This is a donut pie chart ppt powerpoint presentation infographic template slides. This is a three stage process. The stages in this process are percentage, product, business, management, marketing.
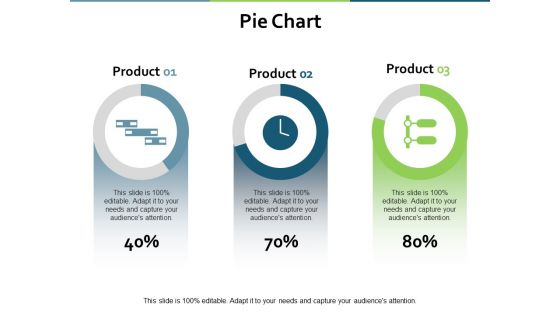
Pie Chart Marketing Finance Ppt PowerPoint Presentation Gallery Good
This is a pie chart marketing finance ppt powerpoint presentation gallery good. This is a three stage process. The stages in this process are finance, analysis, business, investment, marketing.
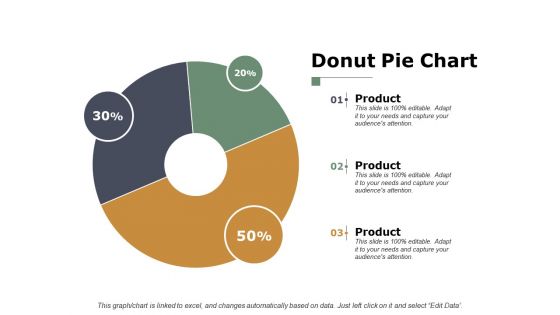
Donut Pie Chart Finance Ppt PowerPoint Presentation Inspiration Graphics
This is a donut pie chart finance ppt powerpoint presentation inspiration graphics. This is a three stage process. The stages in this process are finance, analysis, business, investment, marketing.
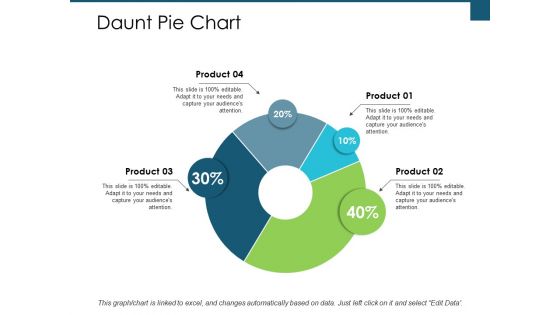
Daunt Pie Chart Investment Ppt PowerPoint Presentation Infographic Template Aids
This is a daunt pie chart investment ppt powerpoint presentation infographic template aids. This is a four stage process. The stages in this process are finance, analysis, business, investment, marketing.
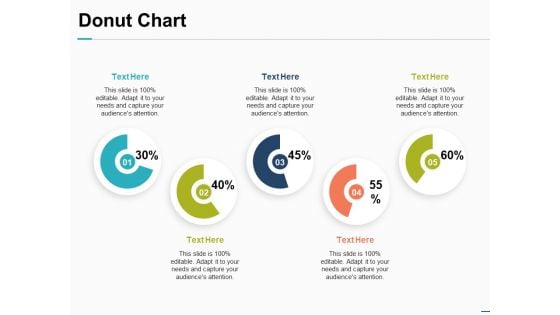
Donut Chart Financial Investment Ppt PowerPoint Presentation Inspiration Introduction
This is a donut chart financial investment ppt powerpoint presentation inspiration introduction. This is a five stage process. The stages in this process are finance, marketing, management, investment, analysis.


 Continue with Email

 Home
Home


