Investment Process
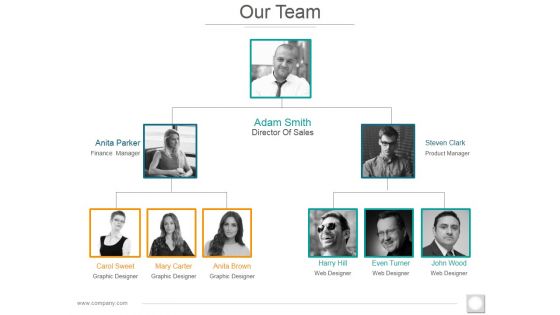
Our Team Template 1 Ppt PowerPoint Presentation Show Graphics
This is a our team template 1 ppt powerpoint presentation show graphics. This is a three stage process. The stages in this process are director of sales, product manager, finance manager, designer, graphic designer.
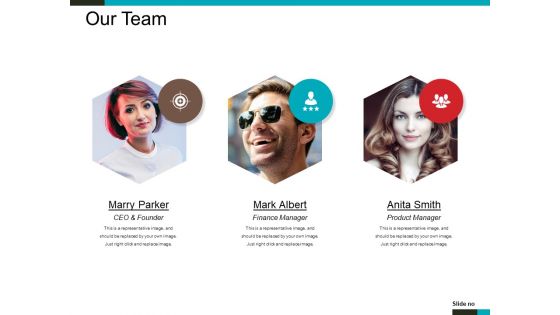
Our Team Ppt PowerPoint Presentation Slides Outfit
This is a our team ppt powerpoint presentation slides outfit. This is a three stage process. The stages in this process are ceo and founder, finance manager, product manager, team.

Our Team Ppt PowerPoint Presentation Inspiration Graphics Example
This is a our team ppt powerpoint presentation inspiration graphics example. This is a three stage process. The stages in this process are ceo and founder, finance manager, production manager.

Meet Our Team Ppt PowerPoint Presentation Portfolio Infographic Template
This is a meet our team ppt powerpoint presentation portfolio infographic template. This is a three stage process. The stages in this process are ceo and founder, finance manager, product manager, teamwork, communication.

Our Team Ppt PowerPoint Presentation Show Pictures
This is a our team ppt powerpoint presentation show pictures. This is a three stage process. The stages in this process are ceo and founder, finance manager, product manager.

Our Team Ppt Powerpoint Presentation Styles Format Ideas
This is a our team ppt powerpoint presentation styles format ideas. This is a four stage process. The stages in this process are our team, finance manager, product manager, director, ceo.
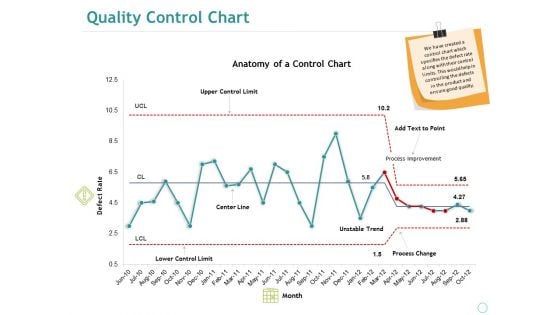
Quality Control Chart Ppt PowerPoint Presentation Summary Sample
This is a quality control chart ppt powerpoint presentation summary sample. This is a one stage process. The stages in this process are anatomy of a control chart, defect rate, upper control limit, center line, lower control limit.
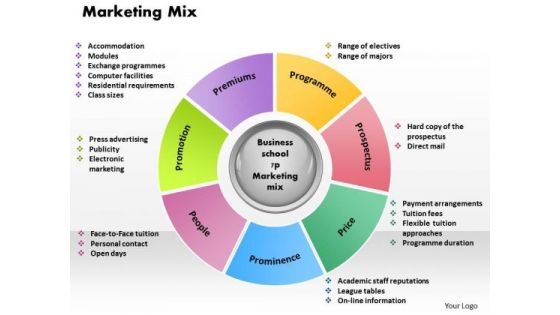
Business Framework Marketing Mix 2 PowerPoint Presentation
A multicolored and multistage circular process chart has been used to develop this business framework PPT. This template contains the concept of process flow for marketing strategy. Use this PPT and build a unique presentation for your viewers.
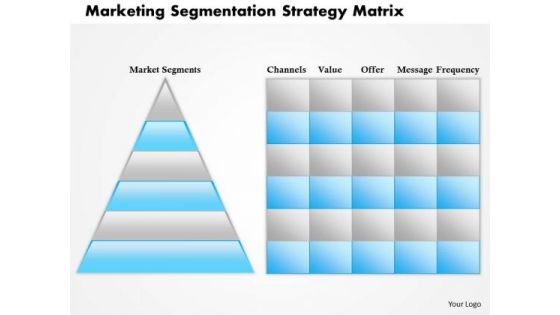
Business Framework Marketing Segmentation Strategy Matrix PowerPoint Presentation
Define marketing segmentation strategy with this business power point template. This power point template contains the graphic of triangle and matrix to display segmentation process. Use this PPT for marketing segmentation strategy and process related topics in any marketing presentation.
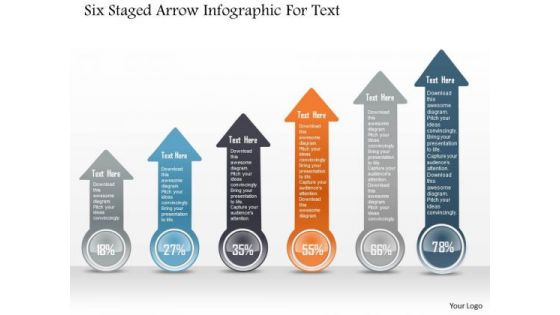
Business Diagram Six Staged Arrow Infographic For Text PowerPoint Template
Six staged colored arrow info graphics diagram has been used to craft this power point template. This PPT contains the concept of business process flow and information representation. Display any process flow in your presentation with this professional PPT slide.
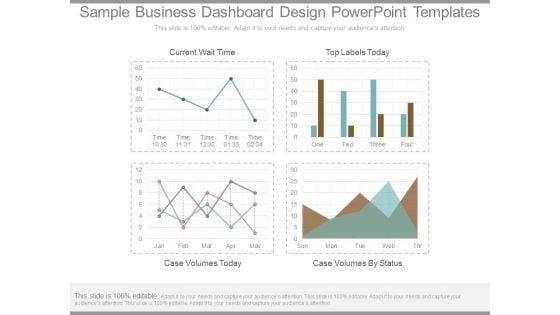
Sample Business Dashboard Design Powerpoint Templates
This is a sample business dashboard design powerpoint templates. This is a four stage process. The stages in this process are current wait time, top labels today, case volumes today, case volumes by status.
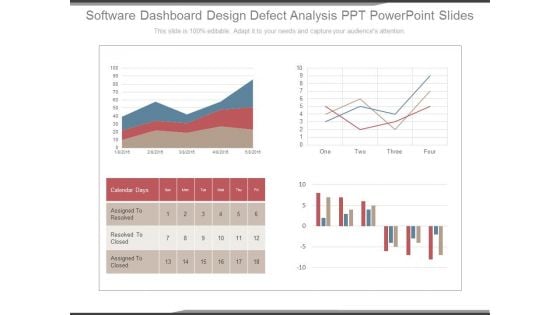
Software Dashboard Design Defect Analysis Ppt Powerpoint Slides
This is a software dashboard design defect analysis ppt powerpoint slides. This is a four stage process. The stages in this process are calendar days, assigned to resolved, resolved to closed, assigned to closed.
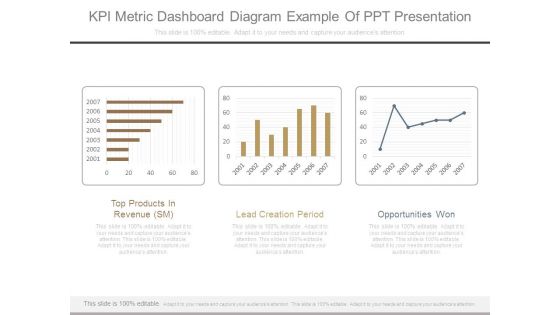
Kpi Metric Dashboard Diagram Example Of Ppt Presentation
This is a kpi metric dashboard diagram example of ppt presentation. This is a three stage process. The stages in this process are top products in revenue sm, lead creation period, opportunities won.
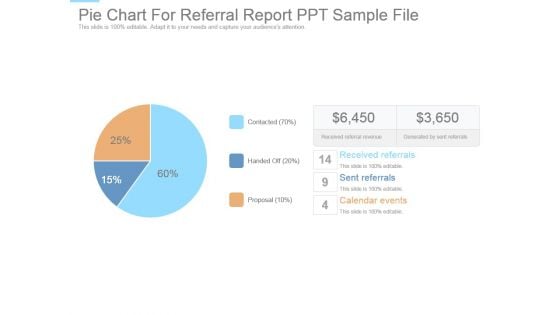
Pie Chart For Referral Report Ppt Sample File
This is a pie chart for referral report ppt sample file. This is a three stage process. The stages in this process are received referrals, sent referrals, calendar events, proposal, handed off, contacted, received referral revenue, generated by sent referrals.

Annual Report Project Plan Ppt Slide
This is a annual report project plan ppt slide. This is a one stage process. The stages in this process are financial statement, 10 k report, directors report, green annual report, auditors report, grey literature.

Vision And Mission PowerPoint Presentation Complete Deck With Slides
This is a vision and mission powerpoint presentation complete deck with slides. This is a one stage process. The stages in this process are vision, mission, target, strategy, competition.
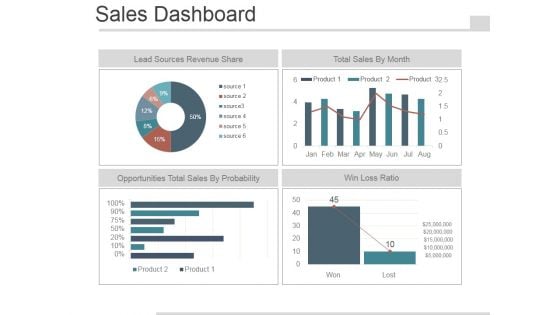
Sales Dashboard Slide Template 2 Ppt PowerPoint Presentation Images
This is a sales dashboard slide template 2 ppt powerpoint presentation images. This is a four stage process. The stages in this process are lead sources revenue share, total sales by month, opportunities total sales by probability, win loss ratio.

Marketing And Sales Strategy Business Plan Ppt PowerPoint Presentation Complete Deck With Slides
This is a marketing and sales strategy business plan ppt powerpoint presentation complete deck with slides. This is a one stage process. The stages in this process are sales, business, plan, marketing, strategy.

Company Marketing Analysis Report Ppt PowerPoint Presentation Complete Deck With Slides
Our Goal Ppt PowerPoint Presentation Inspiration Clipart Images
This is a our goal ppt powerpoint presentation inspiration clipart images. This is a two stage process. The stages in this process are our goals, target, success, business, achievement.
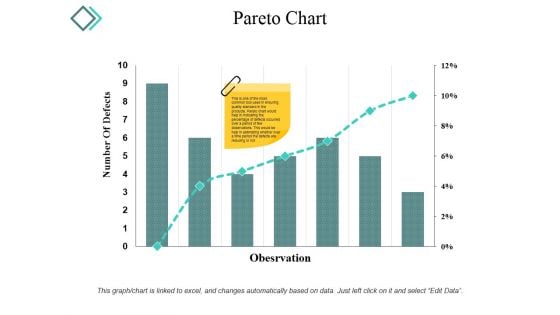
Pareto Chart Ppt PowerPoint Presentation Infographic Template Microsoft
This is a pareto chart ppt powerpoint presentation infographic template microsoft. This is a seven stage process. The stages in this process are number of defects, observation, graph, percentage, business.
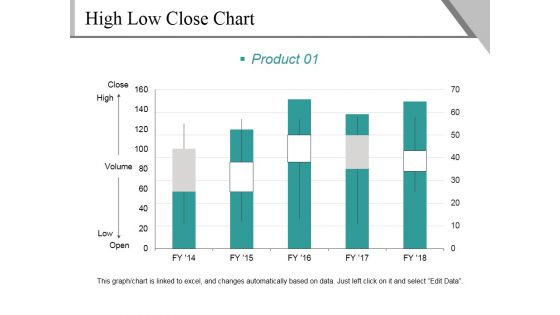
High Low Close Chart Template 1 Ppt PowerPoint Presentation Infographics Graphics Design
This is a high low close chart template 1 ppt powerpoint presentation infographics graphics design. This is a five stage process. The stages in this process are close, high, volume, low, open, product.
Bar Chart Ppt PowerPoint Presentation Icon Demonstration
This is a bar chart ppt powerpoint presentation icon demonstration. This is a seven stage process. The stages in this process are product, sales in percentage, financial year, graph.
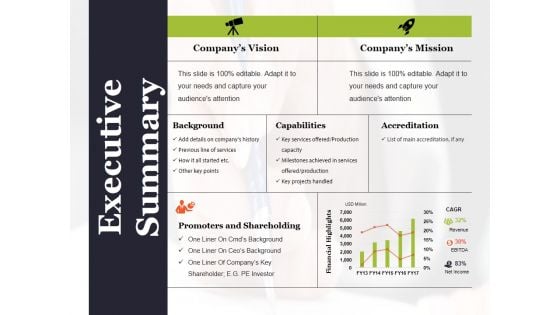
Executive Summary Ppt PowerPoint Presentation Summary Good
This is a executive summary ppt powerpoint presentation summary good. This is a seven stage process. The stages in this process are companys vision, companys mission, background, capabilities, accreditation.
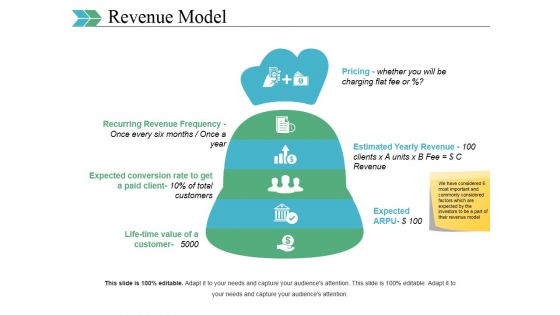
Revenue Model Ppt PowerPoint Presentation Layouts Graphics Tutorials
This is a revenue model ppt powerpoint presentation layouts graphics tutorials. This is a six stage process. The stages in this process are pricing, estimated yearly revenue, recurring revenue frequency, expected arpu.
Brand Tracking Info Graphics Ppt PowerPoint Presentation Infographics Slides
This is a brand tracking info graphics ppt powerpoint presentation infographics slides. This is a four stage process. The stages in this process are of consumers read, trust online reviews, user generated, look to online.
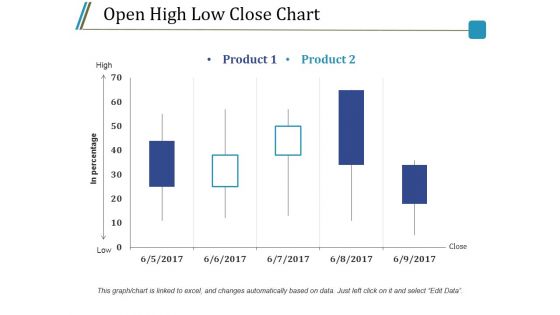
Open High Low Close Chart Ppt PowerPoint Presentation Styles Model
This is a open high low close chart ppt powerpoint presentation styles model. This is a five stage process. The stages in this process are product, high, low, in percentage, close.
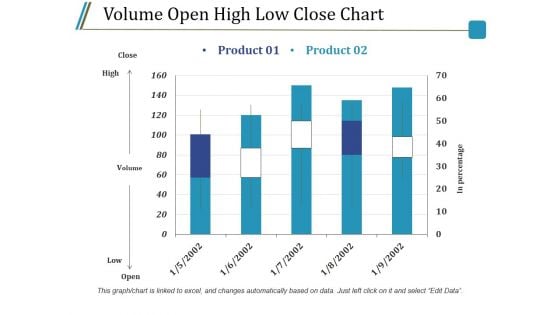
Volume Open High Low Close Chart Ppt PowerPoint Presentation Infographics Guide
This is a volume open high low close chart ppt powerpoint presentation infographics guide. This is a two stage process. The stages in this process are close, high, volume, low, open, product.
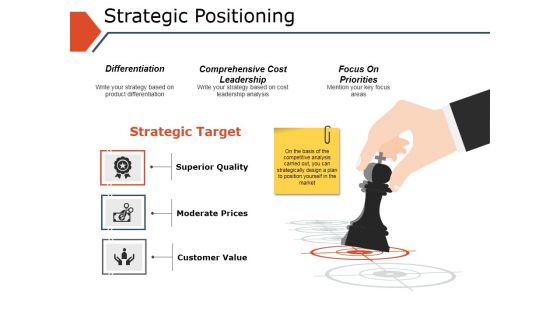
Strategic Positioning Ppt PowerPoint Presentation Model Portfolio
This is a strategic positioning ppt powerpoint presentation model portfolio. This is a three stage process. The stages in this process are superior quality, moderate prices, customer value, strategic target, differentiation.
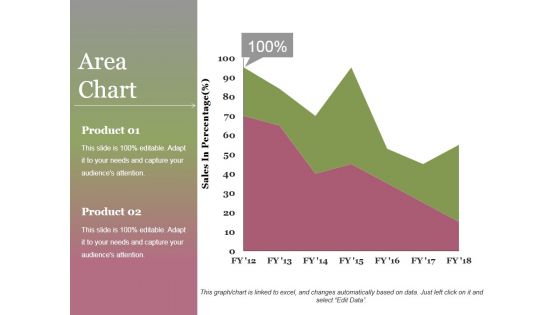
Area Chart Ppt PowerPoint Presentation Infographics File Formats
This is a area chart ppt powerpoint presentation infographics file formats. This is a two stage process. The stages in this process are area chart, product, sales in percentage, growth, success.
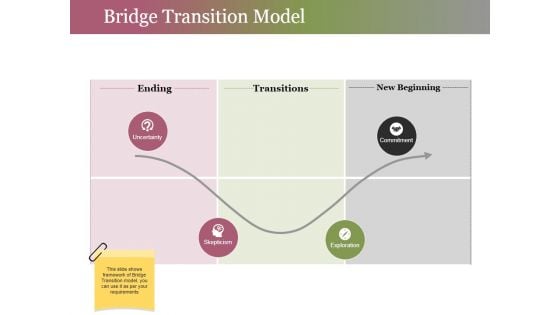
Bridge Transition Model Ppt PowerPoint Presentation Gallery Infographics
This is a bridge transition model ppt powerpoint presentation gallery infographics. This is a four stage process. The stages in this process are ending, transitions, new beginning, commitment, exploration.
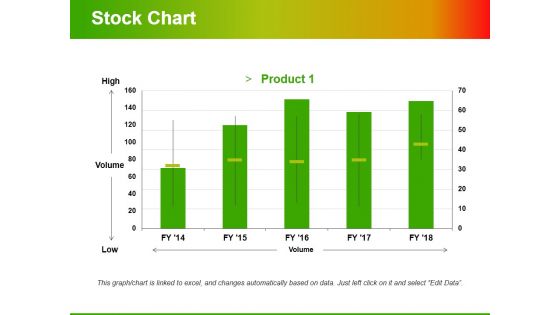
Stock Chart Template 2 Ppt PowerPoint Presentation Infographic Template Styles
This is a stock chart template 2 ppt powerpoint presentation infographic template styles. This is a one stage process. The stages in this process are high, volume, low, product, volume.

Key Metrics Ppt PowerPoint Presentation Professional Slideshow
This is a key metrics ppt powerpoint presentation professional slideshow. This is a five stage process. The stages in this process are new customers per month, on time delivery, customer satisfaction, lead conversion rate, customer retention rate.
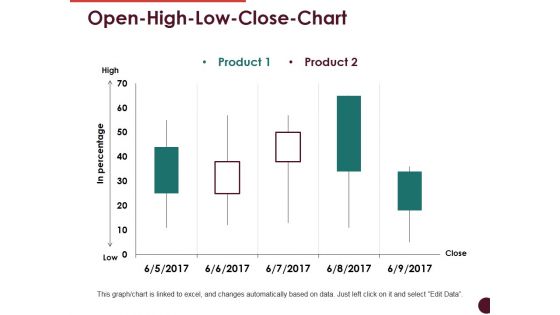
Open High Low Close Chart Ppt PowerPoint Presentation Professional Visuals
This is a open high low close chart ppt powerpoint presentation professional visuals. This is a two stage process. The stages in this process are high, low, in percentage, product, close.
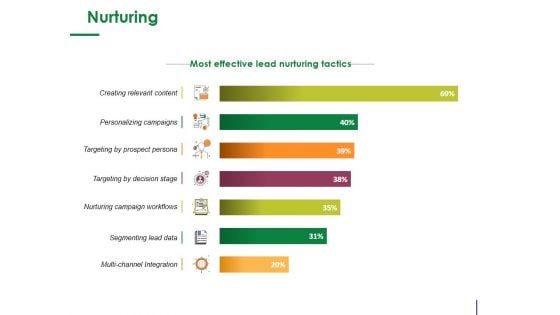
Nurturing Ppt PowerPoint Presentation Summary Images
This is a nurturing ppt powerpoint presentation summary images. This is a seven stage process. The stages in this process are segmenting lead data, creating relevant content, personalizing campaigns.
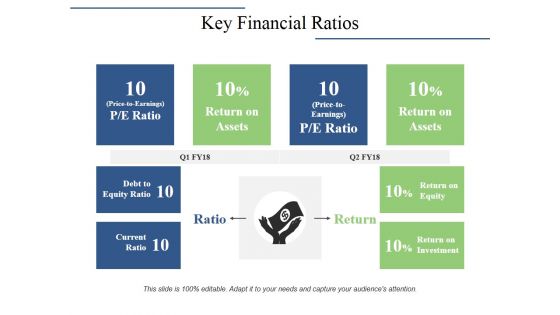
Key Financial Ratios Ppt PowerPoint Presentation Portfolio Background Image
This is a key financial ratios ppt powerpoint presentation portfolio background image. This is a four stage process. The stages in this process are debt to equity ratio, current ratio, return on assets, ratio, return.
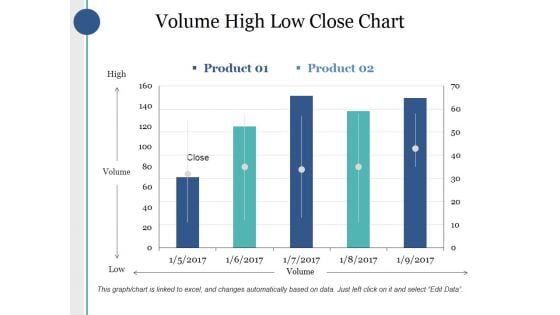
Volume High Low Close Chart Ppt PowerPoint Presentation Infographics Good
This is a volume high low close chart ppt powerpoint presentation infographics good. This is a two stage process. The stages in this process are high, volume, low, product, close.
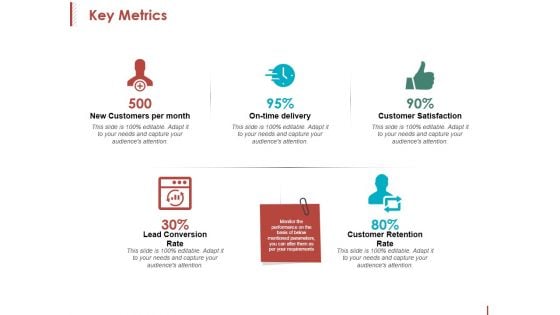
Key Metrics Ppt PowerPoint Presentation Inspiration Format
This is a key metrics ppt powerpoint presentation inspiration format. This is a five stage process. The stages in this process are new customers per month, on time delivery, customer satisfaction, customer retention rate.
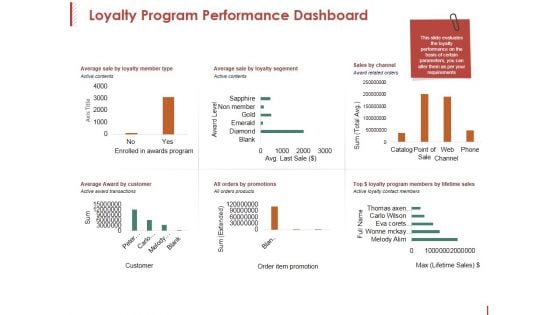
Loyalty Program Performance Dashboard Ppt PowerPoint Presentation Pictures Clipart
This is a loyalty program performance dashboard ppt powerpoint presentation pictures clipart. This is a six stage process. The stages in this process are axis title, award level, sum, active contents, channel.
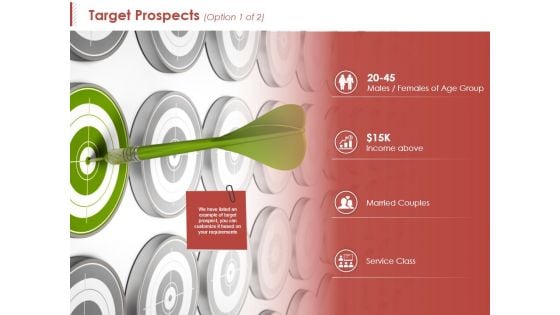
Target Prospects Template 1 Ppt PowerPoint Presentation Summary Portfolio
This is a target prospects template 1 ppt powerpoint presentation summary portfolio. This is a four stage process. The stages in this process are income above, married couples, service class, males, target prospects.
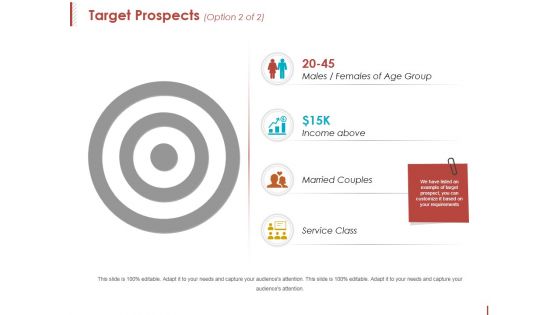
Target Prospects Template 2 Ppt PowerPoint Presentation Slides Templates
This is a target prospects template 2 ppt powerpoint presentation slides templates. This is a four stage process. The stages in this process are males, income above, married couples, service class.
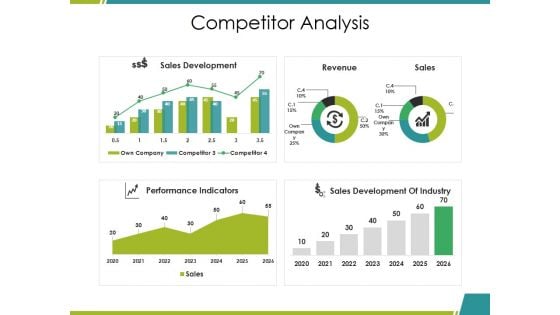
Competitor Analysis Ppt PowerPoint Presentation Inspiration Ideas
This is a competitor analysis ppt powerpoint presentation inspiration ideas. This is a four stage process. The stages in this process are sales development, performance indicators, revenue, sales, sales development of industry.
Sales Kpi Tracker Ppt PowerPoint Presentation Layout
This is a sales kpi tracker ppt powerpoint presentation layout. This is a six stage process. The stages in this process are leads created, sales ratio, opportunities won, top products in revenue, actual.
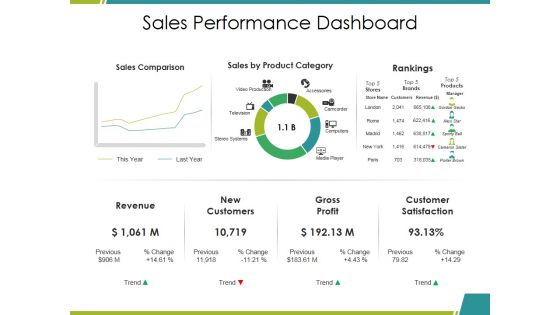
Sales Performance Dashboard Ppt PowerPoint Presentation Infographics Mockup
This is a sales performance dashboard ppt powerpoint presentation infographics mockup. This is a three stage process. The stages in this process are sales comparison, sales by product category, rankings, revenue, gross profit.
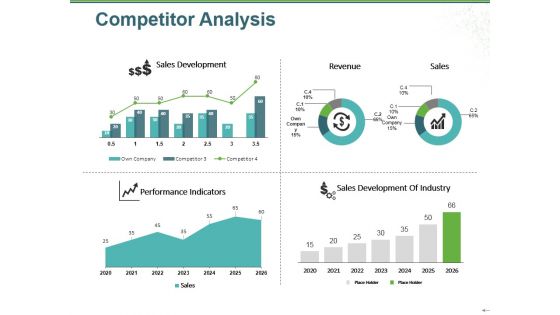
Competitor Analysis Ppt PowerPoint Presentation Pictures Visuals
This is a competitor analysis ppt powerpoint presentation pictures visuals. This is a four stage process. The stages in this process are sales development, performance indicators, sales development of industry, sales, revenue.
Highlights Ppt PowerPoint Presentation Icon Infographics
This is a highlights ppt powerpoint presentation icon infographics. This is a five stage process. The stages in this process are countries, stores worldwide, total revenue, associates, monthly website visitors.
Our Main Goal Ppt PowerPoint Presentation Pictures Background
This is a our main goal ppt powerpoint presentation pictures background. This is a one stage process. The stages in this process are our goals, target, success, business, achievement.
Sales Kpi Tracker Ppt PowerPoint Presentation Gallery Shapes
This is a sales kpi tracker ppt powerpoint presentation gallery shapes. This is a six stage process. The stages in this process are target growth, leads created, sales ratio, last year, stretched growth.
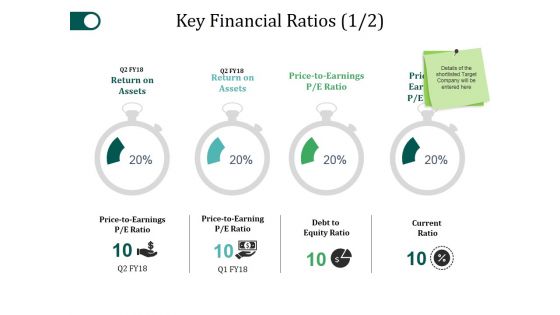
Key Financial Ratios Template 1 Ppt PowerPoint Presentation Layouts Pictures
This is a key financial ratios template 1 ppt powerpoint presentation layouts pictures. This is a four stage process. The stages in this process are return on assets, debt to equity ratio, current ratio, price to earnings.
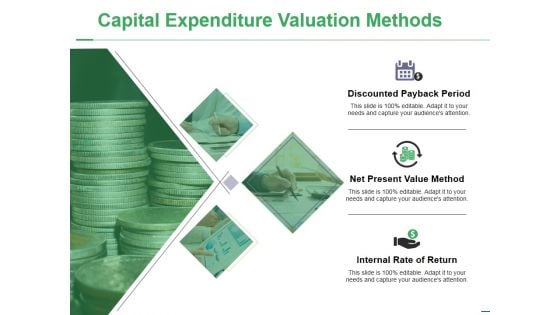
Capital Expenditure Valuation Methods Ppt PowerPoint Presentation File Background Images
This is a capital expenditure valuation methods ppt powerpoint presentation file background images. This is a three stage process. The stages in this process are discounted payback period, net present value method, internal rate of return.
Competitive Analysis Module Ppt PowerPoint Presentation Complete Deck With Slides
This is a competitive analysis module ppt powerpoint presentation complete deck with slides. This is a one stage process. The stages in this process are competition, analysis, marketing, strategy, business.
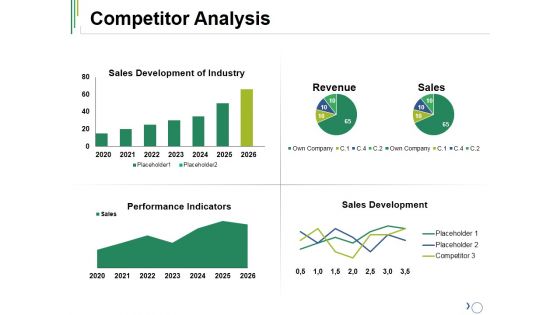
Competitor Analysis Ppt PowerPoint Presentation File Influencers
This is a competitor analysis ppt powerpoint presentation file influencers. This is a four stage process. The stages in this process are revenue, sales, placeholder, performance indicators, sales development.
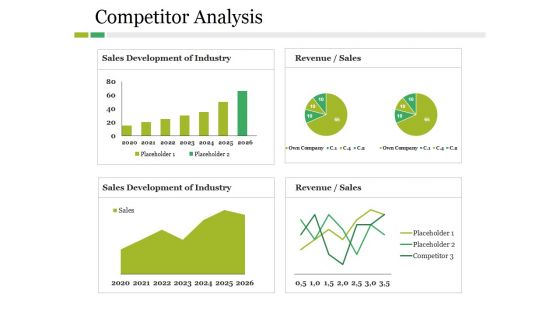
Competitor Analysis Ppt PowerPoint Presentation File Graphics Example
This is a competitor analysis ppt powerpoint presentation file graphics example. This is a four stage process. The stages in this process are revenue, sales development of industry, own company, placeholder, competitor.
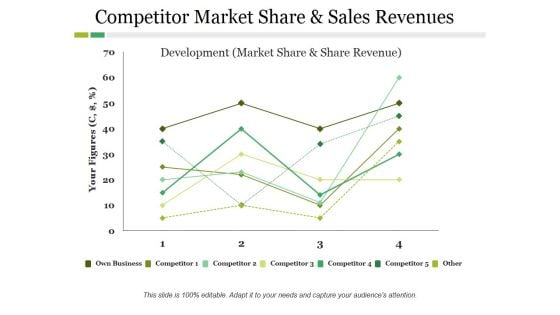
Competitor Market Share And Sales Revenues Ppt PowerPoint Presentation Ideas Slide
This is a competitor market share and sales revenues ppt powerpoint presentation ideas slide. This is a four stage process. The stages in this process are competitor, development, own business, your figures.
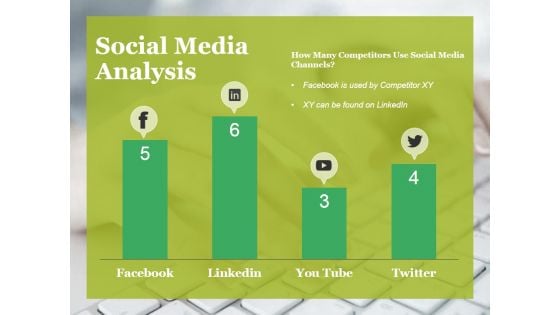
Social Media Analysis Ppt PowerPoint Presentation Infographics Samples
This is a social media analysis ppt powerpoint presentation infographics samples. This is a four stage process. The stages in this process are facebook, linkedin, twitter, you tube, social media.
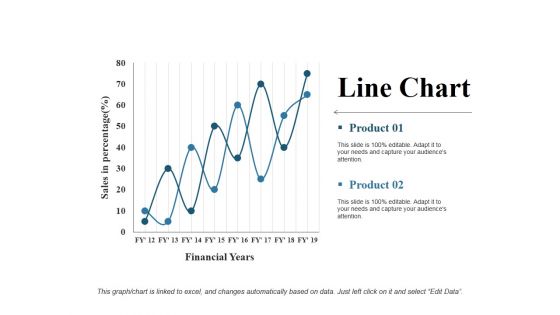
Line Chart Ppt PowerPoint Presentation Gallery Rules
This is a line chart ppt powerpoint presentation gallery rules. This is a two stage process. The stages in this process are financial years, product, sales in percentage, line chart, growth.
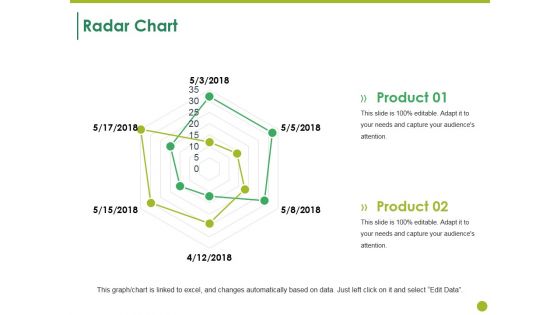
Radar Chart Ppt PowerPoint Presentation Summary Design Templates
This is a radar chart ppt powerpoint presentation summary design templates. This is a two stage process. The stages in this process are radar chart, product, shapes, business, marketing.
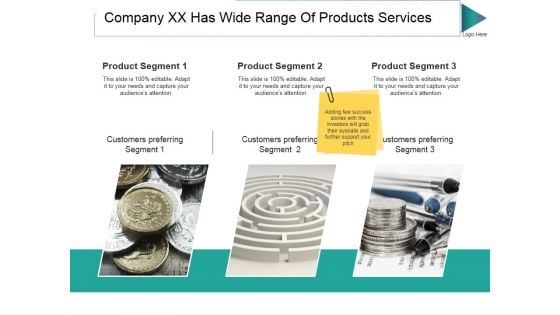
Company Xx Has Wide Range Of Products Services Ppt PowerPoint Presentation Professional Graphics Template
This is a company xx has wide range of products services ppt powerpoint presentation professional graphics template. This is a three stage process. The stages in this process are product segment, customers preferring segment, currency.
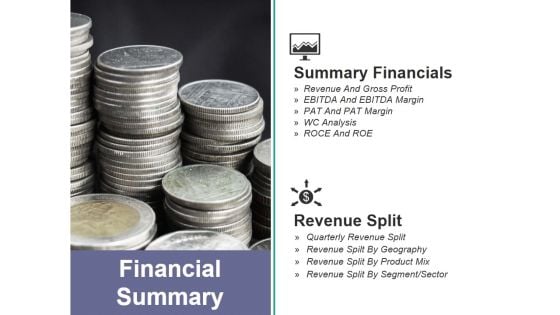
Financial Summary Ppt PowerPoint Presentation Infographic Template Design Inspiration
This is a financial summary ppt powerpoint presentation infographic template design inspiration. This is a two stage process. The stages in this process are summary financials, revenue split, financial summary, revenue and gross profit, wc analysis.

Geographic Expansion Inorganic Opportunity Ppt PowerPoint Presentation Pictures Maker
This is a geographic expansion inorganic opportunity ppt powerpoint presentation pictures maker. This is a two stage process. The stages in this process are overview, infrastructure, key points, location, benefits.


 Continue with Email

 Home
Home


