Marketing Promotional Plan
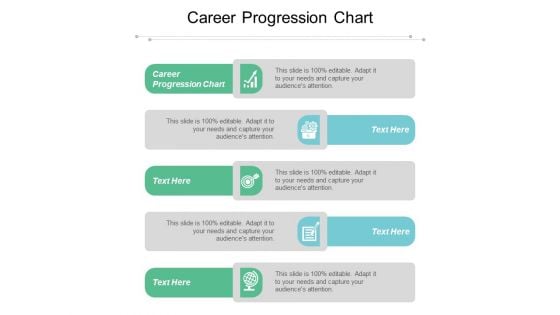
Career Progression Chart Ppt PowerPoint Presentation Styles Background Image Cpb
This is a career progression chart ppt powerpoint presentation styles background image cpb. This is a five stage process. The stages in this process are career progression chart.
Charting Business Ppt PowerPoint Presentation Show Design Ideas Cpb
This is a charting business ppt powerpoint presentation show design ideas cpb. This is a two stage process. The stages in this process are charting business.
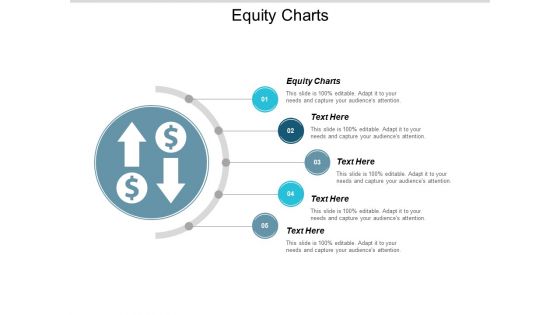
Equity Charts Ppt PowerPoint Presentation Show Designs Download Cpb
This is a equity charts ppt powerpoint presentation show designs download cpb. This is a five stage process. The stages in this process are equity charts.
Financial Chart Analysis Ppt PowerPoint Presentation Icon Vector Cpb
This is a financial chart analysis ppt powerpoint presentation icon vector cpb. This is a four stage process. The stages in this process are financial chart analysis.
Business Org Chart Ppt PowerPoint Presentation Pictures Skills Cpb
This is a business org chart ppt powerpoint presentation pictures skills cpb. This is a three stage process. The stages in this process are business org chart.
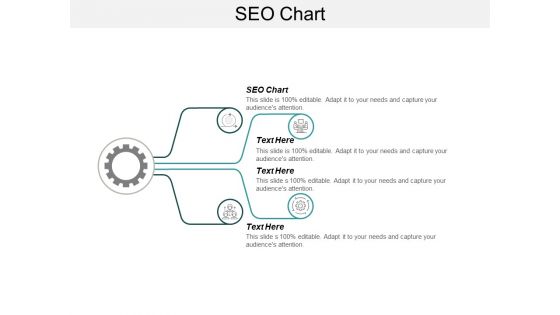
SEO Chart Ppt PowerPoint Presentation File Example File Cpb
This is a seo chart ppt powerpoint presentation file example file cpb. This is a four stage process. The stages in this process are seo chart.
Executive Transfer Icon With Two Circular Arrows And Dollar Symbol Ppt PowerPoint Presentation Gallery Visual Aids PDF
Persuade your audience using this executive transfer icon with two circular arrows and dollar symbol ppt powerpoint presentation gallery visual aids pdf. This PPT design covers three stages, thus making it a great tool to use. It also caters to a variety of topics including executive transfer icon with two circular arrows and dollar symbol. Download this PPT design now to present a convincing pitch that not only emphasizes the topic but also showcases your presentation skills.
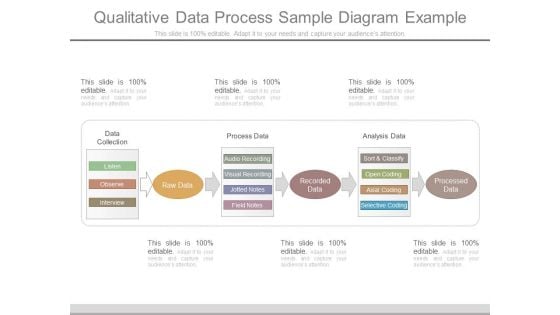
Qualitative Data Process Sample Diagram Example
This is a qualitative data process sample diagram example. This is a three stage process. The stages in this process are data collection, process data, analysis data, listen, observe, interview, audio recording, visual recording, jotted notes, field notes, sort and classify, open coding, axial coding, selective coding, processed data.

Pitch Deck For Fund Raising From Series C Funding Key Senior Level Executives With Designations Infographics PDF
This slide show the various members of the company and a structural team along with their job responsibility details and image. This is a pitch deck for fund raising from series c funding key senior level executives with designations infographics pdf template with various stages. Focus and dispense information on four stages using this creative set, that comes with editable features. It contains large content boxes to add your information on topics like key senior level executives with designations. You can also showcase facts, figures, and other relevant content using this PPT layout. Grab it now.
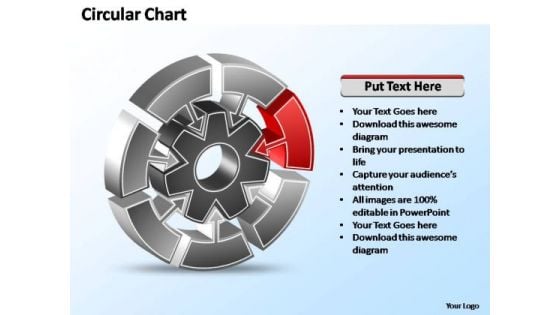
PowerPoint Template Company Interconnected Circular Chart Ppt Slide
Analyze the seven success factors of your business with this circular business chart for Microsoft PowerPoint presentations Our PowerPoint Template Company Interconnected Circular Chart Ppt Slide are great for busy people. They automatically highlight the sequence of events you desire.
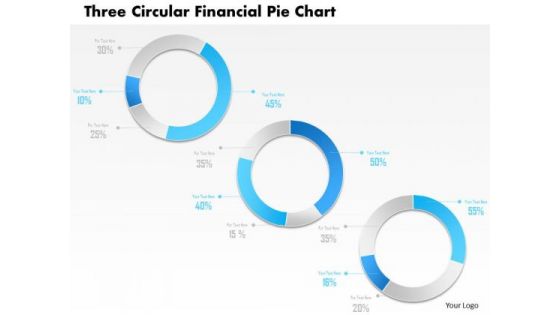
Business Diagram Three Circular Financial Pie Chart PowerPoint Template
This power point template has been designed with graphic of three circular pie chart. This pie chart is suitable for financial data representation. Use this PPt for your business and finance related presentations.
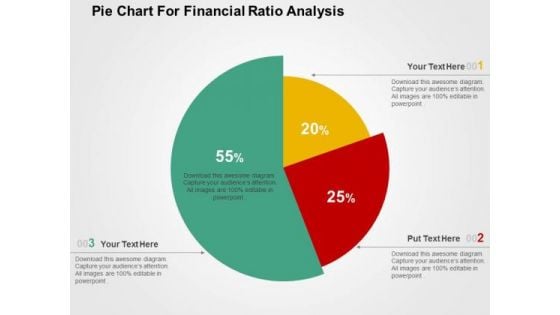
Pie Chart For Financial Ratio Analysis PowerPoint Templates
Create visually amazing presentations with this slide of pie chart. This PPT slide of pie chart for financial ratio analysis. Add this diagram in your presentations to visually support your content.
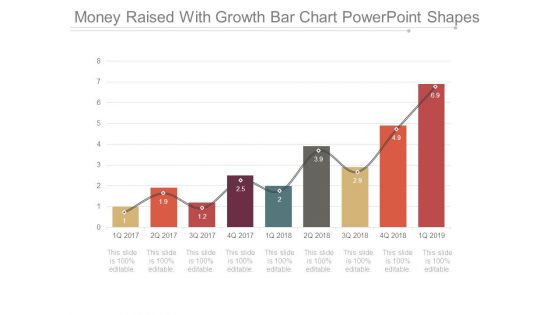
Money Raised With Growth Bar Chart Powerpoint Shapes
This is a money raised with growth bar chart powerpoint shapes. This is a nine stage process. The stages in this process are bar chart, growth, business, success, management.
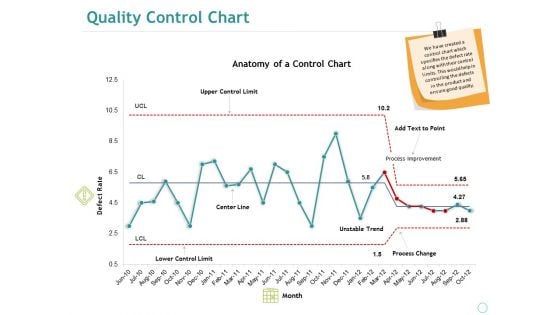
Quality Control Chart Ppt PowerPoint Presentation Summary Sample
This is a quality control chart ppt powerpoint presentation summary sample. This is a one stage process. The stages in this process are anatomy of a control chart, defect rate, upper control limit, center line, lower control limit.
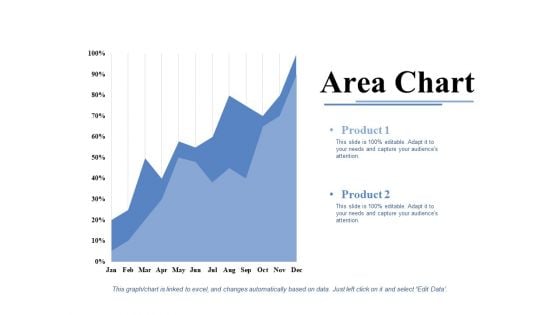
Area Chart Ppt PowerPoint Presentation Infographic Template Model
This is a area chart ppt powerpoint presentation infographic template model. This is a two stage process. The stages in this process are product, area chart, growth, percentage, success.
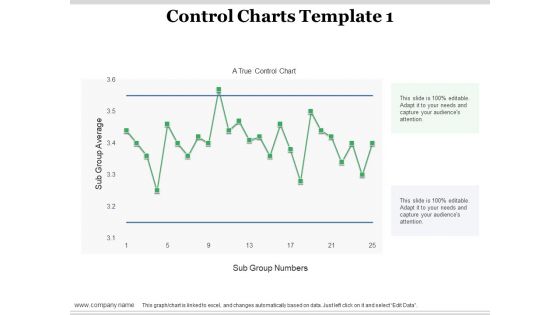
Control Charts Average Ppt PowerPoint Presentation Ideas Demonstration
This is a control charts average ppt powerpoint presentation ideas demonstration. This is a one stage process. The stages in this process are control charts, sub group average, sub group numbers, finance, business.
Business Diagram 8 Staged Circle Chart With Icons Presentation Template
This is an amazing diagram to explain process by dissolving the stages of a process, or by depicting how process works. This is an excellent diagram which enhances the essence of your viable ideas. Use it to organize the logic of your views.
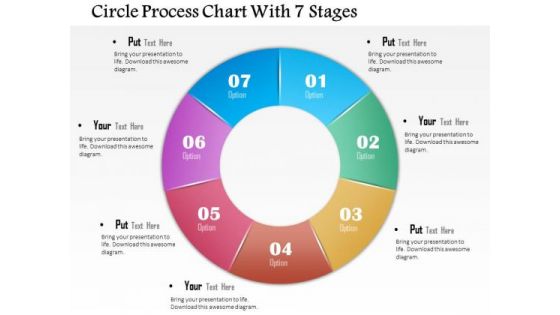
Business Diagram Circle Process Chart With 7 Stages Presentation Template
The structure of this diagram allows you to effectively highlight the key issues concerning the growth of your business through circle Process. Adjust the above diagram into your presentations to visually support your contents.
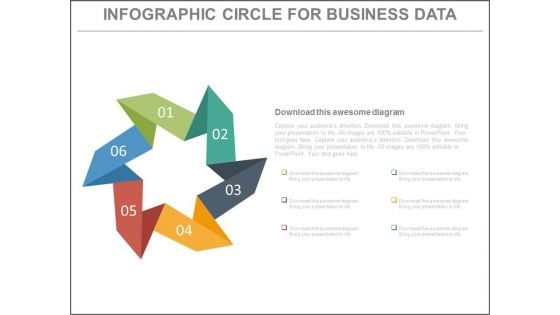
Six Steps Circular Chart For Workflow Powerpoint Slides
This business slide contains circular infographic design. This diagram provides schematic representation of any information. Visual effect this slide helps in maintaining the flow of the discussion and provides more clarity to the subject.
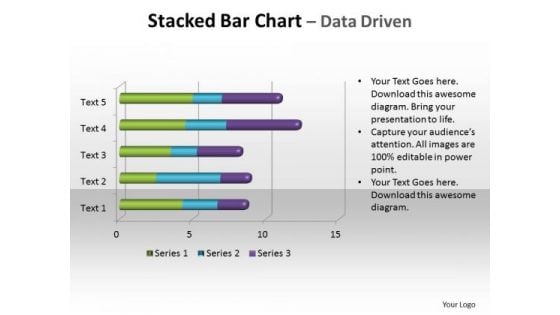
Business Graphic PowerPoint Templates Business Stacked Bar Chart Ppt Slides
Business Graphic PowerPoint Templates Business stacked bar chart PPT Slides-You can use a 100% stacked column chart when you have three or more data series and you want to emphasize the contributions to the whole, especially if the total is the same for each category. . -Business Graphic PowerPoint Templates Business stacked bar chart PPT Slides-This ppt can be used for concepts relating to-Bar, Block, Business, Chart, Color, Colour, Column, Decline, Fill, Finance, Financial, Graph etc. Make your audience listen and observe with our Business Graphic PowerPoint Templates Business Stacked Bar Chart Ppt Slides. You will be at the top of your game.
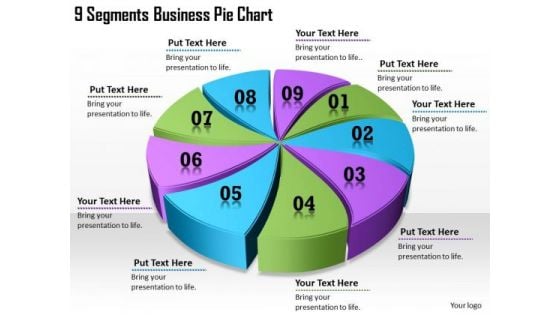
Timeline Ppt Template 9 Segments Business Pie Chart
Our Timeline Ppt Template 9 Segments Business Pie Chart Powerpoint Templates Leave No One In Doubt. Provide A Certainty To Your Views.
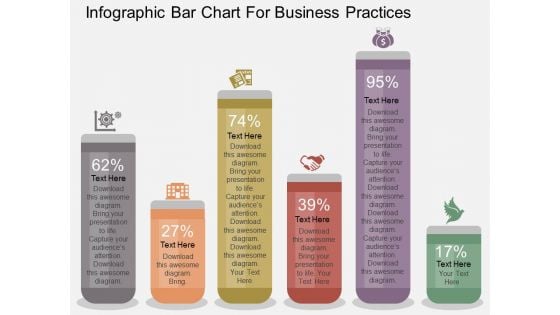
Infographic Bar Chart For Business Practices Powerpoint Template
The PowerPoint template displays infographic of bar chart. This diagram has been professionally designed to display business practices. Grab centre stage with this diagram slide.
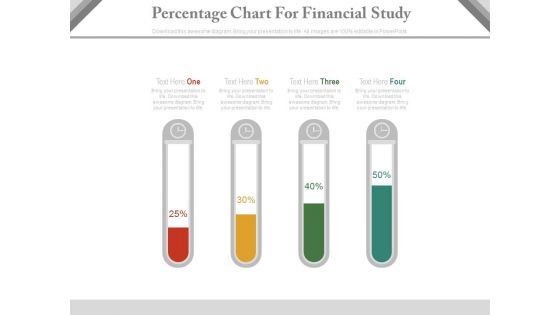
Test Tubes Percentage Chart For Financial Analysis Powerpoint Slides
This PPT slide contains test tubes percentage chart. You may download this PowerPoint template for financial analysis in your presentations. Make outstanding business presentation with this template.
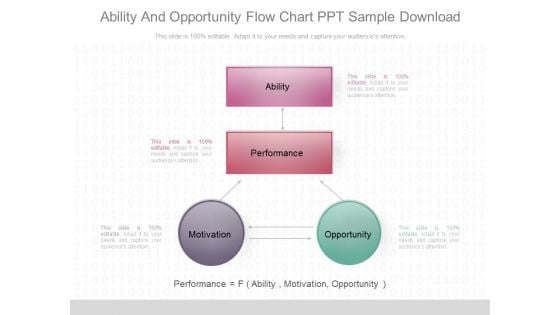
Ability And Opportunity Flow Chart Ppt Sample Download
This is a ability and opportunity flow chart ppt sample download. This is a four stage process. The stages in this process are ability, performance, motivation, opportunity.
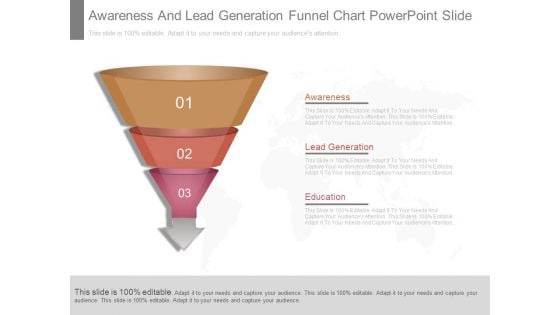
Awareness And Lead Generation Funnel Chart Powerpoint Slide
This is a awareness and lead generation funnel chart powerpoint slide. This is a three stage process. The stages in this process are awareness, lead generation, education.

Financial Information Systems Chart Example Of Ppt Presentation
This is a financial information systems chart example of ppt presentation. This is a three stage process. The stages in this process are process, people, value, technology.
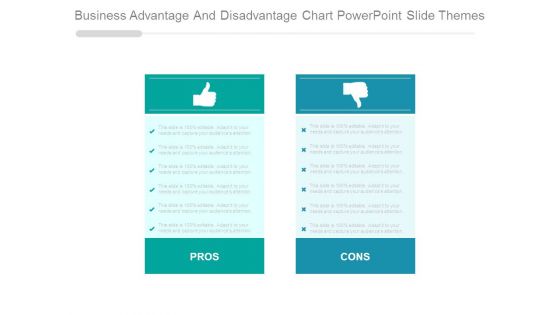
Business Advantage And Disadvantage Chart Powerpoint Slide Themes
This is a business advantage and disadvantage chart powerpoint slide themes. This is a two stage process. The stages in this process are pros, cons.
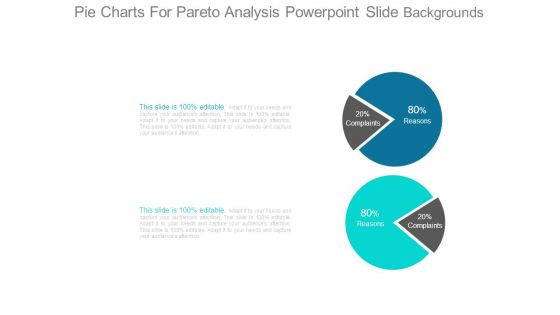
Pie Charts For Pareto Analysis Powerpoint Slide Backgrounds
This is a pie charts for pareto analysis powerpoint slide backgrounds. This is a two stage process. The stages in this process are reasons, complaints.
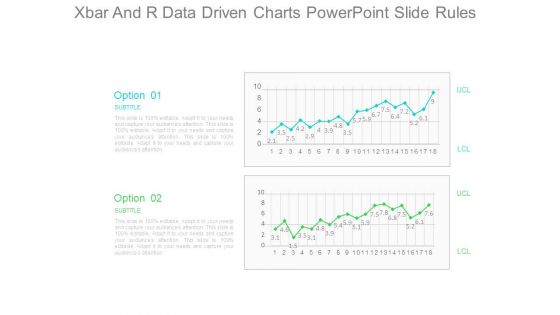
Xbar And R Data Driven Charts Powerpoint Slide Rules
This is a xbar and r data driven charts powerpoint slide rules. This is a two stage process. The stages in this process are option, subtitle, lcl, ucl.
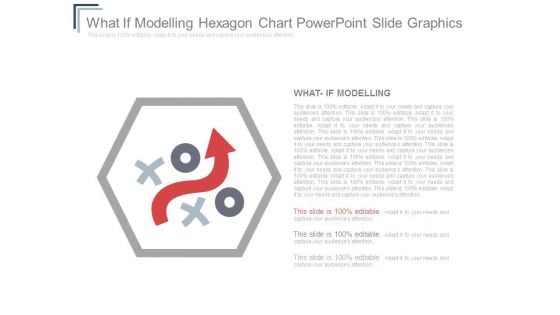
What If Modelling Hexagon Chart Powerpoint Slide Graphics
This is a what if modelling hexagon chart powerpoint slide graphics. This is a three stage process. The stages in this process are what if modelling.
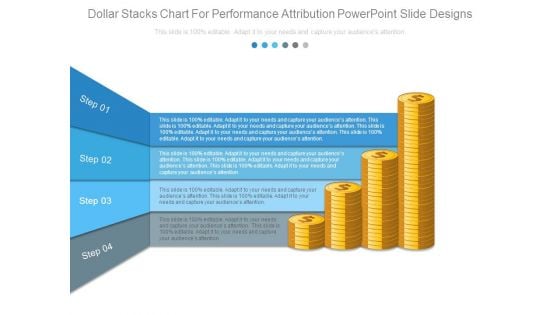
Dollar Stacks Chart For Performance Attribution Powerpoint Slide Designs
This is a dollar stacks chart for performance attribution powerpoint slide designs. This is a four stage process. The stages in this process are step.
Corporate Over View Three Steps Chart Ppt Icon
This is a corporate over view three steps chart ppt icon. This is a three stage process. The stages in this process are value, vision, mission.
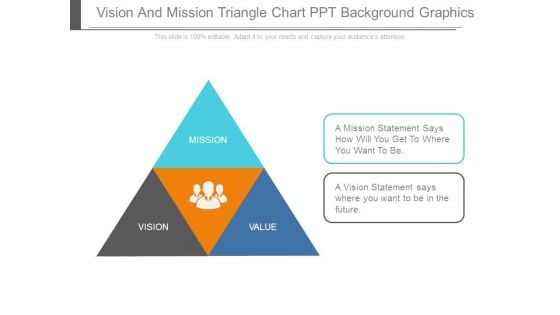
Vision And Mission Triangle Chart Ppt Background Graphics
This is a vision and mission triangle chart ppt background graphics. This is a three stage process. The stages in this process are mission, value, vision.
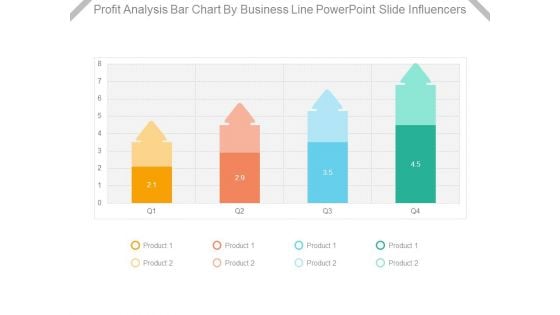
Profit Analysis Bar Chart By Business Line Powerpoint Slide Influencers
This is a profit analysis bar chart by business line powerpoint slide influencers. This is a four stage process. The stages in this process are product.
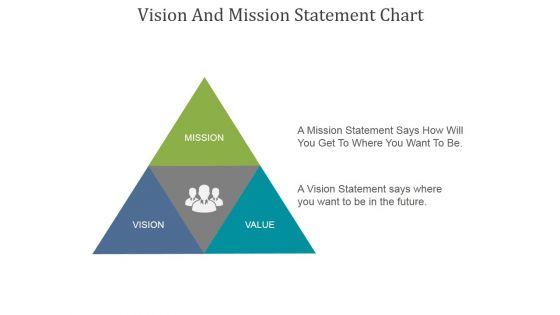
Vision And Mission Statement Chart Ppt PowerPoint Presentation Deck
This is a vision and mission statement chart ppt powerpoint presentation deck. This is a three stage process. The stages in this process are mission, vision, value.
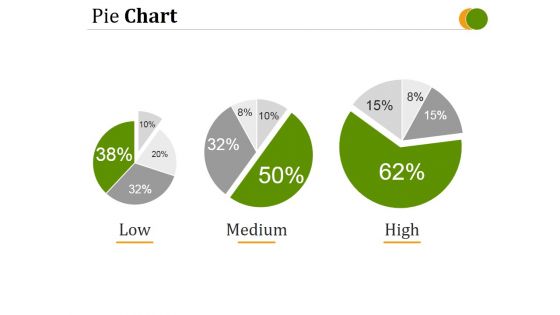
Pie Chart Template 1 Ppt PowerPoint Presentation Deck
This is a pie chart template 1 ppt powerpoint presentation deck. This is a three stage process. The stages in this process are low, medium, high.
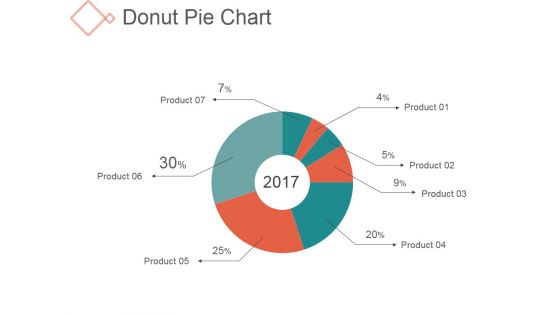
Donut Pie Chart Ppt PowerPoint Presentation Background Images
This is a donut pie chart ppt powerpoint presentation background images. This is a seven stage process. The stages in this process are management, business, finance, percentage.
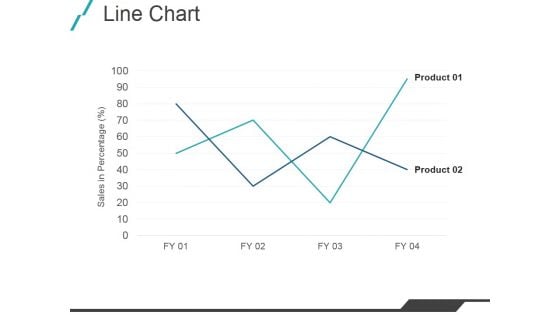
Line Chart Ppt PowerPoint Presentation Model Example File
This is a line chart ppt powerpoint presentation model example file. This is a two stage process. The stages in this process are product, graph, growth, management.
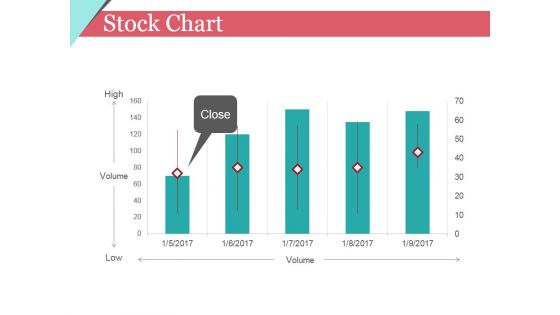
Stock Chart Ppt PowerPoint Presentation Infographic Template Clipart Images
This is a stock chart ppt powerpoint presentation infographic template clipart images. This is a five stage process. The stages in this process are high, volume, low, close.
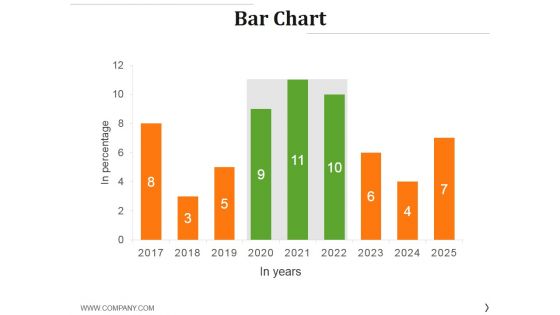
Bar Chart Ppt PowerPoint Presentation Styles Graphics Example
This is a bar chart ppt powerpoint presentation styles graphics example. This is a nine stage process. The stages in this process are graph, growth, success, business, finance.
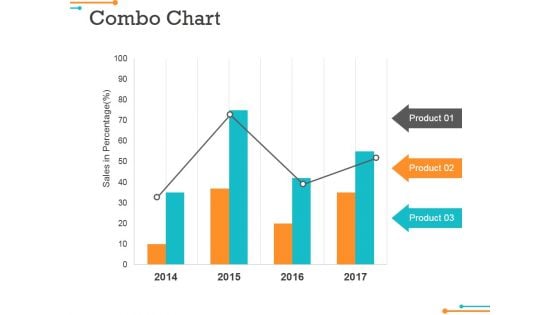
Combo Chart Ppt Powerpoint Presentation Infographic Template File Formats
This is a combo chart ppt powerpoint presentation infographic template file formats. This is a four stage process. The stages in this process are product, growth, management, business.
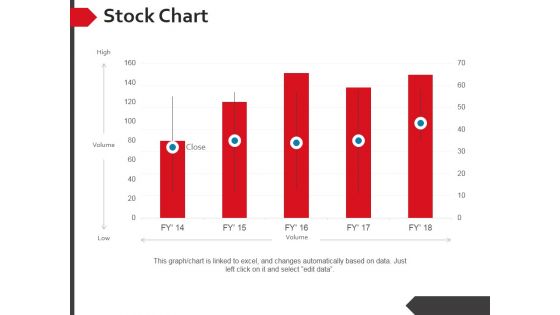
Stock Chart Ppt PowerPoint Presentation Summary Background Designs
This is a stock chart ppt powerpoint presentation summary background designs. This is a five stage process. The stages in this process are high, volume, low.
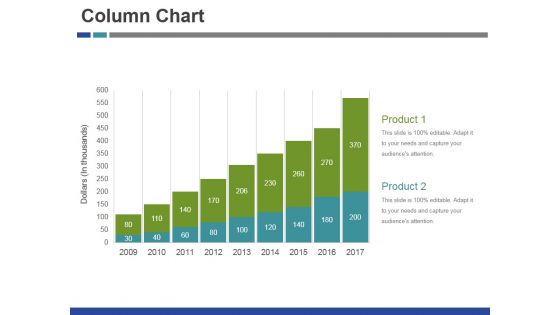
Column Chart Ppt PowerPoint Presentation Infographic Template Layouts
This is a column chart ppt powerpoint presentation infographic template layouts. This is a nine stage process. The stages in this process are product, growth, success, business, graph.
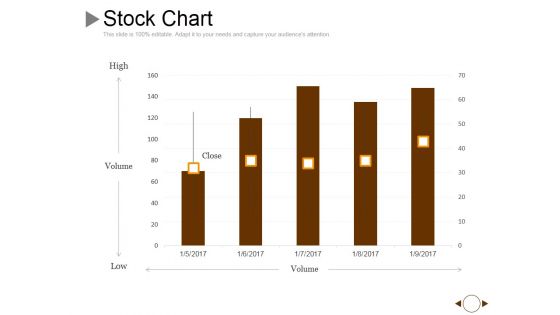
Stock Chart Ppt PowerPoint Presentation Gallery Graphics Example
This is a stock chart ppt powerpoint presentation gallery graphics example. This is a five stage process. The stages in this process are volume, high, low, close.
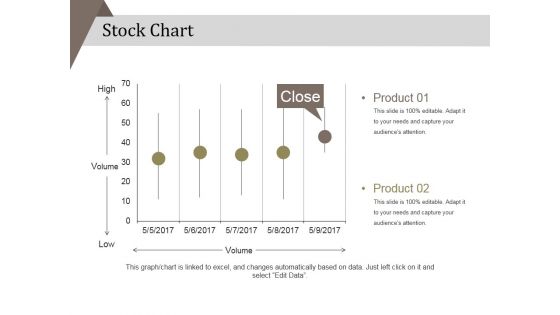
Stock Chart Ppt PowerPoint Presentation Portfolio Background Designs
This is a stock chart ppt powerpoint presentation portfolio background designs. This is a five stage process. The stages in this process are product, high, low .
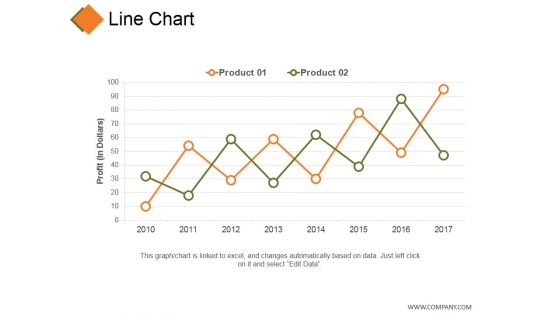
Line Chart Ppt PowerPoint Presentation Visual Aids Inspiration
This is a line chart ppt powerpoint presentation visual aids inspiration. This is a two stage process. The stages in this process are product, profit, growth, decline, success.

Column Chart Ppt PowerPoint Presentation Inspiration Design Ideas
This is a column chart ppt powerpoint presentation inspiration design ideas. This is a nine stage process. The stages in this process are product, growth, success, graph, business.
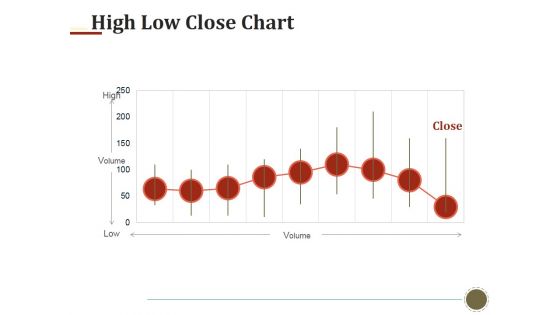
High Low Close Chart Ppt PowerPoint Presentation Infographics Templates
This is a high low close chart ppt powerpoint presentation infographics templates. This is a nine stage process. The stages in this process are high, volume, low, close.
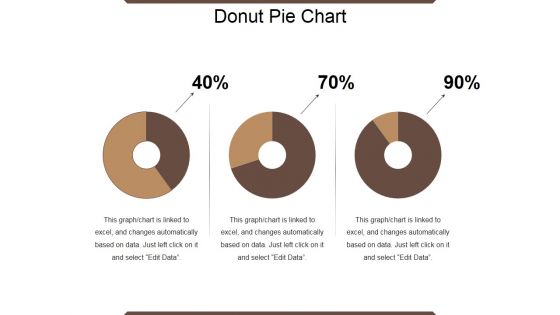
Donut Pie Chart Ppt PowerPoint Presentation Show Topics
This is a donut pie chart ppt powerpoint presentation show topics. This is a three stage process. The stages in this process are percentage, finance, donut, business.
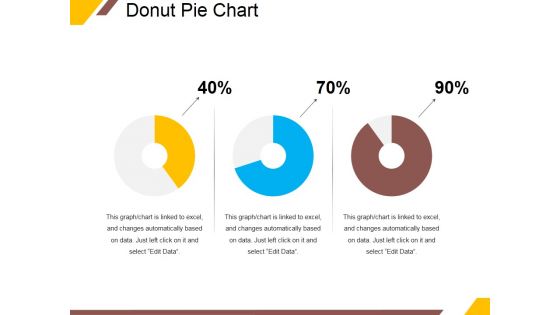
Donut Pie Chart Ppt PowerPoint Presentation Ideas Portrait
This is a donut pie chart ppt powerpoint presentation ideas portrait. This is a three stage process. The stages in this process are percentage, finance, donut, business.
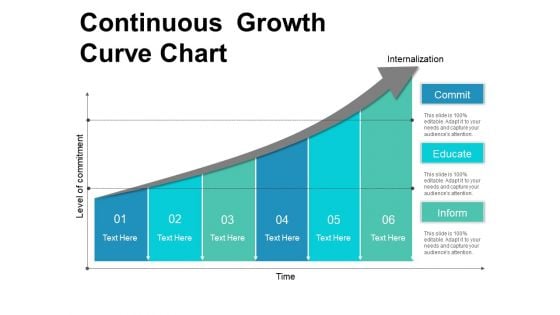
Continuous Growth Curve Chart Ppt PowerPoint Presentation Inspiration Slideshow
This is a continuous growth curve chart ppt powerpoint presentation inspiration slideshow. This is a six stage process. The stages in this process are circular, continuity, continuum.

Eight Stages Sequential Function Chart Ppt PowerPoint Presentation Slides Graphics
This is a eight stages sequential function chart ppt powerpoint presentation slides graphics. This is a eight stage process. The stages in this process are circular, continuity, continuum.
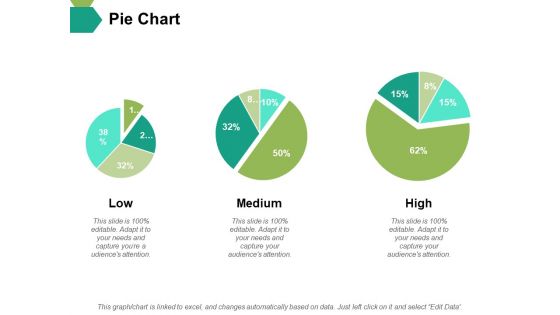
Pie Chart Ppt PowerPoint Presentation Slides Master Slide
This is a pie chart ppt powerpoint presentation slides master slide. This is a three stage process. The stages in this process are pie, process, percentage, finance, business.
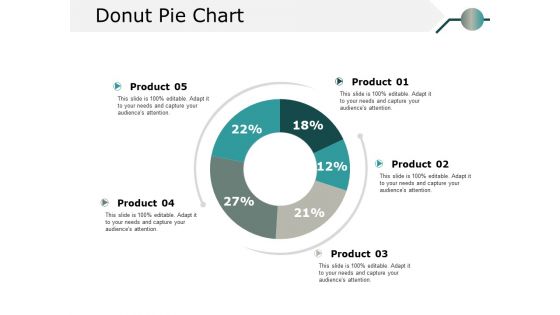
Donut Pie Chart Ppt PowerPoint Presentation Model Information
This is a donut pie chart ppt powerpoint presentation model information. This is a five stage process. The stages in this process are percentage, product, business.
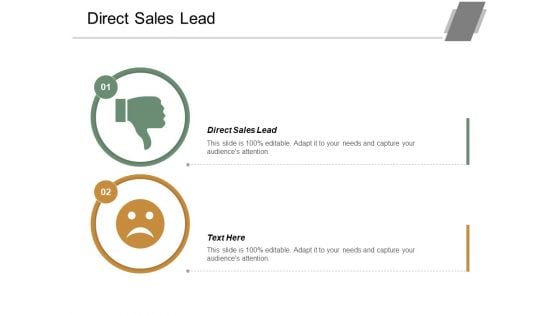
Direct Sales Lead Ppt Powerpoint Presentation Diagram Graph Charts Cpb
This is a direct sales lead ppt powerpoint presentation diagram graph charts cpb. This is a two stage process. The stages in this process are direct sales lead.
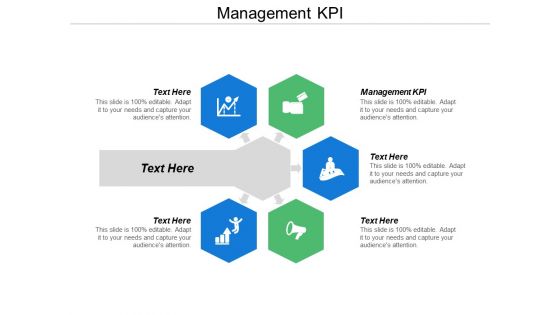
Management Kpi Ppt Powerpoint Presentation Diagram Graph Charts Cpb
This is a management kpi ppt powerpoint presentation diagram graph charts cpb. This is a five stage process. The stages in this process are management kpi.
Project Management Gantt Chart Graph Ppt PowerPoint Presentation Styles Icon
This is a project management gantt chart graph ppt powerpoint presentation styles icon. This is a four stage process. The stages in this process are four.
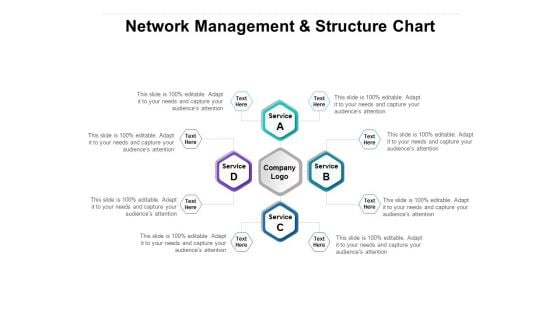
Network Management And Structure Chart Ppt PowerPoint Presentation Inspiration Templates
Presenting this set of slides with name network management and structure chart ppt powerpoint presentation inspiration templates. This is a four stage process. The stages in this process are network management, structure chart. This is a completely editable PowerPoint presentation and is available for immediate download. Download now and impress your audience.
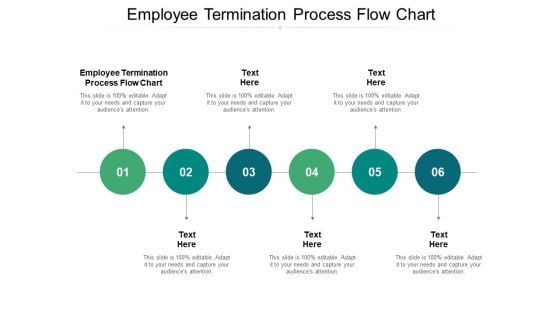
Employee Termination Process Flow Chart Ppt PowerPoint Presentation Graphics Cpb
Presenting this set of slides with name employee termination process flow chart ppt powerpoint presentation graphics cpb. This is a six stage process. The stages in this process are employee termination process flow chart. This is a completely editable PowerPoint presentation and is available for immediate download. Download now and impress your audience.
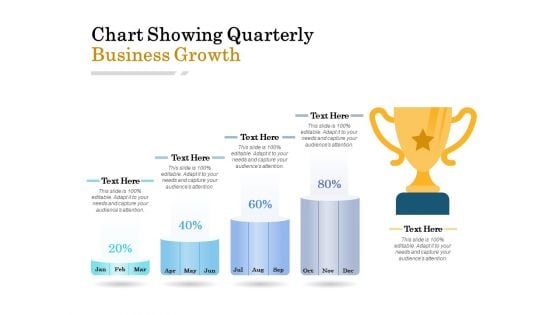
Chart Showing Quarterly Business Growth Ppt PowerPoint Presentation Show Objects
Presenting this set of slides with name chart showing quarterly business growth ppt powerpoint presentation show objects. This is a four stage process. The stages in this process are chart showing quarterly business growth. This is a completely editable PowerPoint presentation and is available for immediate download. Download now and impress your audience.


 Continue with Email

 Home
Home


