Metrics
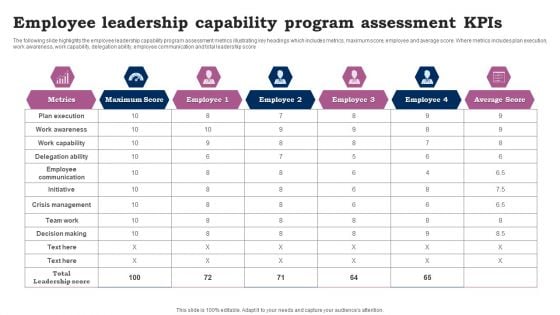
Employee Leadership Capability Program Assessment Kpis Ppt Infographic Template Topics PDF
The following slide highlights the employee leadership capability program assessment metrics illustrating key headings which includes metrics, maximum score, employee and average score. Where metrics includes plan execution, work awareness, work capability, delegation ability, employee communication and total leadership score. Pitch your topic with ease and precision using this Employee Leadership Capability Program Assessment Kpis Ppt Infographic Template Topics PDF. This layout presents information on Metrics, Plan Execution, Work Awareness. It is also available for immediate download and adjustment. So, changes can be made in the color, design, graphics or any other component to create a unique layout.
Social Media Engagement Tracking Dashboard Cracking The Code Of Social Media
This slide depicts the social media engagement metrics dashboard. The purpose of this slide is to outline the engagement metrics such as page engagement, post key interaction, post engagement type, etc. There are so many reasons you need a Social Media Engagement Tracking Dashboard Cracking The Code Of Social Media. The first reason is you can not spend time making everything from scratch, Thus, Slidegeeks has made presentation templates for you too. You can easily download these templates from our website easily. This slide depicts the social media engagement metrics dashboard. The purpose of this slide is to outline the engagement metrics such as page engagement, post key interaction, post engagement type, etc.
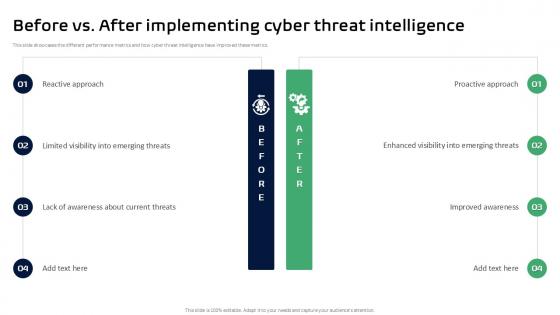
Before Vs After Implementing Cyber Threat Intelligence Ppt Example
This slide showcases the different performance metrics and how cyber threat intelligence have improved these metrics. Create an editable Before Vs After Implementing Cyber Threat Intelligence Ppt Example that communicates your idea and engages your audience. Whether you are presenting a business or an educational presentation, pre-designed presentation templates help save time. Before Vs. After Implementing Cyber Threat Intelligence Ppt Example is highly customizable and very easy to edit, covering many different styles from creative to business presentations. Slidegeeks has creative team members who have crafted amazing templates. So, go and get them without any delay. This slide showcases the different performance metrics and how cyber threat intelligence have improved these metrics.
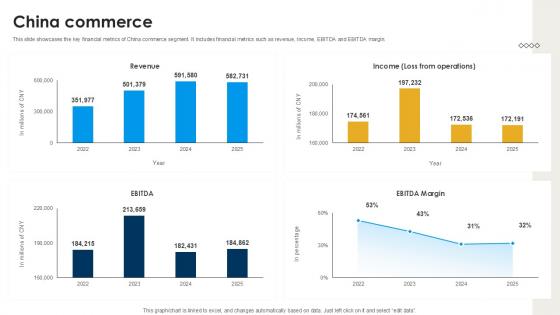
China Commerce International Trade Of Products And Services PPT Template CP SS V
This slide showcases the key financial metrics of China commerce segment. It includes financial metrics such as revenue, Income, EBITDA and EBITDA margin. There are so many reasons you need a China Commerce International Trade Of Products And Services PPT Template CP SS V. The first reason is you can not spend time making everything from scratch, Thus, Slidegeeks has made presentation templates for you too. You can easily download these templates from our website easily. This slide showcases the key financial metrics of China commerce segment. It includes financial metrics such as revenue, Income, EBITDA and EBITDA margin.
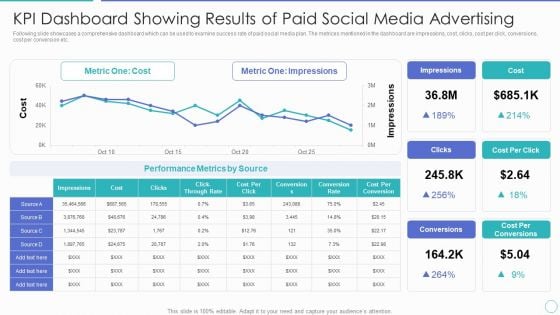
KPI Dashboard Showing Results Of Paid Social Media Advertising Ppt PowerPoint Presentation File Summary PDF
Following slide showcases a comprehensive dashboard which can be used to examine success rate of paid social media plan. The metrices mentioned in the dashboard are impressions, cost, clicks, cost per click, conversions, cost per conversion etc. Showcasing this set of slides titled kpi dashboard showing results of paid social media advertising ppt powerpoint presentation file summary pdf. The topics addressed in these templates are metric one cost, metric one impressions, performance metrics by source. All the content presented in this PPT design is completely editable. Download it and make adjustments in color, background, font etc. as per your unique business setting.
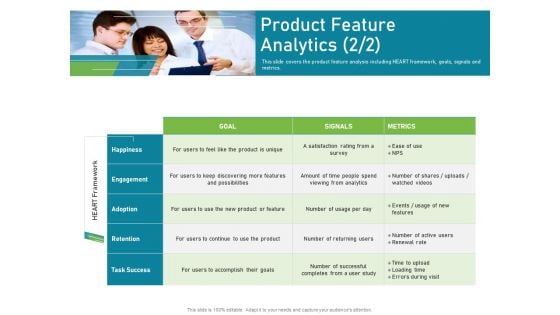
Requirements Governance Plan Product Feature Analytics Rules PDF
This slide covers the product feature analysis including HEART framework, goals, signals and metrics. Deliver and pitch your topic in the best possible manner with this requirements governance plan product feature analytics rules pdf. Use them to share invaluable insights on engagement, goal, metrics and impress your audience. This template can be altered and modified as per your expectations. So, grab it now.
Developing And Controlling B2b Marketing Plan Retailer Selection Process Icons PDF
The following slide provides multiple metrics that can be used to select appropriate partner for trade. Deliver an awe-inspiring pitch with this creative developing and controlling b2b marketing plan retailer selection process icons pdf. bundle. Topics like metrics, description, comments can be discussed with this completely editable template. It is available for immediate download depending on the needs and requirements of the user.
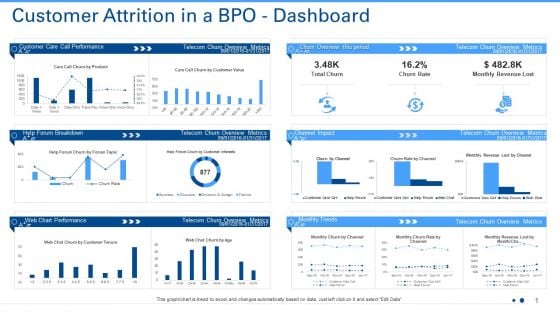
Customer Attrition In A BPO Dashboard Ppt Show File Formats PDF
Deliver an awe-inspiring pitch with this creative customer attrition in a bpo dashboard ppt show file formats pdf. bundle. Topics like customer care call performance, telecom churn overview metrics, telecom churn overview metrics can be discussed with this completely editable template. It is available for immediate download depending on the needs and requirements of the user.
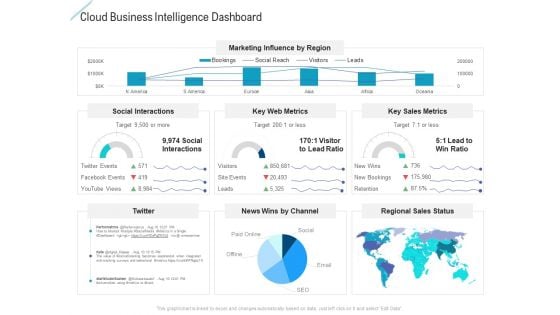
Cloud Business Intelligence Dashboard Graphics PDF
Deliver and pitch your topic in the best possible manner with this cloud business intelligence dashboard graphics pdf. Use them to share invaluable insights on social interactions, key web metrics, key sales metrics and impress your audience. This template can be altered and modified as per your expectations. So, grab it now.
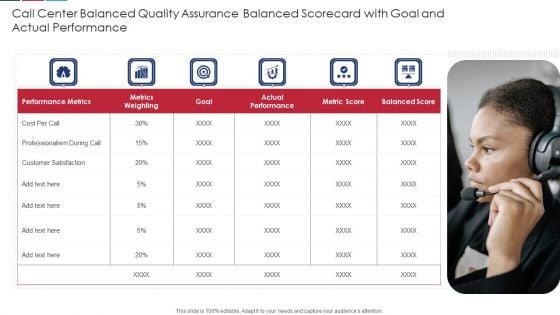
Call Center Balanced Quality Assurance Balanced Scorecard With Goal And Actual Performance Structure PDF
Deliver an awe inspiring pitch with this creative Call Center Balanced Quality Assurance Balanced Scorecard With Goal And Actual Performance Structure PDF bundle. Topics like Performance Metrics, Actual Performance, Metrics Weighting can be discussed with this completely editable template. It is available for immediate download depending on the needs and requirements of the user.
Call Center Quality Assurance Balanced Scorecard Template With Customer Satisfaction Rate Icons PDF
Deliver and pitch your topic in the best possible manner with this Call Center Quality Assurance Balanced Scorecard Template With Customer Satisfaction Rate Icons PDF Use them to share invaluable insights on Performance Metrics, Actual Performance, Metrics Weighting and impress your audience. This template can be altered and modified as per your expectations. So, grab it now.
Business Program Success Kpis With Priority Ppt Infographic Template Icon PDF
The following slide highlights the business program success metrics with priority illustrating key headings which includes business objective, metric tool, target group, measurement description and priority. Pitch your topic with ease and precision using this Business Program Success Kpis With Priority Ppt Infographic Template Icon PDF. This layout presents information on Business Objective, Metric Tool, Target Group. It is also available for immediate download and adjustment. So, changes can be made in the color, design, graphics or any other component to create a unique layout.
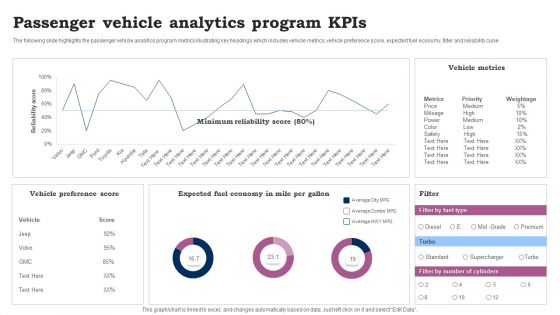
Passenger Vehicle Analytics Program Kpis Ppt Pictures Demonstration PDF
The following slide highlights the passenger vehicle analytics program metrics illustrating key headings which includes vehicle metrics, vehicle preference score, expected fuel economy, filter and reliability curve. Showcasing this set of slides titled Passenger Vehicle Analytics Program Kpis Ppt Pictures Demonstration PDF. The topics addressed in these templates are Vehicle Preference Score, Vehicle Metrics, Expected Fuel Economy. All the content presented in this PPT design is completely editable. Download it and make adjustments in color, background, font etc. as per your unique business setting.

Other Ways To Measure Brand Equity Guide To Brand Value Information PDF
Purpose of this slide is to address various approaches of measuring brand equity. Ways covered in the slide are brand awareness, financial metrics, preference metrics and competitive metrics.The best PPT templates are a great way to save time, energy, and resources. Slidegeeks have 100precent editable powerpoint slides making them incredibly versatile. With these quality presentation templates, you can create a captivating and memorable presentation by combining visually appealing slides and effectively communicating your message. Download Other Ways To Measure Brand Equity Guide To Brand Value Information PDF from Slidegeeks and deliver a wonderful presentation.
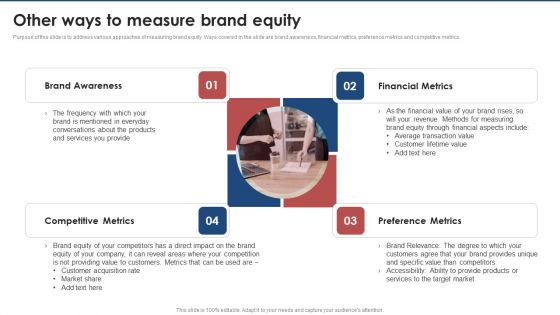
Other Ways To Measure Brand Equity Brand Value Estimation Guide Rules PDF
Purpose of this slide is to address various approaches of measuring brand equity. Ways covered in the slide are brand awareness, financial metrics, preference metrics and competitive metrics.Slidegeeks has constructed Other Ways To Measure Brand Equity Brand Value Estimation Guide Rules PDF after conducting extensive research and examination. These presentation templates are constantly being generated and modified based on user preferences and critiques from editors. Here, you will find the most attractive templates for a range of purposes while taking into account ratings and remarks from users regarding the content. This is an excellent jumping-off point to explore our content and will give new users an insight into our top-notch PowerPoint Templates.
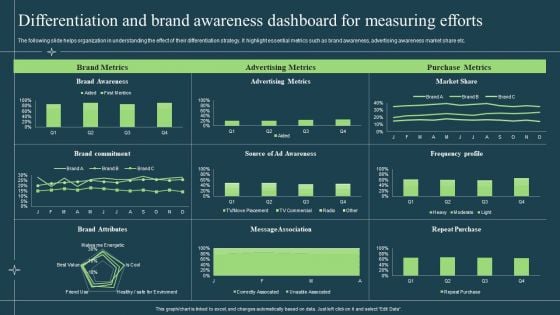
Differentiation Techniques Ways To Surpass Competitors Differentiation And Brand Awareness Dashboard For Measuring Efforts Template PDF
The following slide helps organization in understanding the effect of their differentiation strategy. It highlight essential metrics such as brand awareness, advertising awareness market share etc. Deliver and pitch your topic in the best possible manner with this Differentiation Techniques Ways To Surpass Competitors Differentiation And Brand Awareness Dashboard For Measuring Efforts Template PDF. Use them to share invaluable insights on Brand Awareness, Brand Metrics, Advertising Metrics and impress your audience. This template can be altered and modified as per your expectations. So, grab it now.
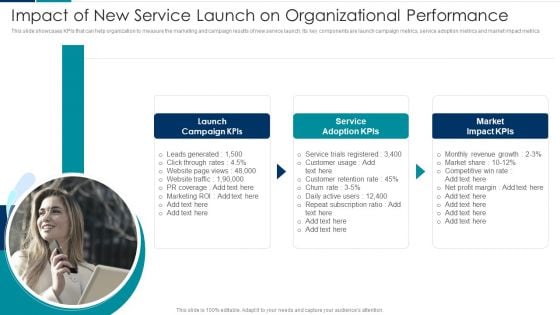
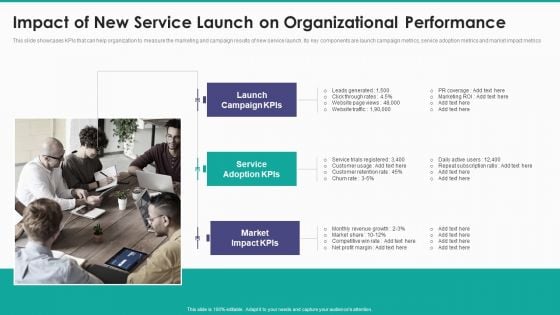
Managing New Service Roll Out And Marketing Procedure Impact Of New Service Launch On Organizational Performance Diagrams PDF
This slide showcases KPIs that can help organization to measure the marketing and campaign results of new service launch. Its key components are launch campaign metrics, service adoption metrics and market impact metrics. Presenting Managing New Service Roll Out And Marketing Procedure Impact Of New Service Launch On Organizational Performance Diagrams PDF to provide visual cues and insights. Share and navigate important information on three stages that need your due attention. This template can be used to pitch topics like Launch Campaign Kpis, Service Adoption Kpis, Market Impact Kpis. In addtion, this PPT design contains high resolution images, graphics, etc, that are easily editable and available for immediate download.
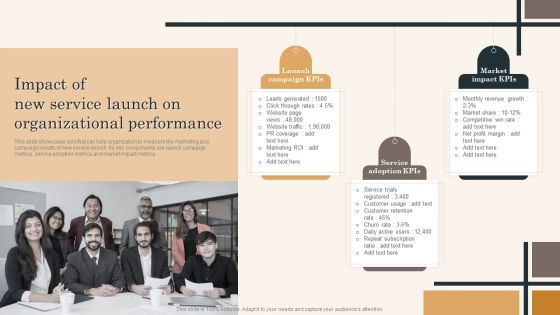
New Service Launch And Development Strategy To Gain Market Share Impact Of New Service Launch On Organizational Clipart PDF
This slide showcases KPIs that can help organization to measure the marketing and campaign results of new service launch. Its key components are launch campaign metrics, service adoption metrics and market impact metrics.This is a New Service Launch And Development Strategy To Gain Market Share Impact Of New Service Launch On Organizational Clipart PDF template with various stages. Focus and dispense information on one stage using this creative set, that comes with editable features. It contains large content boxes to add your information on topics like Market Impact, Service Adoption, Launch Campaign You can also showcase facts, figures, and other relevant content using this PPT layout. Grab it now.
Edtech Service Launch And Promotion Plan Impact Of New Service Launch On Organizational Performance Information PDF
This slide showcases kpis that can help organization to measure the marketing and campaign results of new service launch. Its key components are launch campaign metrics, service adoption metrics and market impact metrics. There are so many reasons you need a Edtech Service Launch And Promotion Plan Impact Of New Service Launch On Organizational Performance Information PDF. The first reason is you can not spend time making everything from scratch, Thus, Slidegeeks has made presentation templates for you too. You can easily download these templates from our website easily.

Impact Of New Service Launch On Organizational Performance Introduction PDF
This slide showcases KPIs that can help organization to measure the marketing and campaign results of new service launch. Its key components are launch campaign metrics, service adoption metrics and market impact metrics. Boost your pitch with our creative Impact Of New Service Launch On Organizational Performance Introduction PDF. Deliver an awe inspiring pitch that will mesmerize everyone. Using these presentation templates you will surely catch everyones attention. You can browse the ppts collection on our website. We have researchers who are experts at creating the right content for the templates. So you do not have to invest time in any additional work. Just grab the template now and use them.
Our Mission Brand And Equity Evaluation Techniques And Procedures Structure PDF
Purpose of this slide is to address various approaches of measuring brand equity. Ways covered in the slide are brand awareness, financial metrics, preference metrics and competitive metrics.Create an editable Our Mission Brand And Equity Evaluation Techniques And Procedures Structure PDF that communicates your idea and engages your audience. Whether your are presenting a business or an educational presentation, pre-designed presentation templates help save time. Our Mission Brand And Equity Evaluation Techniques And Procedures Structure PDF is highly customizable and very easy to edit, covering many different styles from creative to business presentations. Slidegeeks has creative team members who have crafted amazing templates. So, go and get them without any delay.
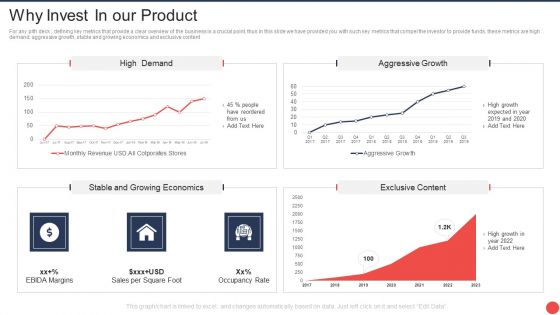
Computer Mediated Reality Investor Funding Elevator Why Invest In Our Product Download PDF
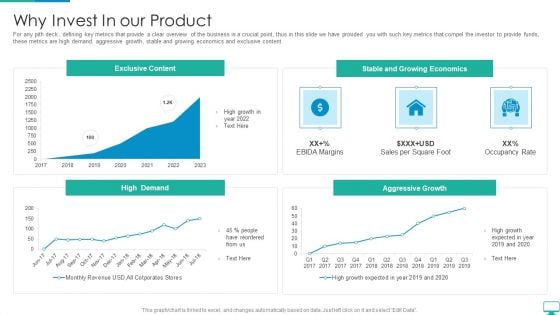
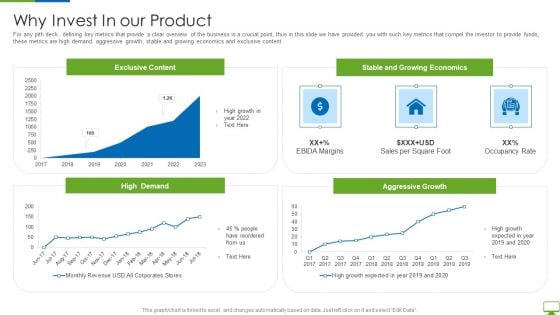
For any pith deck , defining key metrics that provide a clear overview of the business is a crucial point, thus in this slide we have provided you with such key metrics that compel the investor to provide funds, these metrics are high demand, aggressive growth, stable and growing economics and exclusive content. Deliver an awe inspiring pitch with this creative computer mediated reality investor funding elevator why invest in our product download pdf bundle. Topics like high demand, stable and growing economics, exclusive content, aggressive growth can be discussed with this completely editable template. It is available for immediate download depending on the needs and requirements of the user.
Cyberspace Simulation Platform Fundraising Elevator Why Invest In Our Product Demonstration PDF
For any pith deck, defining key metrics that provide a clear overview of the business is a crucial point, thus in this slide we have provided you with such key metrics that compel the investor to provide funds, these metrics are high demand, aggressive growth, stable and growing economics and exclusive content. Deliver an awe inspiring pitch with this creative cyberspace simulation platform fundraising elevator why invest in our product demonstration pdf bundle. Topics like exclusive content, stable and growing economics, aggressive growth can be discussed with this completely editable template. It is available for immediate download depending on the needs and requirements of the user.
Cyber Network Simulation Platform Capital Funding Pitch Deck Why Invest In Our Product Ideas PDF
For any pith deck , defining key metrics that provide a clear overview of the business is a crucial point, thus in this slide we have provided you with such key metrics that compel the investor to provide funds, these metrics are high demand, aggressive growth, stable and growing economics and exclusive content Deliver an awe inspiring pitch with this creative cyber network simulation platform capital funding pitch deck why invest in our product ideas pdf bundle. Topics like exclusive content, stable and growing economics, aggressive growth can be discussed with this completely editable template. It is available for immediate download depending on the needs and requirements of the user.
Expectation Of Software Project Life Cycle Evolution Matrix Professional PDF
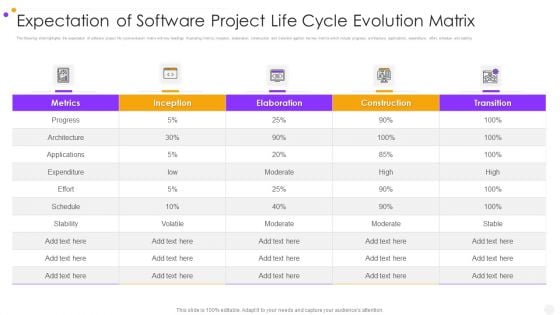
The following slide highlights the expectation of software project life cycle evolution matrix with key headings illustrating metrics, inception, elaboration, construction and transition against the key metrics which include progress, architecture, applications, expenditure, effort, schedule and stability. Showcasing this set of slides titled expectation of software project life cycle evolution matrix professional pdf. The topics addressed in these templates are construction, transition, metrics. All the content presented in this PPT design is completely editable. Download it and make adjustments in color, background, font etc. as per your unique business setting.
Artificial Intelligence Gaming Industry Fund Raising Elevator Why Invest In Our Product Growing Demonstration PDF
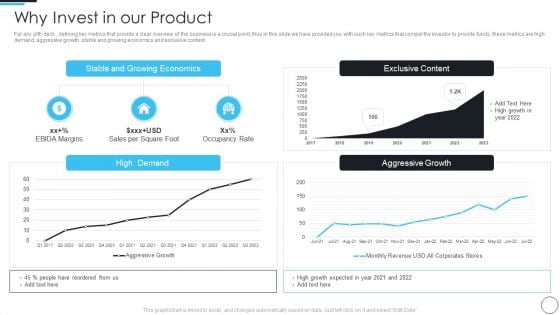
For any pith deck , defining key metrics that provide a clear overview of the business is a crucial point, thus in this slide we have provided you with such key metrics that compel the investor to provide funds, these metrics are high demand, aggressive growth, stable and growing economics and exclusive content Deliver an awe inspiring pitch with this creative artificial intelligence gaming industry fund raising elevator why invest in our product growing demonstration pdf bundle. Topics like why invest in our product can be discussed with this completely editable template. It is available for immediate download depending on the needs and requirements of the user.
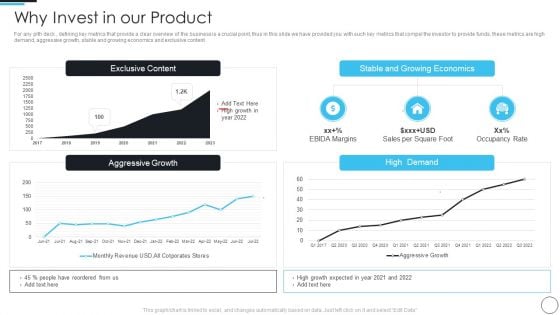
Artificial Intelligence Gaming Industry Fund Raising Elevator Why Invest In Our Product Diagrams PDF
For any pith deck , defining key metrics that provide a clear overview of the business is a crucial point, thus in this slide we have provided you with such key metrics that compel the investor to provide funds, these metrics are high demand, aggressive growth, stable and growing economics and exclusive content Deliver and pitch your topic in the best possible manner with this artificial intelligence gaming industry fund raising elevator why invest in our product diagrams pdf. Use them to share invaluable insights on why invest in our product and impress your audience. This template can be altered and modified as per your expectations. So, grab it now.
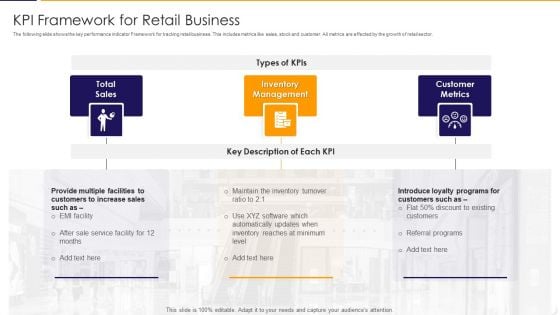
KPI Framework For Retail Business Elements PDF
The following slide shows the key performance indicator Framework for tracking retail business. This includes metrics like sales, stock and customer. All metrics are affected by the growth of retail sector. Presenting kpi framework for retail business elements pdf to dispense important information. This template comprises three stages. It also presents valuable insights into the topics including total sales, inventory management, customer metrics. This is a completely customizable PowerPoint theme that can be put to use immediately. So, download it and address the topic impactfully.
Business Monthly Financial Report Summary With Budget And Variance Icons PDF
The following slide highlights the monthly financial report with budget and variance illustrating profit and loss metrics, balance sheet metrics, revenue, expense, net income, return on assets, cash, current ratio, account payable and account receivable.Showcasing this set of slides titled Business Monthly Financial Report Summary With Budget And Variance Icons PDF The topics addressed in these templates are Return On Assets, Account Receivable, Loss Metrics All the content presented in this PPT design is completely editable. Download it and make adjustments in color, background, font etc. as per your unique business setting.
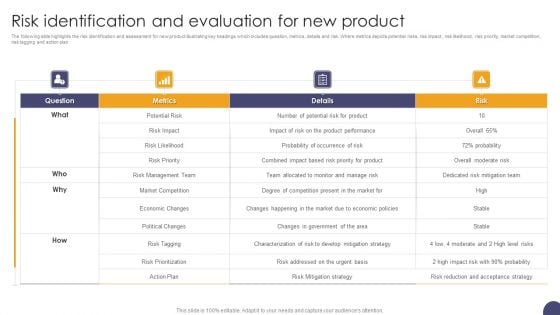
Risk Identification And Evaluation For New Product Ppt Styles Portfolio PDF
The following slide highlights the risk identification and assessment for new product illustrating key headings which includes question, metrics, details and risk. Where metrics depicts potential risks, risk impact, risk likelihood, risk priority, market competition, risk tagging and action plan. Pitch your topic with ease and precision using this Risk Identification And Evaluation For New Product Ppt Styles Portfolio PDF. This layout presents information on Metrics, Risk, Risk Priority, Risk Management Team. It is also available for immediate download and adjustment. So, changes can be made in the color, design, graphics or any other component to create a unique layout.
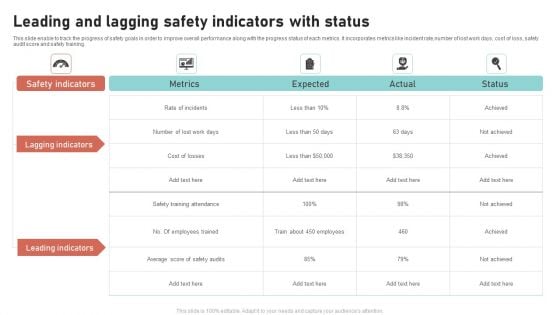
Leading And Lagging Safety Indicators With Status Slides PDF
This slide enable to track the progress of safety goals in order to improve overall performance along with the progress status of each metrics. It incorporates metrics like incident rate,number of lost work days, cost of loss, safety audit score and safety training. Pitch your topic with ease and precision using this Leading And Lagging Safety Indicators With Status Slides PDF. This layout presents information on Safety Indicators, Metrics, Expected, Lagging Indicators. It is also available for immediate download and adjustment. So, changes can be made in the color, design, graphics or any other component to create a unique layout.
Dashboard For Tracking Mobile Commercial Banking Marketing Campaign Performance Slides PDF
This slide depicts a dashboard for tracking performance of marketing campaigns of mobile banking across paid media channels. The key performing indicators are client acquisition metrics, client conversion metrics, expense metrics among many others. Showcasing this set of slides titled Dashboard For Tracking Mobile Commercial Banking Marketing Campaign Performance Slides PDF. The topics addressed in these templates are Dashboard For Tracking Mobile, Commercial Banking, Marketing Campaign Performance. All the content presented in this PPT design is completely editable. Download it and make adjustments in color, background, font etc. as per your unique business setting.
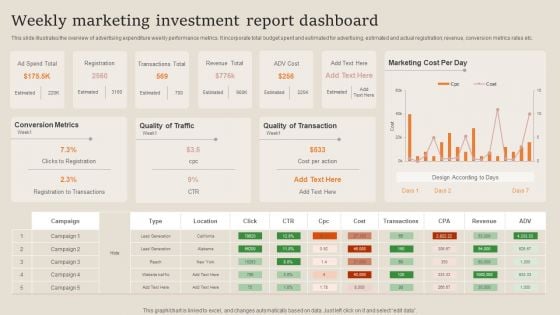
Weekly Marketing Investment Report Dashboard Ideas PDF
This slide illustrates the overview of advertising expenditure weekly performance metrics. It incorporate total budget spent and estimated for advertising, estimated and actual registration, revenue, conversion metrics rates etc. Showcasing this set of slides titled Weekly Marketing Investment Report Dashboard Ideas PDF. The topics addressed in these templates are Conversion Metrics, Quality Of Traffic, Quality Of Transaction. All the content presented in this PPT design is completely editable. Download it and make adjustments in color, background, font etc. as per your unique business setting.
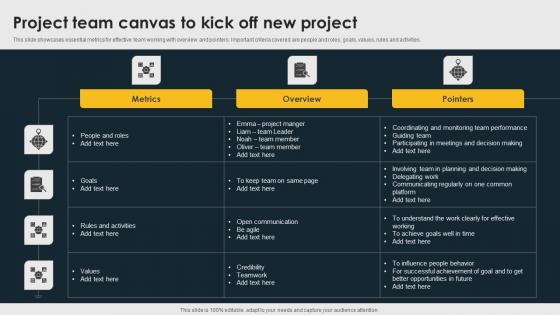
Project Team Canvas To Kick Off New Project Professional Pdf
This slide showcases essential metrics for effective team working with overview and pointers. Important criteria covered are people and roles, goals, values, rules and activities. Pitch your topic with ease and precision using this Project Team Canvas To Kick Off New Project Professional Pdf. This layout presents information on Metrics, Overview, Pointers. It is also available for immediate download and adjustment. So, changes can be made in the color, design, graphics or any other component to create a unique layout. This slide showcases essential metrics for effective team working with overview and pointers. Important criteria covered are people and roles, goals, values, rules and activities.

Project Management Departmental Matrix With Priority Level Elements Pdf
This slide covers the project management skills scorecard based on department-wise objectives and metrics to track their performance. The skills include financial, customer, and internal development. Pitch your topic with ease and precision using this Project Management Departmental Matrix With Priority Level Elements Pdf. This layout presents information on Objective, Metrics, Priority Level. It is also available for immediate download and adjustment. So, changes can be made in the color, design, graphics or any other component to create a unique layout. This slide covers the project management skills scorecard based on department-wise objectives and metrics to track their performance. The skills include financial, customer, and internal development.
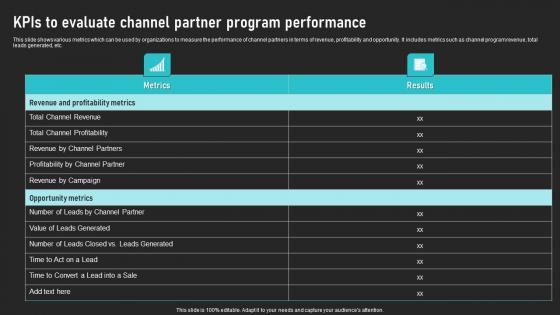
KPIS To Evaluate Channel Partner Program Performance Cooperative Sales Tactics Topics Pdf
This slide shows various metrics which can be used by organizations to measure the performance of channel partners in terms of revenue, profitability and opportunity. It includes metrics such as channel program revenue, total leads generated, etc. From laying roadmaps to briefing everything in detail, our templates are perfect for you. You can set the stage with your presentation slides. All you have to do is download these easy-to-edit and customizable templates. KPIS To Evaluate Channel Partner Program Performance Cooperative Sales Tactics Topics Pdf will help you deliver an outstanding performance that everyone would remember and praise you for. Do download this presentation today. This slide shows various metrics which can be used by organizations to measure the performance of channel partners in terms of revenue, profitability and opportunity. It includes metrics such as channel program revenue, total leads generated, etc.
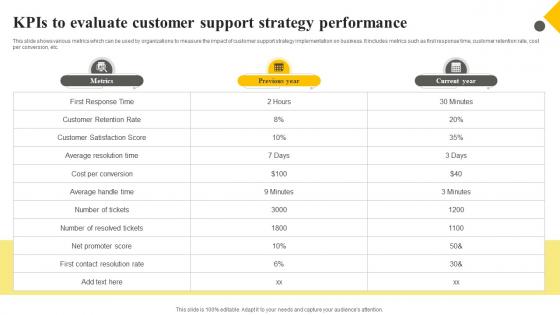
Client Support Plan To Increase Customer Kpis To Evaluate Customer Support Strategy Performance Strategy SS V
This slide shows various metrics which can be used by organizations to measure the impact of customer support strategy implementation on business. It includes metrics such as first response time, customer retention rate, cost per conversion, etc. If your project calls for a presentation, then Slidegeeks is your go-to partner because we have professionally designed, easy-to-edit templates that are perfect for any presentation. After downloading, you can easily edit Client Support Plan To Increase Customer Kpis To Evaluate Customer Support Strategy Performance Strategy SS V and make the changes accordingly. You can rearrange slides or fill them with different images. Check out all the handy templates This slide shows various metrics which can be used by organizations to measure the impact of customer support strategy implementation on business. It includes metrics such as first response time, customer retention rate, cost per conversion, etc.
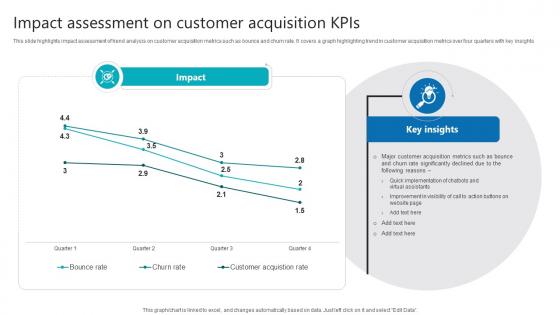
Impact Assessment On Customer Acquisition Kpis Product Analytics Implementation Data Analytics V
This slide highlights impact assessment of trend analysis on customer acquisition metrics such as bounce and churn rate. It covers a graph highlighting trend in customer acquisition metrics over four quarters with key insights The Impact Assessment On Customer Acquisition Kpis Product Analytics Implementation Data Analytics V is a compilation of the most recent design trends as a series of slides. It is suitable for any subject or industry presentation, containing attractive visuals and photo spots for businesses to clearly express their messages. This template contains a variety of slides for the user to input data, such as structures to contrast two elements, bullet points, and slides for written information. Slidegeeks is prepared to create an impression. This slide highlights impact assessment of trend analysis on customer acquisition metrics such as bounce and churn rate. It covers a graph highlighting trend in customer acquisition metrics over four quarters with key insights

Unlocking Potential Enhancing Analysis Of Current Productivity Of The Team
This slide mentions the metrics analyzed to understand how well the team is performing in terms of overall productivity. The metrics include planned to done rate, focus hours per day, error rate, tasks completed on time, and pending items. There are so many reasons you need a Unlocking Potential Enhancing Analysis Of Current Productivity Of The Team. The first reason is you can not spend time making everything from scratch, Thus, Slidegeeks has made presentation templates for you too. You can easily download these templates from our website easily. This slide mentions the metrics analyzed to understand how well the team is performing in terms of overall productivity. The metrics include planned to done rate, focus hours per day, error rate, tasks completed on time, and pending items.
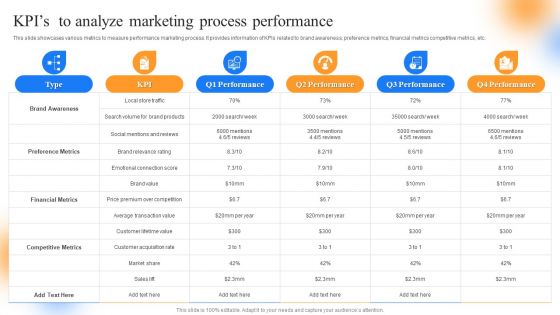
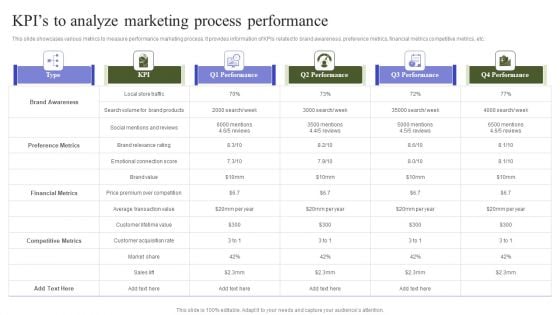
Strategic Guide To Perform Marketing Kpis To Analyze Marketing Process Performance Brochure PDF
This slide showcases various metrics to measure performance marketing process. It provides information of KPIs related to brand awareness, preference metrics, financial metrics competitive metrics, etc. Get a simple yet stunning designed Strategic Guide To Perform Marketing Kpis To Analyze Marketing Process Performance Brochure PDF. It is the best one to establish the tone in your meetings. It is an excellent way to make your presentations highly effective. So, download this PPT today from Slidegeeks and see the positive impacts. Our easy to edit Strategic Guide To Perform Marketing Kpis To Analyze Marketing Process Performance Brochure PDF can be your go to option for all upcoming conferences and meetings. So, what are you waiting for Grab this template today.
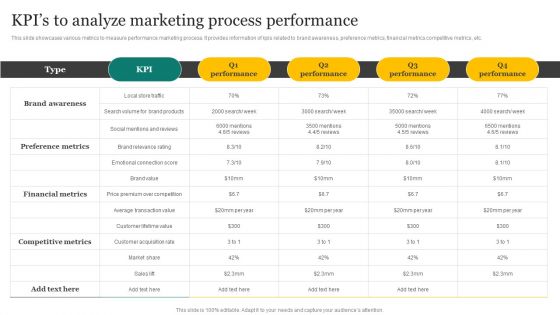
Strategic Promotion Plan Development Stages Kpis To Analyze Marketing Process Performance Guidelines PDF
This slide showcases various metrics to measure performance marketing process. It provides information of kpis related to brand awareness, preference metrics, financial metrics competitive metrics, etc. Get a simple yet stunning designed Strategic Promotion Plan Development Stages Kpis To Analyze Marketing Process Performance Guidelines PDF. It is the best one to establish the tone in your meetings. It is an excellent way to make your presentations highly effective. So, download this PPT today from Slidegeeks and see the positive impacts. Our easy to edit Strategic Promotion Plan Development Stages Kpis To Analyze Marketing Process Performance Guidelines PDF can be your go to option for all upcoming conferences and meetings. So, what are you waiting for Grab this template today.
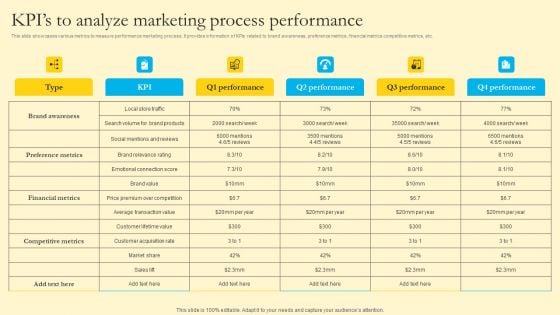
Comprehensive Guide For Sales And Advertising Processes Kpis To Analyze Marketing Process Performance Professional PDF
Marketing Mix Strategy Handbook Kpis To Analyze Marketing Process Performance Diagrams PDF
This slide showcases various metrics to measure performance marketing process. It provides information of KPIs related to brand awareness, preference metrics, financial metrics competitive metrics, etc. If you are looking for a format to display your unique thoughts, then the professionally designed Marketing Mix Strategy Handbook Kpis To Analyze Marketing Process Performance Diagrams PDF is the one for you. You can use it as a Google Slides template or a PowerPoint template. Incorporate impressive visuals, symbols, images, and other charts. Modify or reorganize the text boxes as you desire. Experiment with shade schemes and font pairings. Alter, share or cooperate with other people on your work. Download Marketing Mix Strategy Handbook Kpis To Analyze Marketing Process Performance Diagrams PDF and find out how to give a successful presentation. Present a perfect display to your team and make your presentation unforgettable.
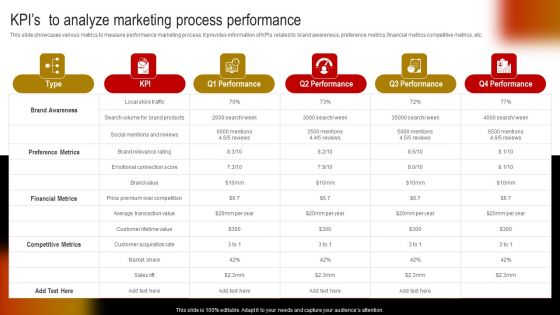
Comprehensive Guide To Build Marketing Strategy Kpis To Analyze Marketing Process Introduction PDF
This slide showcases various metrics to measure performance marketing process. It provides information of KPIs related to brand awareness, preference metrics, financial metrics competitive metrics, etc. This Comprehensive Guide To Build Marketing Strategy Kpis To Analyze Marketing Process Introduction PDF from Slidegeeks makes it easy to present information on your topic with precision. It provides customization options, so you can make changes to the colors, design, graphics, or any other component to create a unique layout. It is also available for immediate download, so you can begin using it right away. Slidegeeks has done good research to ensure that you have everything you need to make your presentation stand out. Make a name out there for a brilliant performance.

Customizing The Salon Experience Examining The Current Performance Of Salon Business Kpis Strategy SS V
This slide assesses the performance of key salon metrics. It includes information about metrics such as average ticket value, sales velocity, net promoter score, occupancy rate and total revenue. Welcome to our selection of the Customizing The Salon Experience Examining The Current Performance Of Salon Business Kpis Strategy SS V. These are designed to help you showcase your creativity and bring your sphere to life. Planning and Innovation are essential for any business that is just starting out. This collection contains the designs that you need for your everyday presentations. All of our PowerPoints are 100Percent editable, so you can customize them to suit your needs. This multi-purpose template can be used in various situations. Grab these presentation templates today. This slide assesses the performance of key salon metrics. It includes information about metrics such as average ticket value, sales velocity, net promoter score, occupancy rate and total revenue.
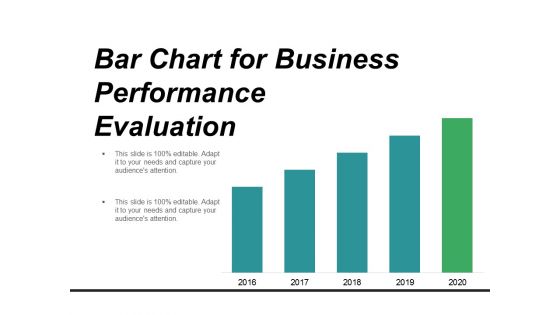
Bar Chart For Business Performance Evaluation Ppt PowerPoint Presentation Infographics Professional
This is a bar chart for business performance evaluation ppt powerpoint presentation infographics professional. This is a five stage process. The stages in this process are metrics icon, kpis icon, statistics icon.

Chart With Magnifying Glass For Business Research Ppt PowerPoint Presentation Inspiration Shapes
This is a chart with magnifying glass for business research ppt powerpoint presentation inspiration shapes. This is a two stage process. The stages in this process are metrics icon, kpis icon, statistics icon.

Data Research And Analytics Ppt PowerPoint Presentation Infographics Examples
This is a data research and analytics ppt powerpoint presentation infographics examples. This is a one stage process. The stages in this process are metrics icon, kpis icon, statistics icon.

Four Steps Market Reasrch And Analysis Ppt PowerPoint Presentation Infographic Template Maker
This is a four steps market reasrch and analysis ppt powerpoint presentation infographic template maker. This is a four stage process. The stages in this process are metrics icon, kpis icon, statistics icon.
Laptop And Magnifying Glass Icon Ppt PowerPoint Presentation Outline Clipart Images
This is a laptop and magnifying glass icon ppt powerpoint presentation outline clipart images. This is a two stage process. The stages in this process are metrics icon, kpis icon, statistics icon.

Laptop With Gears Software Testing Ppt PowerPoint Presentation Infographic Template Sample
This is a laptop with gears software testing ppt powerpoint presentation infographic template sample. This is a two stage process. The stages in this process are metrics icon, kpis icon, statistics icon.
Seven Steps Of Business Workflow With Icons Ppt PowerPoint Presentation Infographic Template Diagrams
This is a seven steps of business workflow with icons ppt powerpoint presentation infographic template diagrams. This is a seven stage process. The stages in this process are metrics icon, kpis icon, statistics icon.
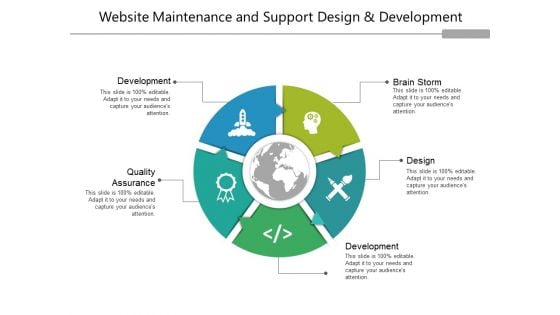
Website Maintenance And Support Design And Development Ppt PowerPoint Presentation Inspiration Outfit
This is a website maintenance and support design and development ppt powerpoint presentation inspiration outfit. This is a five stage process. The stages in this process are metrics icon, kpis icon, statistics icon.
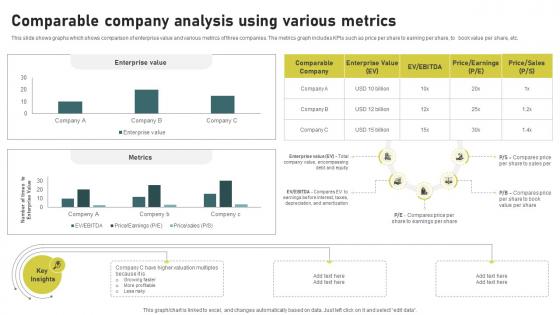
Comparable Company Analysis Using Investment Banking Simplified Functions Fin SS V
This slide shows graphs which shows comparison of enterprise value and various metrics of three companies. The metrics graph includes KPIs such as price per share to earning per share, to book value per share, etc. Get a simple yet stunning designed Comparable Company Analysis Using Investment Banking Simplified Functions Fin SS V. It is the best one to establish the tone in your meetings. It is an excellent way to make your presentations highly effective. So, download this PPT today from Slidegeeks and see the positive impacts. Our easy-to-edit Comparable Company Analysis Using Investment Banking Simplified Functions Fin SS V can be your go-to option for all upcoming conferences and meetings. So, what are you waiting for Grab this template today. This slide shows graphs which shows comparison of enterprise value and various metrics of three companies. The metrics graph includes KPIs such as price per share to earning per share, to book value per share, etc.
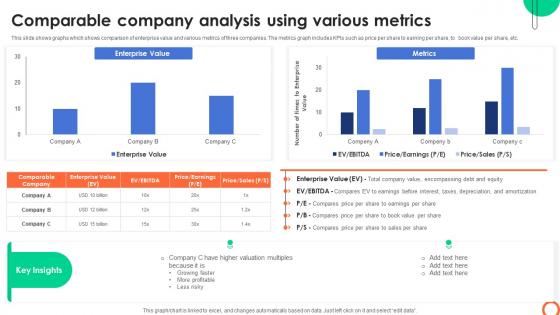
Comparable Company Analysis Using Various Understanding Investment Banking Framework Fin SS V
This slide shows graphs which shows comparison of enterprise value and various metrics of three companies. The metrics graph includes KPIs such as price per share to earning per share, to book value per share, etc. Get a simple yet stunning designed Comparable Company Analysis Using Various Understanding Investment Banking Framework Fin SS V. It is the best one to establish the tone in your meetings. It is an excellent way to make your presentations highly effective. So, download this PPT today from Slidegeeks and see the positive impacts. Our easy-to-edit Comparable Company Analysis Using Various Understanding Investment Banking Framework Fin SS V can be your go-to option for all upcoming conferences and meetings. So, what are you waiting for Grab this template today. This slide shows graphs which shows comparison of enterprise value and various metrics of three companies. The metrics graph includes KPIs such as price per share to earning per share, to book value per share, etc.
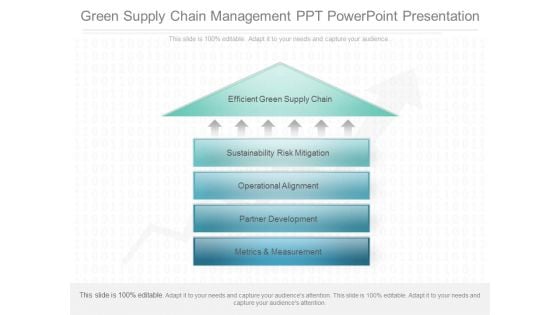
Green Supply Chain Management Ppt Powerpoint Presentation
This is a green supply chain management ppt powerpoint presentation. This is a five stage process. The stages in this process are efficient green supply chain, sustainability risk mitigation, operational alignment, partner development, metrics and measurement.\n\n\n
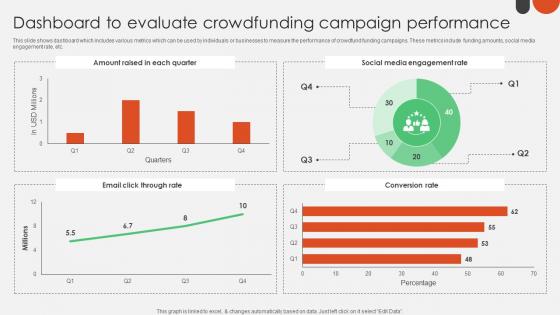
Dashboard To Evaluate Crowdfunding For Nonprofits To Support Fin SS V
This slide shows dashboard which includes various metrics which can be used by individuals or businesses to measure the performance of crowdfund funding campaigns. These metrics include funding amounts, social media engagement rate, etc. Find highly impressive Dashboard To Evaluate Crowdfunding For Nonprofits To Support Fin SS V on Slidegeeks to deliver a meaningful presentation. You can save an ample amount of time using these presentation templates. No need to worry to prepare everything from scratch because Slidegeeks experts have already done a huge research and work for you. You need to download Dashboard To Evaluate Crowdfunding For Nonprofits To Support Fin SS V for your upcoming presentation. All the presentation templates are 100 percent editable and you can change the color and personalize the content accordingly. Download now This slide shows dashboard which includes various metrics which can be used by individuals or businesses to measure the performance of crowdfund funding campaigns. These metrics include funding amounts, social media engagement rate, etc.
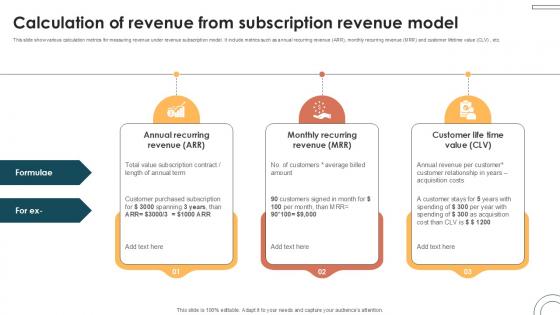
Calculation Of Revenue From Subscription Internet Based Trade Structure Ppt Example
This slide show various calculation metrics for measuring revenue under revenue subscription model. It include metrics such as annual recurring revenue ARR, monthly recurring revenue MRR and customer lifetime value CLV , etc. Get a simple yet stunning designed Calculation Of Revenue From Subscription Internet Based Trade Structure Ppt Example. It is the best one to establish the tone in your meetings. It is an excellent way to make your presentations highly effective. So, download this PPT today from Slidegeeks and see the positive impacts. Our easy-to-edit Calculation Of Revenue From Subscription Internet Based Trade Structure Ppt Example can be your go-to option for all upcoming conferences and meetings. So, what are you waiting for Grab this template today. This slide show various calculation metrics for measuring revenue under revenue subscription model. It include metrics such as annual recurring revenue ARR, monthly recurring revenue MRR and customer lifetime value CLV , etc.
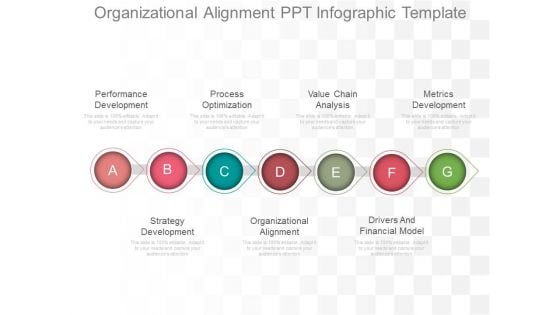
Organizational Alignment Ppt Infographic Template
This is a organizational alignment ppt infographic template. This is a seven stage process. The stages in this process are performance development, process optimization, value chain analysis, metrics development, strategy development, organizational alignment, drivers and financial model.
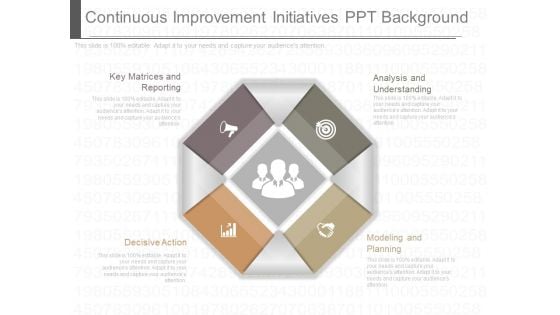
Continuous Improvement Initiatives Ppt Background


 Continue with Email

 Home
Home


