Metrics
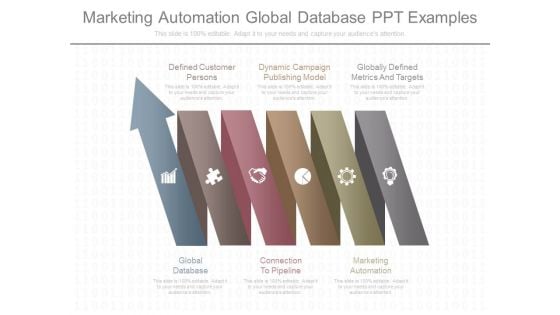
Marketing Automation Global Database Ppt Examples
This is a marketing automation global database ppt examples. This is a six stage process. The stages in this process are defined customer persons, dynamic campaign publishing model, globally defined metrics and targets, global database, connection to pipeline, marketing automation.
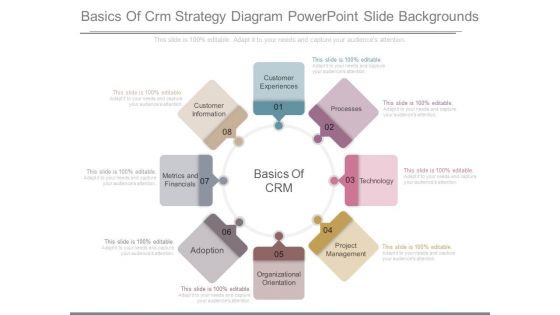
Basics Of Crm Strategy Diagram Powerpoint Slide Backgrounds
This is a basics of crm strategy diagram powerpoint slide backgrounds. This is a eight stage process. The stages in this process are customer experiences, processes, technology, project management, organizational orientation, adoption, metrics and financials, customer information.
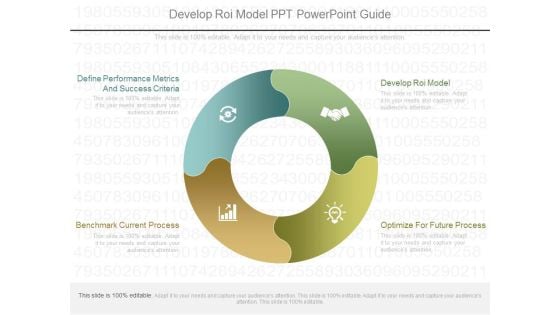
Develop Roi Model Ppt Powerpoint Guide
This is a develop roi model ppt powerpoint guide. This is a four stage process. The stages in this process are define performance metrics and success criteria, benchmark current process, develop roi model, optimize for future process.
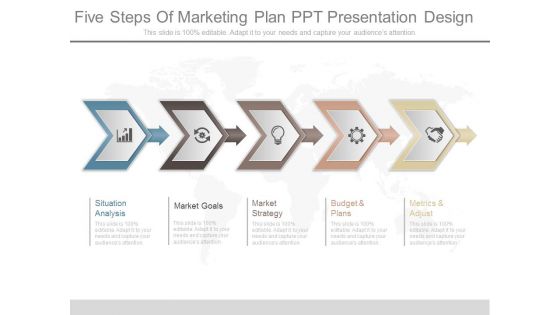
Five Steps Of Marketing Plan Ppt Presentation Design
This is a five steps of marketing plan ppt presentation design. This is a five stage process. The stages in this process are situation analysis, market goals, market strategy, budget and plans, metrics and adjust.\n\n
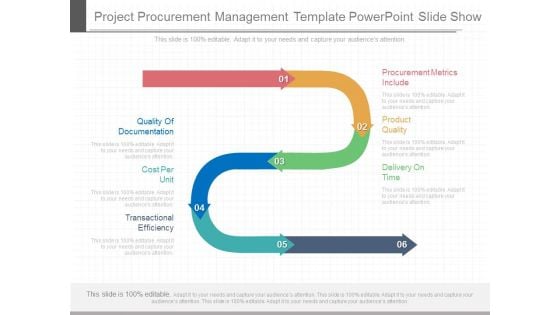
Project Procurement Management Template Powerpoint Slide Show
This is a project procurement management template powerpoint slide show. This is a six stage process. The stages in this process are procurement metrics include, product quality, delivery on time, transactional efficiency, cost per unit, quality of documentation.

Knowledge Management Process Model Ppt Slides
This is a knowledge management process model ppt slides. This is a six stage process. The stages in this process are knowledge manager, reports dashboard, metrics manager, financial tracker, resource manager, project tracker, result, strategy, execution.

Example Of Community Management With User Engagement Ppt Powerpoint Layout
This is a example of community management with user engagement ppt powerpoint layout. This is a four stage process. The stages in this process are campaign and content development, community management, strategy, analytics listening, metrics and insights.

Sample Of Global Client Service Ppt Examples Professional
This is a sample of global client service ppt examples professional. This is a six stage process. The stages in this process are compliance assessment, program review, average, excellent, program metrics and efficiencies, global risk analysis.
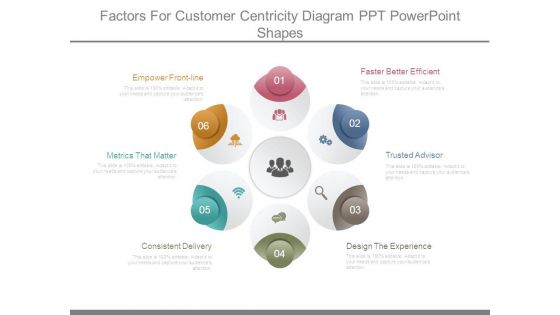
Factors For Customer Centricity Diagram Ppt Powerpoint Shapes
This is a factors for customer centricity diagram ppt powerpoint shapes. This is a six stage process. The stages in this process are faster better efficient, trusted advisor, design the experience, consistent delivery, metrics that matter, empower frontline.
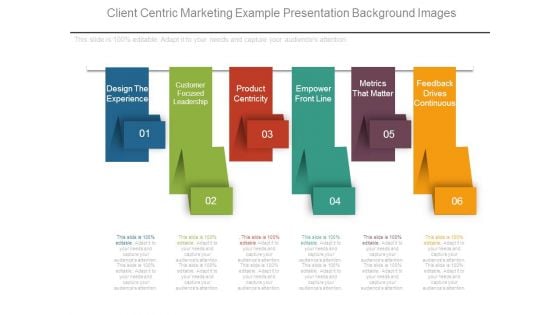
Client Centric Marketing Example Presentation Background Images
This is a client centric marketing example presentation background images. This is a six stage process. The stages in this process are design the experience, customer focused leadership, product centricity, empower front line, metrics that matter, feedback drives continuous.
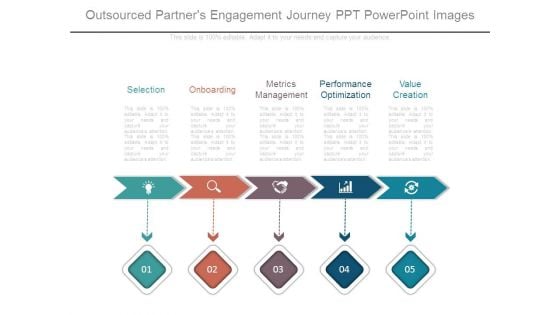
Outsourced Partners Engagement Journey Ppt Powerpoint Images
This is a outsourced partners engagement journey ppt powerpoint images. This is a five stage process. The stages in this process are selection, onboarding, metrics management, performance optimization, value creation.
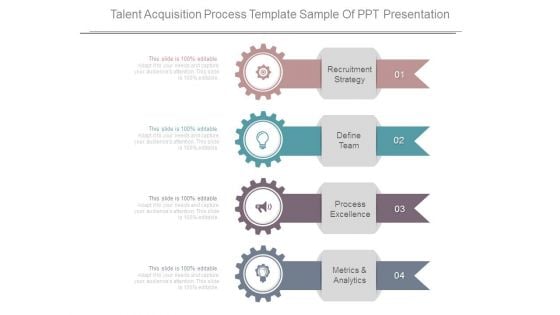
Talent Acquisition Process Template Sample Of Ppt Presentation
This is a talent acquisition process template sample of ppt presentation. This is a four stage process. The stages in this process are recruitment strategy, define team, process excellence, metrics and analyticas.
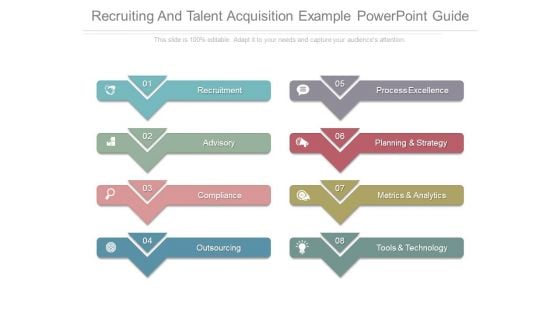
Recruiting And Talent Acquisition Example Powerpoint Guide
This is a recruiting and talent acquisition example powerpoint guide. This is a eight stage process. The stages in this process are recruitment, process excellence, advisory, planning and strategy, compliance, metrics and analytics, outsourcing, tools and technology.
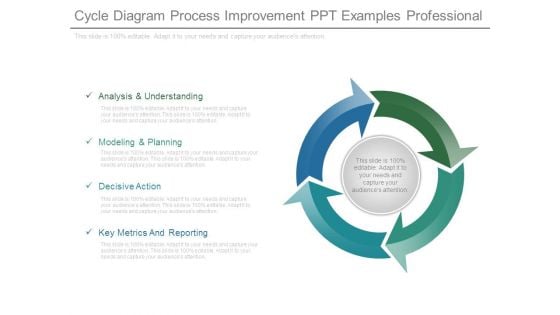
Cycle Diagram Process Improvement Ppt Examples Professional
This is a cycle diagram process improvement ppt examples professional. This is a four stage process. The stages in this process are analysis and understanding, modeling and planning, decisive action, key metrics and reporting.
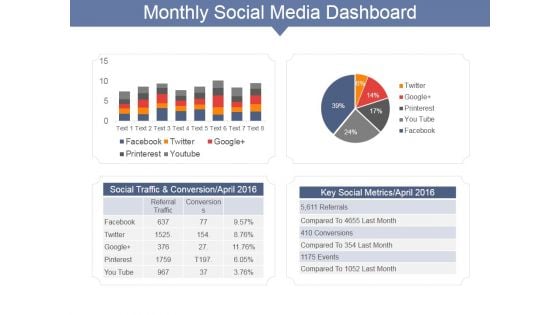
Monthly Social Media Dashboard Ppt PowerPoint Presentation Gallery Show
This is a monthly social media dashboard ppt powerpoint presentation gallery show. This is a two stage process. The stages in this process are social traffic and conversion april, key social metrics april, facebook, twitter.
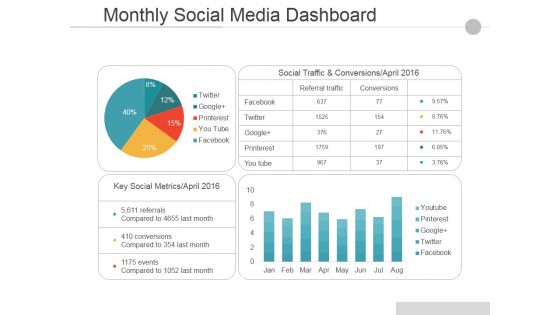
Monthly Social Media Dashboard Ppt PowerPoint Presentation Pictures Guide
This is a monthly social media dashboard ppt powerpoint presentation pictures guide. This is a two stage process. The stages in this process are social traffic and conversions april, key social metrics april, facebook, twitter, google.
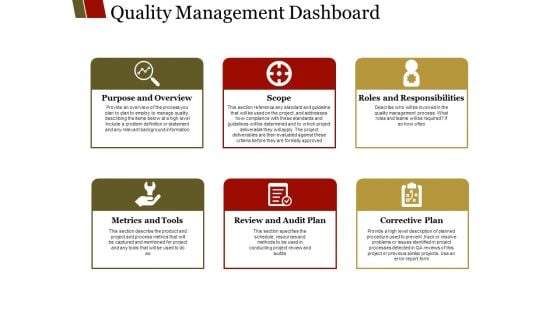
Quality Management Dashboard Ppt PowerPoint Presentation Professional Gridlines
This is a quality management dashboard ppt powerpoint presentation professional gridlines. This is a six stage process. The stages in this process are scope, purpose and overview, metrics and tools, review and audit, plan corrective plan.
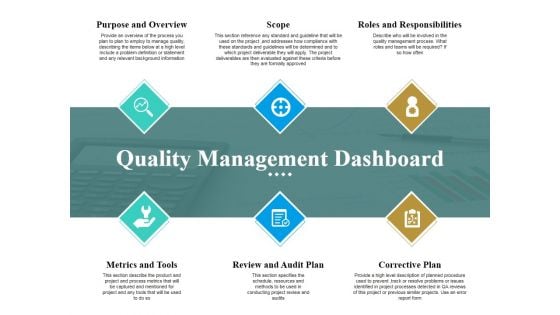
Quality Management Dashboard Ppt PowerPoint Presentation Outline Skills
This is a quality management dashboard ppt powerpoint presentation outline skills. This is a six stage process. The stages in this process are purpose and overview, scope, metrics and tools, review and audit plan, corrective plan.
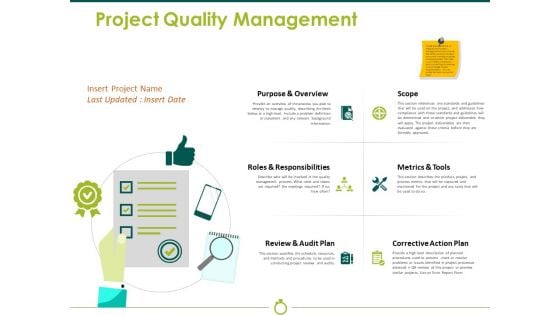
Project Quality Management Ppt PowerPoint Presentation Ideas Microsoft
This is a project quality management ppt powerpoint presentation ideas microsoft. This is a six stage process. The stages in this process are scope, metrics and tools, corrective action plan, review and audit plan, roles and responsibilities.

Project Quality Management Ppt PowerPoint Presentation Model Ideas
This is a project quality management ppt powerpoint presentation model ideas. This is a six stage process. The stages in this process are purpose and overview, roles and responsibilities, review and audit plan, scope, metrics and tools.
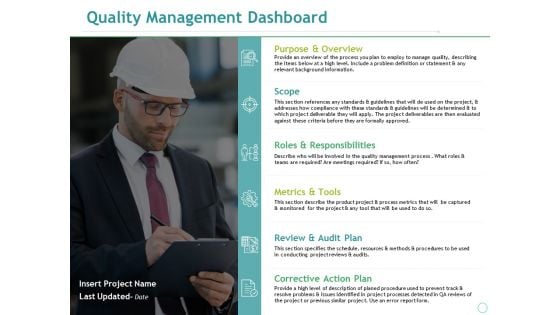
Quality Management Dashboard Ppt PowerPoint Presentation Ideas Template
This is a quality management dashboard ppt powerpoint presentation ideas template. This is a six stage process. The stages in this process are scope, metrics and tools, review and audit plan, corrective action plan, roles and responsibilities.
Quality Management Dashboard Ppt PowerPoint Presentation Icon Images
This is a quality management dashboard ppt powerpoint presentation icon images. This is a six stage process. The stages in this process are purpose and overview, scope, roles and responsibilities, metrics and tools, review and audit plan.
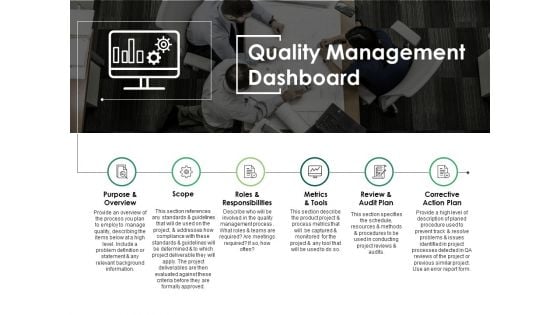
Quality Management Dashboard Ppt PowerPoint Presentation Infographics Graphics
This is a quality management dashboard ppt powerpoint presentation infographics graphics. This is a six stage process. The stages in this process are purpose and overview, scope, roles and responsibilities, metrics and tools, review and audit plan.
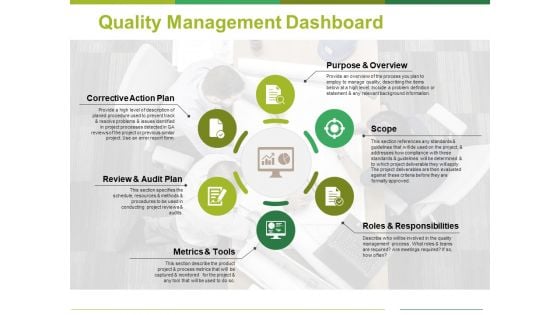
Quality Management Dashboard Ppt PowerPoint Presentation Styles Format Ideas
This is a quality management dashboard ppt powerpoint presentation styles format ideas. This is a six stage process. The stages in this process are scope, corrective action plan, metrics and tools, roles and responsibilities, purpose and overview.
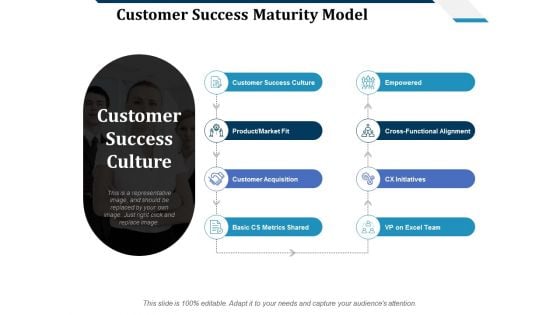
Customer Success Maturity Model Ppt PowerPoint Presentation Show Templates
This is a customer success maturity model ppt powerpoint presentation show templates. This is a eight stage process. The stages in this process are customer success culture, empowered, customer acquisition, basic cs metrics shared, vp on excel team.

Project Quality Management Ppt PowerPoint Presentation Professional Gallery
This is a project quality management ppt powerpoint presentation professional gallery. This is a six stage process. The stages in this process are corrective action plan, purpose and overview, metrics and tools.
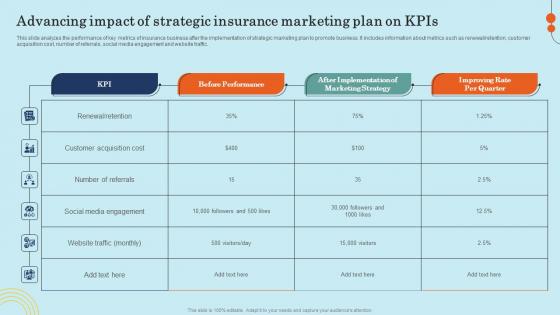
Advancing Impact Of Strategic Insurance Marketing Plan On Effective General Insurance Marketing Ideas Pdf
This slide analyzes the performance of key metrics of insurance business after the implementation of strategic marketing plan to promote business. It includes information about metrics such as renewalorretention, customer acquisition cost, number of referrals, social media engagement and website traffic. Find a pre-designed and impeccable Advancing Impact Of Strategic Insurance Marketing Plan On Effective General Insurance Marketing Ideas Pdf. The templates can ace your presentation without additional effort. You can download these easy-to-edit presentation templates to make your presentation stand out from others. So, what are you waiting for Download the template from Slidegeeks today and give a unique touch to your presentation. This slide analyzes the performance of key metrics of insurance business after the implementation of strategic marketing plan to promote business. It includes information about metrics such as renewalorretention, customer acquisition cost, number of referrals, social media engagement and website traffic.
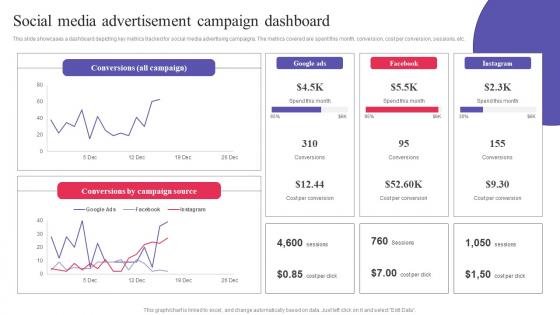
Social Media Advertisement Campaign Dashboard Digital Promotional Campaign Slides Pdf
This slide showcases a dashboard depicting key metrics tracked for social media advertising campaigns. The metrics covered are spent this month, conversion, cost per conversion, sessions, etc. Boost your pitch with our creative Social Media Advertisement Campaign Dashboard Digital Promotional Campaign Slides Pdf. Deliver an awe-inspiring pitch that will mesmerize everyone. Using these presentation templates you will surely catch everyones attention. You can browse the ppts collection on our website. We have researchers who are experts at creating the right content for the templates. So you do not have to invest time in any additional work. Just grab the template now and use them. This slide showcases a dashboard depicting key metrics tracked for social media advertising campaigns. The metrics covered are spent this month, conversion, cost per conversion, sessions, etc.
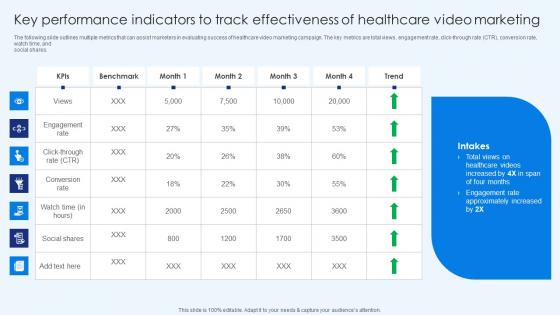
Healthcare Promotion Key Performance Indicators To Track Effectiveness Formats Pdf
The following slide outlines multiple metrics that can assist marketers in evaluating success of healthcare video marketing campaign. The key metrics are total views, engagement rate, click-through rate CTR, conversion rate, watch time, and social shares. Make sure to capture your audiences attention in your business displays with our gratis customizable Healthcare Promotion Key Performance Indicators To Track Effectiveness Formats Pdf. These are great for business strategies, office conferences, capital raising or task suggestions. If you desire to acquire more customers for your tech business and ensure they stay satisfied, create your own sales presentation with these plain slides. The following slide outlines multiple metrics that can assist marketers in evaluating success of healthcare video marketing campaign. The key metrics are total views, engagement rate, click-through rate CTR, conversion rate, watch time, and social shares.
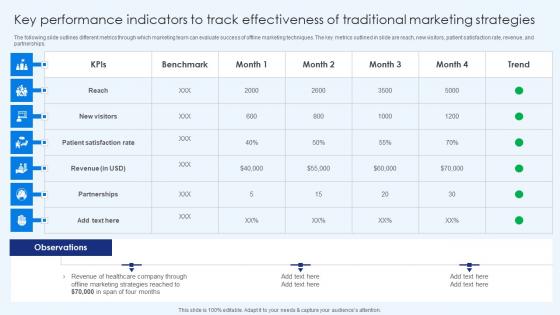
Key Performance Indicators To Track Effectivenes Healthcare Promotion Infographics Pdf
The following slide outlines different metrics through which marketing team can evaluate success of offline marketing techniques. The key metrics outlined in slide are reach, new visitors, patient satisfaction rate, revenue, and partnerships. The Key Performance Indicators To Track Effectivenes Healthcare Promotion Infographics Pdf is a compilation of the most recent design trends as a series of slides. It is suitable for any subject or industry presentation, containing attractive visuals and photo spots for businesses to clearly express their messages. This template contains a variety of slides for the user to input data, such as structures to contrast two elements, bullet points, and slides for written information. Slidegeeks is prepared to create an impression. The following slide outlines different metrics through which marketing team can evaluate success of offline marketing techniques. The key metrics outlined in slide are reach, new visitors, patient satisfaction rate, revenue, and partnerships.
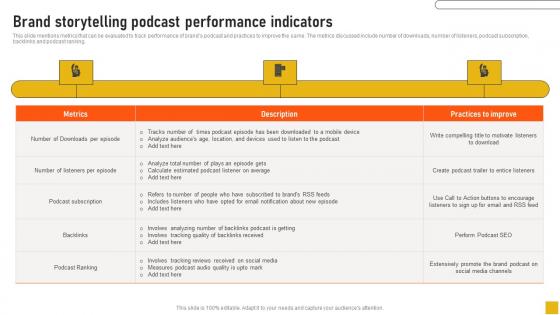
Brand Storytelling Podcast Performance Indicators Comprehensive Guide Structure Pdf
This slide mentions metrics that can be evaluated to track performance of brands podcast and practices to improve the same. The metrics discussed include number of downloads, number of listeners, podcast subscription, backlinks and podcast ranking. This Brand Storytelling Podcast Performance Indicators Comprehensive Guide Structure Pdf from Slidegeeks makes it easy to present information on your topic with precision. It provides customization options, so you can make changes to the colors, design, graphics, or any other component to create a unique layout. It is also available for immediate download, so you can begin using it right away. Slidegeeks has done good research to ensure that you have everything you need to make your presentation stand out. Make a name out there for a brilliant performance. This slide mentions metrics that can be evaluated to track performance of brands podcast and practices to improve the same. The metrics discussed include number of downloads, number of listeners, podcast subscription, backlinks and podcast ranking.
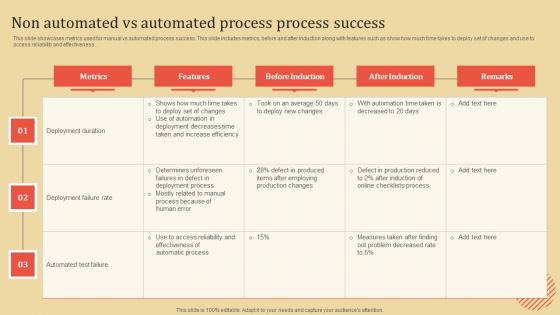
Non Automated Vs Automated Process Success Demonstration PDF
This slide showcases metrics used for manual vs automated process success. This slide includes metrics, before and after induction along with features such as show how much time takes to deploy set of changes and use to access reliability and effectiveness.Pitch your topic with ease and precision using this Non Automated Vs Automated Process Success Demonstration PDF This layout presents information on Deployment Duration, Deployment Failure, Automated Test Failure It is also available for immediate download and adjustment. So, changes can be made in the color, design, graphics or any other component to create a unique layout. This slide showcases metrics used for manual vs automated process success. This slide includes metrics, before and after induction along with features such as show how much time takes to deploy set of changes and use to access reliability and effectiveness.
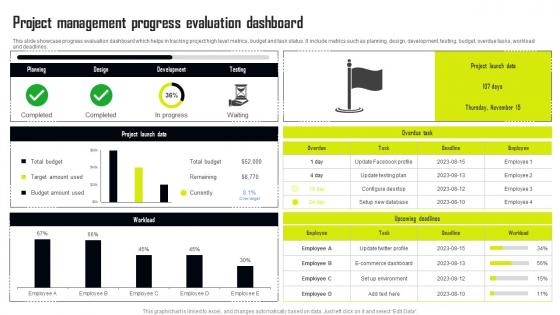
Project Management Progress Evaluation Dashboard Formats Pdf
This slide showcase progress evaluation dashboard which helps in tracking project high level metrics, budget and task status. It include metrics such as planning, design, development, testing, budget, overdue tasks, workload and deadlines. Pitch your topic with ease and precision using this Project Management Progress Evaluation Dashboard Formats Pdf This layout presents information on Planning, Design, Project Launch Data, Workload It is also available for immediate download and adjustment. So, changes can be made in the color, design, graphics or any other component to create a unique layout. This slide showcase progress evaluation dashboard which helps in tracking project high level metrics, budget and task status. It include metrics such as planning, design, development, testing, budget, overdue tasks, workload and deadlines.
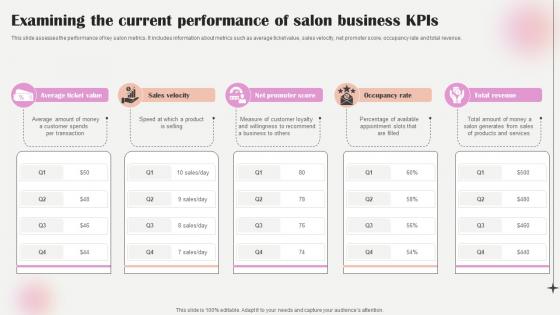
Salon Marketing Plan To Optimize Examining The Current Performance Of Salon Strategy SS V
This slide assesses the performance of key salon metrics. It includes information about metrics such as average ticket value, sales velocity, net promoter score, occupancy rate and total revenue. Are you searching for a Salon Marketing Plan To Optimize Examining The Current Performance Of Salon Strategy SS V that is uncluttered, straightforward, and original Its easy to edit, and you can change the colors to suit your personal or business branding. For a presentation that expresses how much effort you have put in, this template is ideal With all of its features, including tables, diagrams, statistics, and lists, its perfect for a business plan presentation. Make your ideas more appealing with these professional slides. Download Salon Marketing Plan To Optimize Examining The Current Performance Of Salon Strategy SS V from Slidegeeks today. This slide assesses the performance of key salon metrics. It includes information about metrics such as average ticket value, sales velocity, net promoter score, occupancy rate and total revenue.

Before Vs After Utilization Of IoT Platforms Exploring Google Cloud IoT Platform
This slide showcases the comparative analysis of the before versus after using IoT platforms. The purpose of this slide is to showcase the different performance metrics and how IoT platforms have improved these metrics. Get a simple yet stunning designed Before Vs After Utilization Of IoT Platforms Exploring Google Cloud IoT Platform It is the best one to establish the tone in your meetings. It is an excellent way to make your presentations highly effective. So, download this PPT today from Slidegeeks and see the positive impacts. Our easy to edit Before Vs After Utilization Of IoT Platforms Exploring Google Cloud IoT Platform can be your go to option for all upcoming conferences and meetings. So, what are you waiting for Grab this template today. This slide showcases the comparative analysis of the before versus after using IoT platforms. The purpose of this slide is to showcase the different performance metrics and how IoT platforms have improved these metrics.

Before Vs After Manual Testing Implementation Gray Box Testing Best Practices
This slide showcases the comparative analysis of the before versus after automation testing situation of the software. The purpose of this slide is to showcase the different performance metrics and how software testing has improved these metrics. Want to ace your presentation in front of a live audience Our Before Vs After Manual Testing Implementation Gray Box Testing Best Practices can help you do that by engaging all the users towards you. Slidegeeks experts have put their efforts and expertise into creating these impeccable powerpoint presentations so that you can communicate your ideas clearly. Moreover, all the templates are customizable, and easy-to-edit and downloadable. Use these for both personal and commercial use. This slide showcases the comparative analysis of the before versus after automation testing situation of the software. The purpose of this slide is to showcase the different performance metrics and how software testing has improved these metrics.
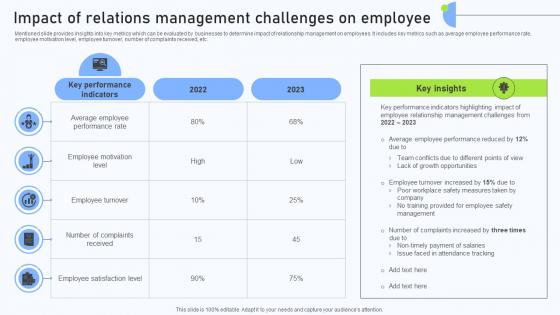
Relationship Management Automation Impact Of Relations Management Challenges
Mentioned slide provides insights into key metrics which can be evaluated by businesses to determine impact of relationship management on employees. It includes key metrics such as average employee performance rate, employee motivation level, employee turnover, number of complaints received, etc. Make sure to capture your audiences attention in your business displays with our gratis customizable Relationship Management Automation Impact Of Relations Management Challenges. These are great for business strategies, office conferences, capital raising or task suggestions. If you desire to acquire more customers for your tech business and ensure they stay satisfied, create your own sales presentation with these plain slides. Mentioned slide provides insights into key metrics which can be evaluated by businesses to determine impact of relationship management on employees. It includes key metrics such as average employee performance rate, employee motivation level, employee turnover, number of complaints received, etc.
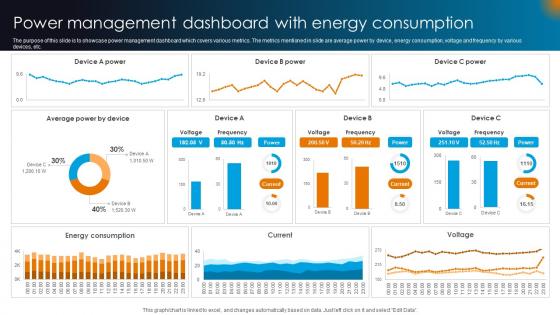
Integrating AI With IoT Power Management Dashboard With Energy Consumption IoT SS V
The purpose of this slide is to showcase power management dashboard which covers various metrics. The metrics mentioned in slide are average power by device, energy consumption, voltage and frequency by various devices, etc. Want to ace your presentation in front of a live audience Our Integrating AI With IoT Power Management Dashboard With Energy Consumption IoT SS V can help you do that by engaging all the users towards you. Slidegeeks experts have put their efforts and expertise into creating these impeccable powerpoint presentations so that you can communicate your ideas clearly. Moreover, all the templates are customizable, and easy-to-edit and downloadable. Use these for both personal and commercial use. The purpose of this slide is to showcase power management dashboard which covers various metrics. The metrics mentioned in slide are average power by device, energy consumption, voltage and frequency by various devices, etc.
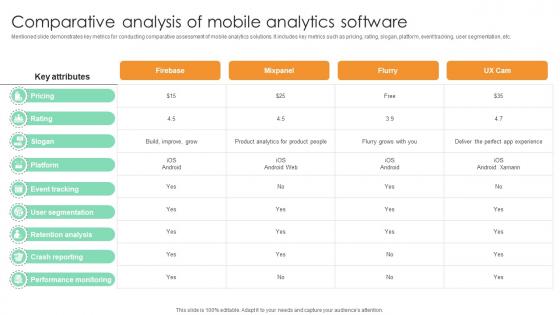
Comparative Analysis Of Mobile Analytics Software Comprehensive Guide For Marketing Technology
Mentioned slide demonstrates key metrics for conducting comparative assessment of mobile analytics solutions. It includes key metrics such as pricing, rating, slogan, platform, event tracking, user segmentation, etc.Find highly impressive Comparative Analysis Of Mobile Analytics Software Comprehensive Guide For Marketing Technology on Slidegeeks to deliver a meaningful presentation. You can save an ample amount of time using these presentation templates. No need to worry to prepare everything from scratch because Slidegeeks experts have already done a huge research and work for you. You need to download Comparative Analysis Of Mobile Analytics Software Comprehensive Guide For Marketing Technology for your upcoming presentation. All the presentation templates are 100 percent editable and you can change the color and personalize the content accordingly. Download now Mentioned slide demonstrates key metrics for conducting comparative assessment of mobile analytics solutions. It includes key metrics such as pricing, rating, slogan, platform, event tracking, user segmentation, etc.
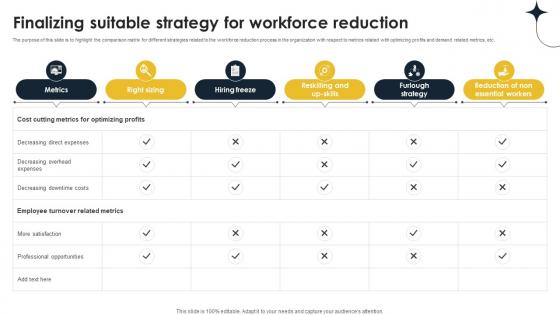
Finalizing Suitable Strategy For Workforce Implementing Personnel Downsizing Initiative
The purpose of this slide is to highlight the comparison matrix for different strategies related to the workforce reduction process in the organization with respect to metrics related with optimizing profits and demand related metrics, etc. From laying roadmaps to briefing everything in detail, our templates are perfect for you. You can set the stage with your presentation slides. All you have to do is download these easy-to-edit and customizable templates. Finalizing Suitable Strategy For Workforce Implementing Personnel Downsizing Initiative will help you deliver an outstanding performance that everyone would remember and praise you for. Do download this presentation today. The purpose of this slide is to highlight the comparison matrix for different strategies related to the workforce reduction process in the organization with respect to metrics related with optimizing profits and demand related metrics, etc.

Before Vs After Regression Testing Implementation Corrective Regression Testing Ppt Sample
This slide showcases the comparative analysis of the before versus after regression testing situation of the software. The purpose of this slide is to showcase the different performance metrics and how regression testing has improved these metrics. Create an editable Before Vs After Regression Testing Implementation Corrective Regression Testing Ppt Sample that communicates your idea and engages your audience. Whether you are presenting a business or an educational presentation, pre-designed presentation templates help save time. Before Vs After Regression Testing Implementation Corrective Regression Testing Ppt Sample is highly customizable and very easy to edit, covering many different styles from creative to business presentations. Slidegeeks has creative team members who have crafted amazing templates. So, go and get them without any delay. This slide showcases the comparative analysis of the before versus after regression testing situation of the software. The purpose of this slide is to showcase the different performance metrics and how regression testing has improved these metrics.

Before Vs After Utilization Of Iot Platforms Aws IOT Platform Ppt Example
This slide showcases the comparative analysis of the before versus after using IoT platforms. The purpose of this slide is to showcase the different performance metrics and how IoT platforms have improved these metrics. The best PPT templates are a great way to save time, energy, and resources. Slidegeeks have 100 percent editable powerpoint slides making them incredibly versatile. With these quality presentation templates, you can create a captivating and memorable presentation by combining visually appealing slides and effectively communicating your message. Download Before Vs After Utilization Of Iot Platforms Aws IOT Platform Ppt Example from Slidegeeks and deliver a wonderful presentation. This slide showcases the comparative analysis of the before versus after using IoT platforms. The purpose of this slide is to showcase the different performance metrics and how IoT platforms have improved these metrics.

Before Vs After Implementing Tokenization In Data Security Securing Your Data Ppt Example
This slide showcases the comparative analysis of the before versus after tokenization. The purpose of this slide is to showcase the different performance metrics and how tokenization has improved these metrics. Want to ace your presentation in front of a live audience Our Before Vs After Implementing Tokenization In Data Security Securing Your Data Ppt Example can help you do that by engaging all the users towards you. Slidegeeks experts have put their efforts and expertise into creating these impeccable powerpoint presentations so that you can communicate your ideas clearly. Moreover, all the templates are customizable, and easy-to-edit and downloadable. Use these for both personal and commercial use. This slide showcases the comparative analysis of the before versus after tokenization. The purpose of this slide is to showcase the different performance metrics and how tokenization has improved these metrics.

Before Vs After Automaton Testing Smoke Testing Ppt Example
This slide showcases the comparative analysis of the before versus after automation testing situation of the software. The purpose of this slide is to showcase the different performance metrics and how software testing has improved these metrics. From laying roadmaps to briefing everything in detail, our templates are perfect for you. You can set the stage with your presentation slides. All you have to do is download these easy-to-edit and customizable templates. Before Vs After Automaton Testing Smoke Testing Ppt Example will help you deliver an outstanding performance that everyone would remember and praise you for. Do download this presentation today. This slide showcases the comparative analysis of the before versus after automation testing situation of the software. The purpose of this slide is to showcase the different performance metrics and how software testing has improved these metrics.

Before Vs After Regression Automated Regression Testing And Achieving PPT PowerPoint
This slide showcases the comparative analysis of the before versus after regression testing situation of the software. The purpose of this slide is to showcase the different performance metrics and how regression testing has improved these metrics. Create an editable Before Vs After Regression Automated Regression Testing And Achieving PPT PowerPoint that communicates your idea and engages your audience. Whether you are presenting a business or an educational presentation, pre-designed presentation templates help save time. Before Vs After Regression Automated Regression Testing And Achieving PPT PowerPoint is highly customizable and very easy to edit, covering many different styles from creative to business presentations. Slidegeeks has creative team members who have crafted amazing templates. So, go and get them without any delay. This slide showcases the comparative analysis of the before versus after regression testing situation of the software. The purpose of this slide is to showcase the different performance metrics and how regression testing has improved these metrics.

Before Vs After Regression Partial Regression Testing For A Best PPT Slide
This slide showcases the comparative analysis of the before versus after regression testing situation of the software. The purpose of this slide is to showcase the different performance metrics and how regression testing has improved these metrics. Create an editable Before Vs After Regression Partial Regression Testing For A Best PPT Slide that communicates your idea and engages your audience. Whether you are presenting a business or an educational presentation, pre-designed presentation templates help save time. Before Vs After Regression Partial Regression Testing For A Best PPT Slide is highly customizable and very easy to edit, covering many different styles from creative to business presentations. Slidegeeks has creative team members who have crafted amazing templates. So, go and get them without any delay. This slide showcases the comparative analysis of the before versus after regression testing situation of the software. The purpose of this slide is to showcase the different performance metrics and how regression testing has improved these metrics.

Before Vs After Results Of Building The Future Of Robotic Ppt Slide
This slide showcases the comparative analysis of the before versus after using nanorobots situation. The purpose of this slide is to showcase the different performance metrics and how nanobots have improved these metrics.Want to ace your presentation in front of a live audience Our Before Vs After Results Of Building The Future Of Robotic Ppt Slide can help you do that by engaging all the users towards you. Slidegeeks experts have put their efforts and expertise into creating these impeccable powerpoint presentations so that you can communicate your ideas clearly. Moreover, all the templates are customizable, and easy-to-edit and downloadable. Use these for both personal and commercial use. This slide showcases the comparative analysis of the before versus after using nanorobots situation. The purpose of this slide is to showcase the different performance metrics and how nanobots have improved these metrics.

Before Vs After Results Of Nanorobotics Implementation PPT Template
This slide showcases the comparative analysis of the before versus after using nanorobots situation. The purpose of this slide is to showcase the different performance metrics and how nanobots have improved these metrics. Find a pre-designed and impeccable Before Vs After Results Of Nanorobotics Implementation PPT Template. The templates can ace your presentation without additional effort. You can download these easy-to-edit presentation templates to make your presentation stand out from others. So, what are you waiting for Download the template from Slidegeeks today and give a unique touch to your presentation. This slide showcases the comparative analysis of the before versus after using nanorobots situation. The purpose of this slide is to showcase the different performance metrics and how nanobots have improved these metrics.

Before Vs After Implementing Tokenization In Data Security PPT Template
This slide showcases the comparative analysis of the before versus after tokenization. The purpose of this slide is to showcase the different performance metrics and how tokenization has improved these metrics. Find a pre-designed and impeccable Before Vs After Implementing Tokenization In Data Security PPT Template. The templates can ace your presentation without additional effort. You can download these easy-to-edit presentation templates to make your presentation stand out from others. So, what are you waiting for Download the template from Slidegeeks today and give a unique touch to your presentation. This slide showcases the comparative analysis of the before versus after tokenization. The purpose of this slide is to showcase the different performance metrics and how tokenization has improved these metrics.
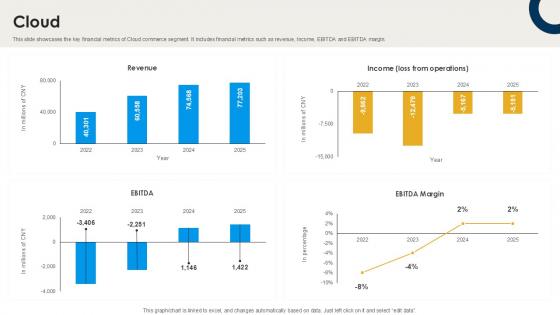
Cloud International Trade Of Products And Services PPT Sample CP SS V
This slide showcases the key financial metrics of Cloud commerce segment. It includes financial metrics such as revenue, Income, EBITDA and EBITDA margin. Do you have to make sure that everyone on your team knows about any specific topic I yes, then you should give Cloud International Trade Of Products And Services PPT Sample CP SS V a try. Our experts have put a lot of knowledge and effort into creating this impeccable Cloud International Trade Of Products And Services PPT Sample CP SS V. You can use this template for your upcoming presentations, as the slides are perfect to represent even the tiniest detail. You can download these templates from the Slidegeeks website and these are easy to edit. So grab these today This slide showcases the key financial metrics of Cloud commerce segment. It includes financial metrics such as revenue, Income, EBITDA and EBITDA margin.
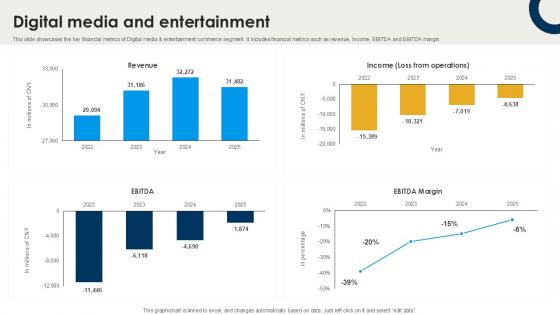
Digital Media And Entertainment International Trade Of Products And Services PPT Example CP SS V
This slide showcases the key financial metrics of Digital media and entertainment commerce segment. It includes financial metrics such as revenue, Income, EBITDA and EBITDA margin. Whether you have daily or monthly meetings, a brilliant presentation is necessary. Digital Media And Entertainment International Trade Of Products And Services PPT Example CP SS V can be your best option for delivering a presentation. Represent everything in detail using Digital Media And Entertainment International Trade Of Products And Services PPT Example CP SS V and make yourself stand out in meetings. The template is versatile and follows a structure that will cater to your requirements. All the templates prepared by Slidegeeks are easy to download and edit. Our research experts have taken care of the corporate themes as well. So, give it a try and see the results. This slide showcases the key financial metrics of Digital media and entertainment commerce segment. It includes financial metrics such as revenue, Income, EBITDA and EBITDA margin.
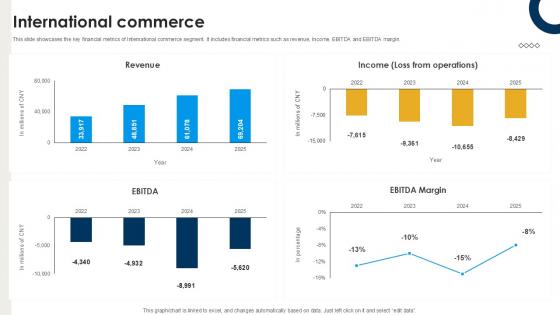
International Commerce International Trade Of Products And Services PPT Presentation CP SS V
This slide showcases the key financial metrics of International commerce segment. It includes financial metrics such as revenue, Income, EBITDA and EBITDA margin. Coming up with a presentation necessitates that the majority of the effort goes into the content and the message you intend to convey. The visuals of a PowerPoint presentation can only be effective if it supplements and supports the story that is being told. Keeping this in mind our experts created International Commerce International Trade Of Products And Services PPT Presentation CP SS V to reduce the time that goes into designing the presentation. This way, you can concentrate on the message while our designers take care of providing you with the right template for the situation. This slide showcases the key financial metrics of International commerce segment. It includes financial metrics such as revenue, Income, EBITDA and EBITDA margin.
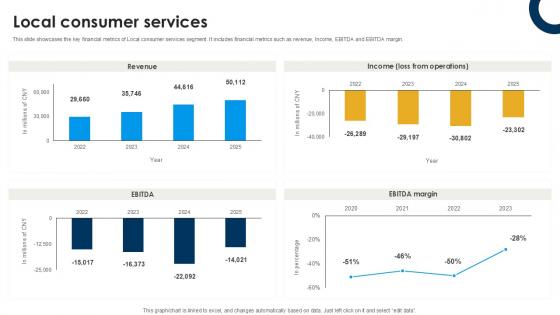
Local Consumer Services International Trade Of Products And Services PPT Example CP SS V
This slide showcases the key financial metrics of Local consumer services segment. It includes financial metrics such as revenue, Income, EBITDA and EBITDA margin. Welcome to our selection of the Local Consumer Services International Trade Of Products And Services PPT Example CP SS V. These are designed to help you showcase your creativity and bring your sphere to life. Planning and Innovation are essential for any business that is just starting out. This collection contains the designs that you need for your everyday presentations. All of our PowerPoints are 100Percent editable, so you can customize them to suit your needs. This multi-purpose template can be used in various situations. Grab these presentation templates today. This slide showcases the key financial metrics of Local consumer services segment. It includes financial metrics such as revenue, Income, EBITDA and EBITDA margin.
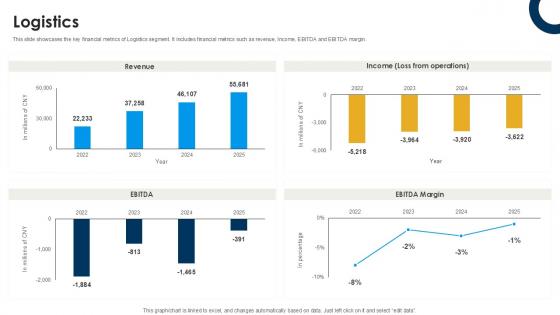
Logistics International Trade Of Products And Services PPT Sample CP SS V
This slide showcases the key financial metrics of Logistics segment. It includes financial metrics such as revenue, Income, EBITDA and EBITDA margin. Explore a selection of the finest Logistics International Trade Of Products And Services PPT Sample CP SS V here. With a plethora of professionally designed and pre-made slide templates, you can quickly and easily find the right one for your upcoming presentation. You can use our Logistics International Trade Of Products And Services PPT Sample CP SS V to effectively convey your message to a wider audience. Slidegeeks has done a lot of research before preparing these presentation templates. The content can be personalized and the slides are highly editable. Grab templates today from Slidegeeks. This slide showcases the key financial metrics of Logistics segment. It includes financial metrics such as revenue, Income, EBITDA and EBITDA margin.
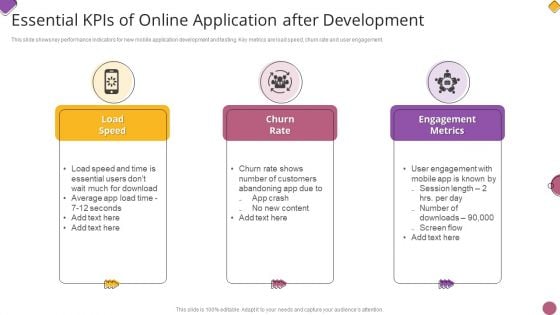
Essential Kpis Of Online Application After Development Themes PDF
This slide shows key performance indicators for new mobile application development and testing. Key metrics are load speed, churn rate and user engagement.Presenting Essential Kpis Of Online Application After Development Themes PDF to dispense important information. This template comprises three stages. It also presents valuable insights into the topics including Engagement Metrics, Engagement, Much Download. This is a completely customizable PowerPoint theme that can be put to use immediately. So, download it and address the topic impactfully.
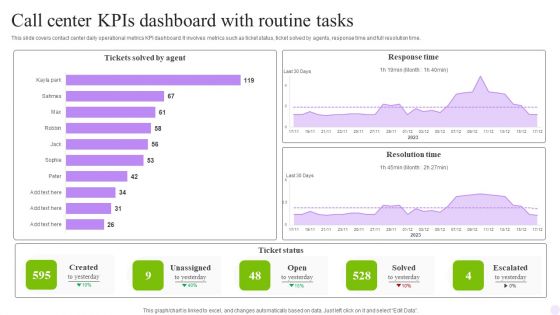
Call Center Kpis Dashboard With Routine Tasks Structure PDF
This slide covers contact center daily operational metrics KPI dashboard. It involves metrics such as ticket status, ticket solved by agents, response time and full resolution time. Pitch your topic with ease and precision using this Call Center Kpis Dashboard With Routine Tasks Structure PDF. This layout presents information on Agent, Response Time, Routine Tasks. It is also available for immediate download and adjustment. So, changes can be made in the color, design, graphics or any other component to create a unique layout.
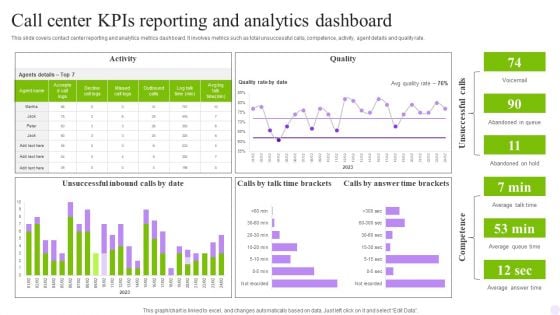
Call Center Kpis Reporting And Analytics Dashboard Download PDF
This slide covers contact center reporting and analytics metrics dashboard. It involves metrics such as total unsuccessful calls, competence, activity, agent details and quality rate. Pitch your topic with ease and precision using this Call Center Kpis Reporting And Analytics Dashboard Download PDF. This layout presents information on Activity, Quality, Dashboard. It is also available for immediate download and adjustment. So, changes can be made in the color, design, graphics or any other component to create a unique layout.
HR Recruitment Dashboard Kpis With Active Pipeline Ppt Icon Slide Portrait PDF
This slide showcases the recruitment dashboard metrics to know monthly hiring rate. It include KPIs like sources, decline reasons, active pipeline, recruitment funnel. Showcasing this set of slides titled HR Recruitment Dashboard Kpis With Active Pipeline Ppt Icon Slide Portrait PDF. The topics addressed in these templates are Recruitment Funnel, Monthly Metrics, Application Sources. All the content presented in this PPT design is completely editable. Download it and make adjustments in color, background, font etc. as per your unique business setting.
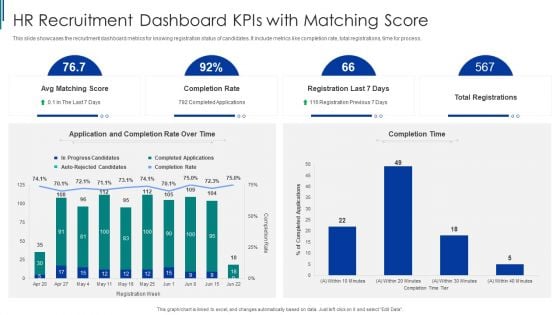
HR Recruitment Dashboard Kpis With Matching Score Ppt Layouts Example PDF
This slide showcases the recruitment dashboard metrics for knowing registration status of candidates. It include metrics like completion rate, total registrations, time for process. Showcasing this set of slides titled HR Recruitment Dashboard Kpis With Matching Score Ppt Layouts Example PDF. The topics addressed in these templates are Completion Rate, Application And Completion, HR Recruitment. All the content presented in this PPT design is completely editable. Download it and make adjustments in color, background, font etc. as per your unique business setting.
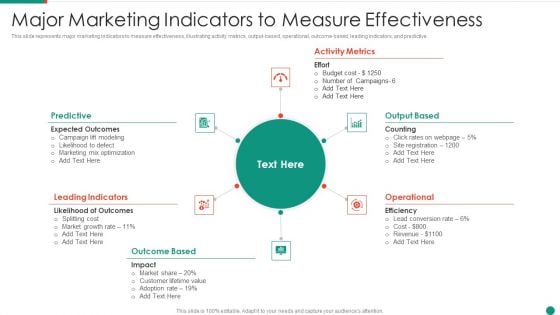
Major Marketing Indicators To Measure Effectiveness Mockup PDF
This slide represents major marketing indicators to measure effectiveness, illustrating activity metrics, output-based, operational, outcome-based, leading indicators, and predictive.Presenting Major Marketing Indicators To Measure Effectiveness Mockup PDF to dispense important information. This template comprises six stages. It also presents valuable insights into the topics including Leading Indicators, Outcome Based, Activity Metrics This is a completely customizable PowerPoint theme that can be put to use immediately. So, download it and address the topic impactfully.


 Continue with Email

 Home
Home


