Phases
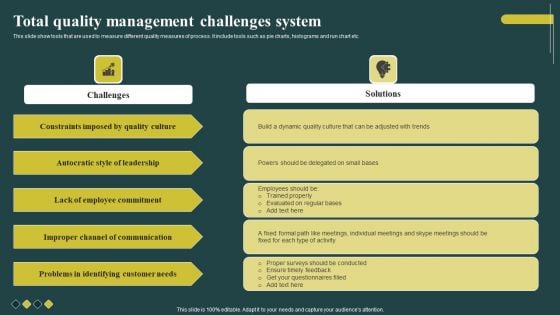
Total Quality Management Challenges System Themes PDF
This slide show tools that are used to measure different quality measures of process. It include tools such as pie charts, histograms and run chart etc. Showcasing this set of slides titled Total Quality Management Challenges System Themes PDF. The topics addressed in these templates are Employee Commitment, Communication, Customer Needs. All the content presented in this PPT design is completely editable. Download it and make adjustments in color, background, font etc. as per your unique business setting.
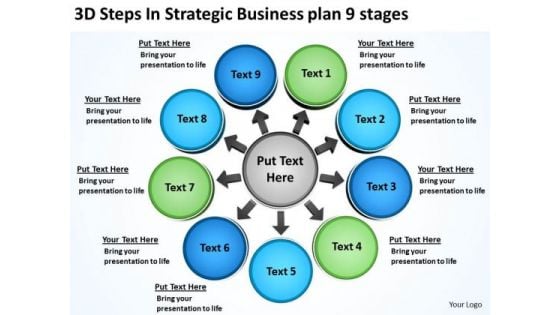
PowerPoint Presentations Plan 9 Stages Circular Flow Process Chart Slides
We present our powerpoint presentations plan 9 stages Circular Flow Process Chart Slides.Present our Circle Charts PowerPoint Templates because you can Determine your targets and sequence them as per your priorities. Download and present our Arrows PowerPoint Templates because this diagram helps you to explain your strategy to co-ordinate activities of these seperate groups. Download and present our Business PowerPoint Templates because your thoughts are pointed and sharp as arrows. Download and present our Shapes PowerPoint Templates because you can asked to strive to give true form to your great dream. Present our Flow Charts PowerPoint Templates because this diagram provides multiple options for taking in and making sense of information.Use these PowerPoint slides for presentations relating to abstract, arrow, arrow circle, business concept, career, center stage, chart, circle, circle arrow diagram, color full, connection, contrast, cycle, diagram, direction, flow, flowchart, future, graph, icon, illustration, isolate, isolated, job, life, loop, money, motion, network, recycle, refresh, ring, rotation, sick, sign, symbol, symply, target, wealth,. The prominent colors used in the PowerPoint template are Blue, Green, Gray. Customers tell us our powerpoint presentations plan 9 stages Circular Flow Process Chart Slides will help you be quick off the draw. Just enter your specific text and see your points hit home. PowerPoint presentation experts tell us our business PowerPoint templates and PPT Slides are Liberated. People tell us our powerpoint presentations plan 9 stages Circular Flow Process Chart Slides are Cheerful. People tell us our business PowerPoint templates and PPT Slides are Sparkling. Customers tell us our powerpoint presentations plan 9 stages Circular Flow Process Chart Slides are Glamorous. People tell us our concept PowerPoint templates and PPT Slides are Dazzling. Our PowerPoint Presentations Plan 9 Stages Circular Flow Process Chart Slides will never fight shy. They are confident of addressing any and every issue.
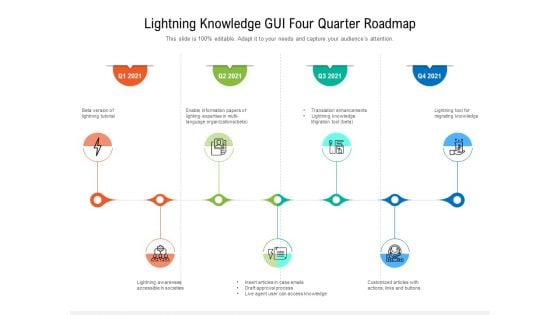
Lightning Knowledge GUI Four Quarter Roadmap Themes
Presenting our innovatively structured lightning knowledge gui four quarter roadmap themes Template. Showcase your roadmap process in different formats like PDF, PNG, and JPG by clicking the download button below. This PPT design is available in both Standard Screen and Widescreen aspect ratios. It can also be easily personalized and presented with modified font size, font type, color, and shapes to measure your progress in a clear way.
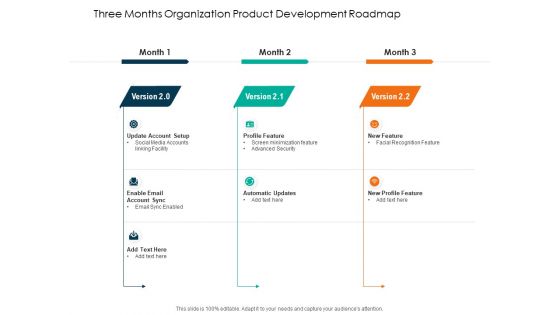
Three Months Organization Product Development Roadmap Themes
Introducing our three months organization product development roadmap themes. This PPT presentation is Google Slides compatible, therefore, you can share it easily with the collaborators for measuring the progress. Also, the presentation is available in both standard screen and widescreen aspect ratios. So edit the template design by modifying the font size, font type, color, and shapes as per your requirements. As this PPT design is fully editable it can be presented in PDF, JPG and PNG formats.
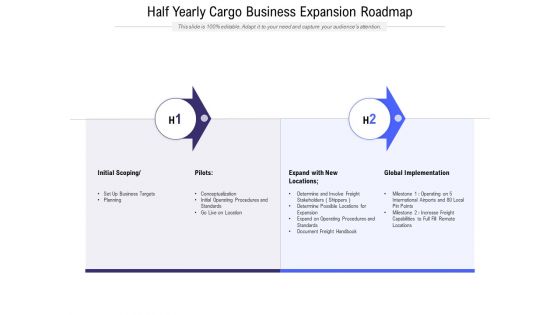
Half Yearly Cargo Business Expansion Roadmap Themes
Introducing our half yearly cargo business expansion roadmap themes. This PPT presentation is Google Slides compatible, therefore, you can share it easily with the collaborators for measuring the progress. Also, the presentation is available in both standard screen and widescreen aspect ratios. So edit the template design by modifying the font size, font type, color, and shapes as per your requirements. As this PPT design is fully editable it can be presented in PDF, JPG and PNG formats.
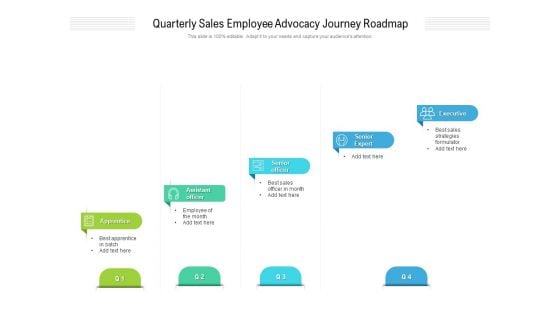
Quarterly Sales Employee Advocacy Journey Roadmap Themes
Presenting our jaw dropping quarterly sales employee advocacy journey roadmap themes. You can alternate the color, font size, font type, and shapes of this PPT layout according to your strategic process. This PPT presentation is compatible with Google Slides and is available in both standard screen and widescreen aspect ratios. You can also download this well researched PowerPoint template design in different formats like PDF, JPG, and PNG. So utilize this visually appealing design by clicking the download button given below.

Digital Marketing Training Four Quarter Roadmap Themes
Presenting our innovatively structured digital marketing training four quarter roadmap themes Template. Showcase your roadmap process in different formats like PDF, PNG, and JPG by clicking the download button below. This PPT design is available in both Standard Screen and Widescreen aspect ratios. It can also be easily personalized and presented with modified font size, font type, color, and shapes to measure your progress in a clear way.
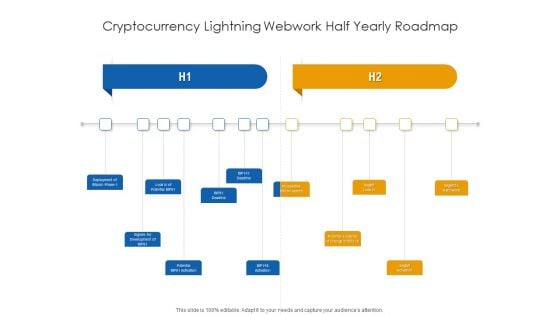
Cryptocurrency Lightning Webwork Half Yearly Roadmap Themes
Presenting our jaw-dropping cryptocurrency lightning webwork half yearly roadmap themes. You can alternate the color, font size, font type, and shapes of this PPT layout according to your strategic process. This PPT presentation is compatible with Google Slides and is available in both standard screen and widescreen aspect ratios. You can also download this well-researched PowerPoint template design in different formats like PDF, JPG, and PNG. So utilize this visually-appealing design by clicking the download button given below.
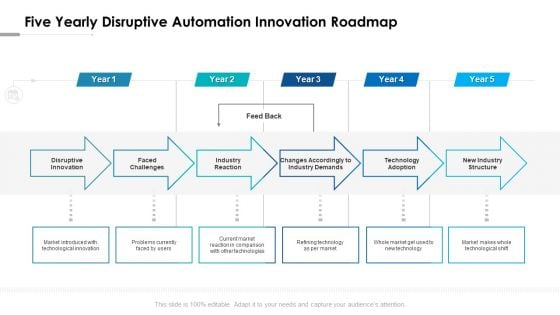
Five Yearly Disruptive Automation Innovation Roadmap Themes
Presenting our jaw dropping five yearly disruptive automation innovation roadmap themes. You can alternate the color, font size, font type, and shapes of this PPT layout according to your strategic process. This PPT presentation is compatible with Google Slides and is available in both standard screen and widescreen aspect ratios. You can also download this well researched PowerPoint template design in different formats like PDF, JPG, and PNG. So utilize this visually appealing design by clicking the download button given below.
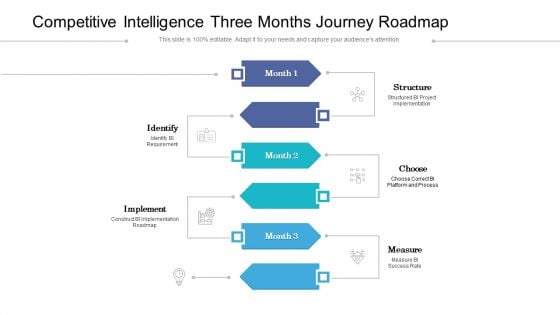
Competitive Intelligence Three Months Journey Roadmap Themes
Introducing our competitive intelligence three months journey roadmap themes. This PPT presentation is Google Slides compatible, therefore, you can share it easily with the collaborators for measuring the progress. Also, the presentation is available in both standard screen and widescreen aspect ratios. So edit the template design by modifying the font size, font type, color, and shapes as per your requirements. As this PPT design is fully editable it can be presented in PDF, JPG and PNG formats.
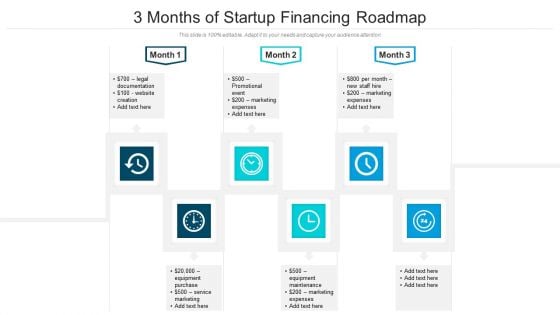
3 Months Of Startup Financing Roadmap Themes
Introducing our 3 months of startup financing roadmap themes. This PPT presentation is Google Slides compatible, therefore, you can share it easily with the collaborators for measuring the progress. Also, the presentation is available in both standard screen and widescreen aspect ratios. So edit the template design by modifying the font size, font type, color, and shapes as per your requirements. As this PPT design is fully editable it can be presented in PDF, JPG and PNG formats.
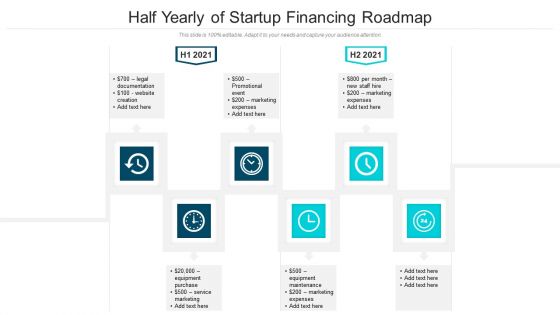
Half Yearly Of Startup Financing Roadmap Themes
Introducing our half yearly of startup financing roadmap themes. This PPT presentation is Google Slides compatible, therefore, you can share it easily with the collaborators for measuring the progress. Also, the presentation is available in both standard screen and widescreen aspect ratios. So edit the template design by modifying the font size, font type, color, and shapes as per your requirements. As this PPT design is fully editable it can be presented in PDF, JPG and PNG formats.
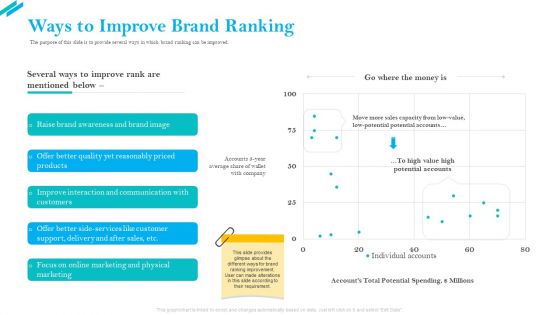
SCR For Market Ways To Improve Brand Ranking Ppt Diagram Graph Charts PDF
The purpose of this slide is to provide several ways in which brand ranking can be improved. Deliver and pitch your topic in the best possible manner with this SCR for market ways to improve brand ranking ppt diagram graph charts pdf. Use them to share invaluable insights on quality yet reasonably priced products, improve interaction and communication with customers, focus on online marketing and physical marketing, potential accounts and impress your audience. This template can be altered and modified as per your expectations. So, grab it now.

Risk Due Diligence For M And A Ppt Diagram Graph Charts PDF
The following slide showcases the approach and execution of due diligence for mergers and acquisitions. It depicts M and A strategy, target screening, transaction execution, integration, divestiture and key insights. Showcasing this set of slides titled Risk Due Diligence For M And A Ppt Diagram Graph Charts PDF. The topics addressed in these templates are Approach Risk, Handoff Risk, Execution Risk, Transaction Curve. All the content presented in this PPT design is completely editable. Download it and make adjustments in color, background, font etc. as per your unique business setting.
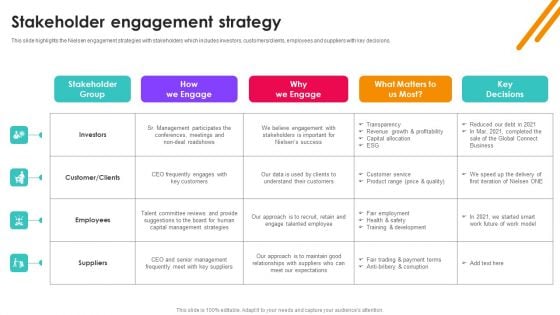
Nielsen Business Profile Stakeholder Engagement Strategy Ppt PowerPoint Presentation Diagram Graph Charts PDF
This slide highlights the Nielsen engagement strategies with stakeholders which includes investors, customers or clients, employees and suppliers with key decisions. The Nielsen Business Profile Stakeholder Engagement Strategy Ppt PowerPoint Presentation Diagram Graph Charts PDF is a compilation of the most recent design trends as a series of slides. It is suitable for any subject or industry presentation, containing attractive visuals and photo spots for businesses to clearly express their messages. This template contains a variety of slides for the user to input data, such as structures to contrast two elements, bullet points, and slides for written information. Slidegeeks is prepared to create an impression.
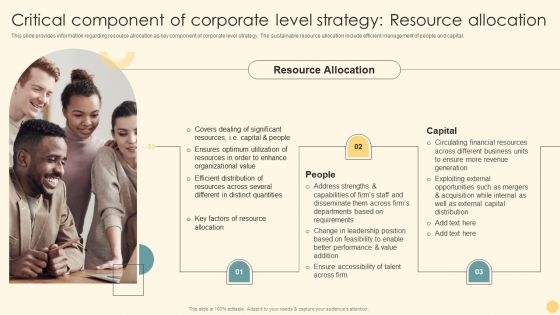
Critical Component Of Corporate Level Strategy Resource Allocation Ppt PowerPoint Presentation Diagram Graph Charts PDF
This slide provides information regarding resource allocation as key component of corporate level strategy. The sustainable resource allocation include efficient management of people and capital. From laying roadmaps to briefing everything in detail, our templates are perfect for you. You can set the stage with your presentation slides. All you have to do is download these easy to edit and customizable templates. Critical Component Of Corporate Level Strategy Resource Allocation Ppt PowerPoint Presentation Diagram Graph Charts PDF will help you deliver an outstanding performance that everyone would remember and praise you for. Do download this presentation today.
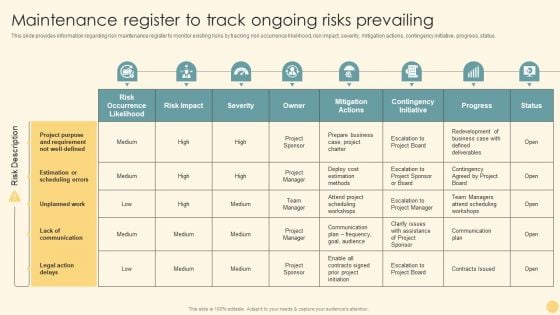
Maintenance Register To Track Ongoing Risks Prevailing Ppt PowerPoint Presentation Diagram Graph Charts PDF
This slide provides information regarding risk maintenance register to monitor existing risks by tracking risk occurrence likelihood, risk impact, severity, mitigation actions, contingency initiative, progress, status. Want to ace your presentation in front of a live audience Our Maintenance Register To Track Ongoing Risks Prevailing Ppt PowerPoint Presentation Diagram Graph Charts PDF can help you do that by engaging all the users towards you. Slidegeeks experts have put their efforts and expertise into creating these impeccable powerpoint presentations so that you can communicate your ideas clearly. Moreover, all the templates are customizable, and easy to edit and downloadable. Use these for both personal and commercial use.
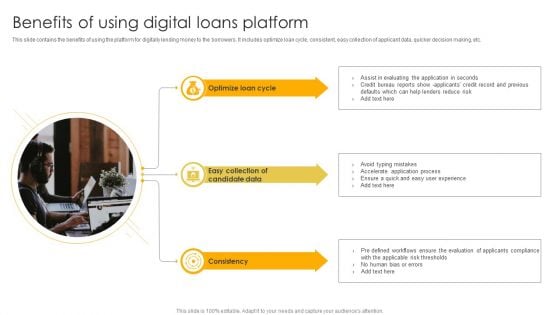
Benefits Of Using Digital Loans Platform Ppt Diagram Graph Charts PDF
This slide contains the benefits of using the platform for digitally lending money to the borrowers. It includes optimize loan cycle, consistent, easy collection of applicant data, quicker decision making, etc. Persuade your audience using this Benefits Of Using Digital Loans Platform Ppt Diagram Graph Charts PDF. This PPT design covers three stages, thus making it a great tool to use. It also caters to a variety of topics including Optimize Loan Cycle, Easy Collection, Candidate Data. Download this PPT design now to present a convincing pitch that not only emphasizes the topic but also showcases your presentation skills.
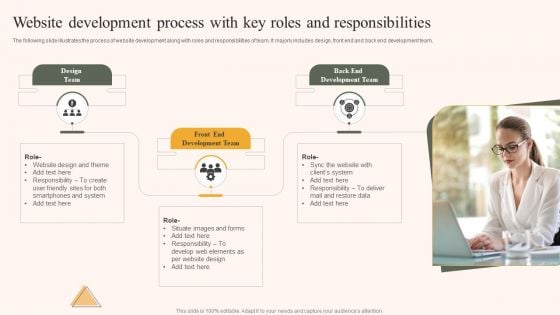
Website Development Process With Key Roles And Responsibilities Ppt Diagram Graph Charts PDF
The following slide illustrates the process of website development along with roles and responsibilities of team. It majorly includes design, front end and back end development team. Persuade your audience using this Website Development Process With Key Roles And Responsibilities Ppt Diagram Graph Charts PDF. This PPT design covers three stages, thus making it a great tool to use. It also caters to a variety of topics including Back End Development, Team, Front End, Development Team. Download this PPT design now to present a convincing pitch that not only emphasizes the topic but also showcases your presentation skills.
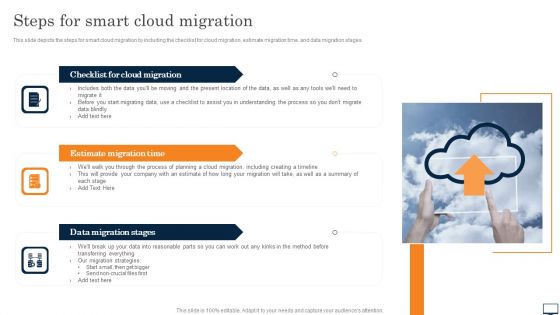
Steps For Smart Cloud Migration Ppt PowerPoint Presentation Diagram Graph Charts PDF
This slide depicts the steps for smart cloud migration by including the checklist for cloud migration, estimate migration time, and data migration stages. From laying roadmaps to briefing everything in detail, our templates are perfect for you. You can set the stage with your presentation slides. All you have to do is download these easy to edit and customizable templates. Steps For Smart Cloud Migration Ppt PowerPoint Presentation Diagram Graph Charts PDF will help you deliver an outstanding performance that everyone would remember and praise you for. Do download this presentation today.
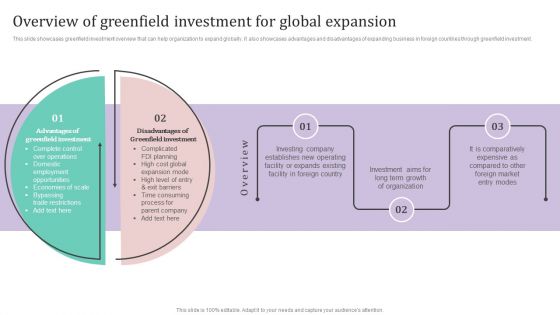
Overview Of Greenfield Investment For Global Expansion Ppt PowerPoint Presentation Diagram Graph Charts PDF
This slide showcases greenfield investment overview that can help organization to expand globally. It also showcases advantages and disadvantages of expanding business in foreign countries through greenfield investment.The best PPT templates are a great way to save time, energy, and resources. Slidegeeks have 100precent editable powerpoint slides making them incredibly versatile. With these quality presentation templates, you can create a captivating and memorable presentation by combining visually appealing slides and effectively communicating your message. Download Overview Of Greenfield Investment For Global Expansion Ppt PowerPoint Presentation Diagram Graph Charts PDF from Slidegeeks and deliver a wonderful presentation.
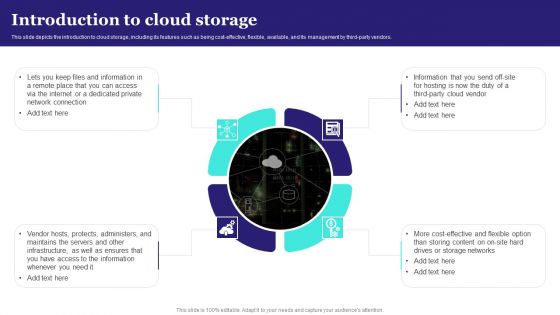
Introduction To Cloud Storage Ppt PowerPoint Presentation Diagram Graph Charts PDF
This slide depicts the introduction to cloud storage, including its features such as being cost-effective, flexible, available, and its management by third party vendors. This modern and well arranged Introduction To Cloud Storage Ppt PowerPoint Presentation Diagram Graph Charts PDF provides lots of creative possibilities. It is very simple to customize and edit with the Powerpoint Software. Just drag and drop your pictures into the shapes. All facets of this template can be edited with Powerpoint no extra software is necessary. Add your own material, put your images in the places assigned for them, adjust the colors, and then you can show your slides to the world, with an animated slide included.
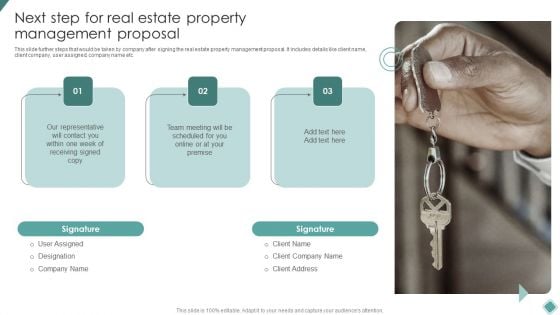
Next Step For Real Estate Property Management Proposal Ppt Diagram Graph Charts PDF
This slide further steps that would be taken by company after signing the real estate property management proposal. It includes details like client name, client company, user assigned, company name etc. Stand out from the crowd with our dynamic Next Step For Real Estate Property Management Proposal Ppt Diagram Graph Charts PDF template. Designed to help you make a statement, this single-slide PPT template is fully customizable to suit your unique needs. With eye-catching visuals and seamless editing options, you can create impactful presentations in minutes. Say goodbye to boring slides and unlock your presentation potential with our top-notch template.
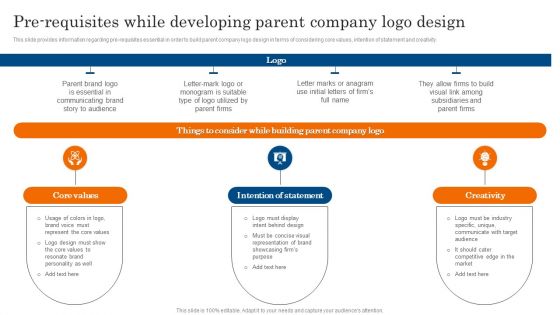
Pre Requisites While Developing Parent Company Logo Design Ppt PowerPoint Presentation Diagram Graph Charts PDF
This slide provides information regarding pre requisites essential in order to build parent company logo design in terms of considering core values, intention of statement and creativity. The Pre Requisites While Developing Parent Company Logo Design Ppt PowerPoint Presentation Diagram Graph Charts PDF is a compilation of the most recent design trends as a series of slides. It is suitable for any subject or industry presentation, containing attractive visuals and photo spots for businesses to clearly express their messages. This template contains a variety of slides for the user to input data, such as structures to contrast two elements, bullet points, and slides for written information. Slidegeeks is prepared to create an impression.
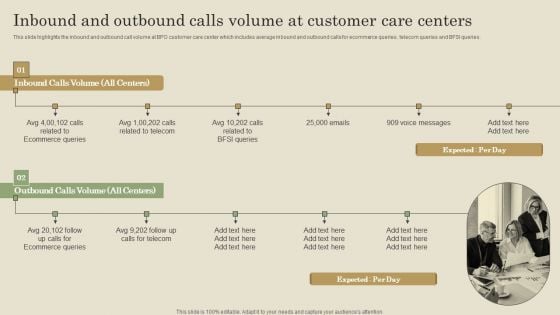
Inbound And Outbound Calls Volume At Customer Care Centers Ppt PowerPoint Presentation Diagram Graph Charts PDF
This slide highlights the inbound and outbound call volume at BPO customer care center which includes average inbound and outbound calls for ecommerce queries , telecom queries and BFSI queries. If your project calls for a presentation, then Slidegeeks is your go to partner because we have professionally designed, easy to edit templates that are perfect for any presentation. After downloading, you can easily edit Inbound And Outbound Calls Volume At Customer Care Centers Ppt PowerPoint Presentation Diagram Graph Charts PDF and make the changes accordingly. You can rearrange slides or fill them with different images. Check out all the handy templates
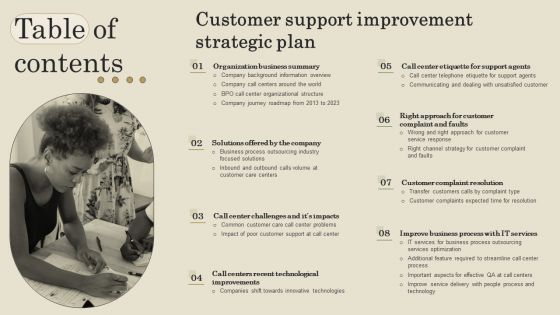
Table Of Contents Customer Support Improvement Strategic Plan Ppt PowerPoint Presentation Diagram Graph Charts PDF
Coming up with a presentation necessitates that the majority of the effort goes into the content and the message you intend to convey. The visuals of a PowerPoint presentation can only be effective if it supplements and supports the story that is being told. Keeping this in mind our experts created Table Of Contents Customer Support Improvement Strategic Plan Ppt PowerPoint Presentation Diagram Graph Charts PDF to reduce the time that goes into designing the presentation. This way, you can concentrate on the message while our designers take care of providing you with the right template for the situation.
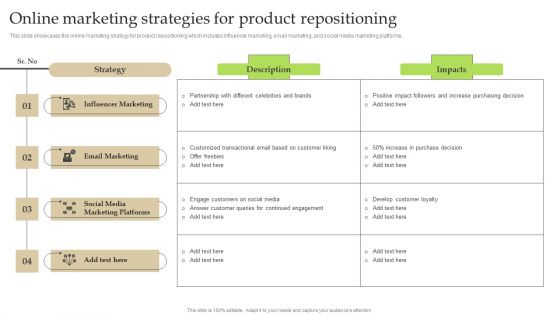
Online Marketing Strategies For Product Repositioning Ppt PowerPoint Presentation Diagram Graph Charts PDF
This slide showcases the online marketing strategy for product repositioning which includes influencer marketing, email marketing, and social media marketing platforms. Present like a pro with Online Marketing Strategies For Product Repositioning Ppt PowerPoint Presentation Diagram Graph Charts PDF Create beautiful presentations together with your team, using our easy-to-use presentation slides. Share your ideas in real-time and make changes on the fly by downloading our templates. So whether you are in the office, on the go, or in a remote location, you can stay in sync with your team and present your ideas with confidence. With Slidegeeks presentation got a whole lot easier. Grab these presentations today.
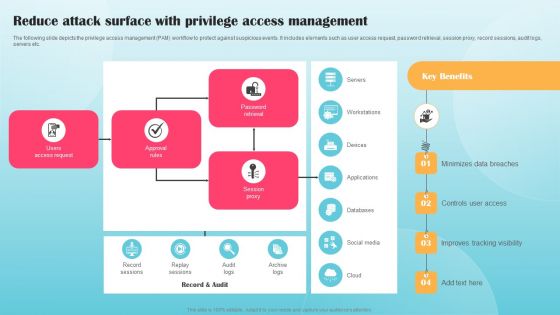
Reduce Attack Surface With Privilege Access Management Ppt PowerPoint Presentation Diagram Graph Charts PDF
The following slide depicts the privilege access management PAM workflow to protect against suspicious events. It includes elements such as user access request, password retrieval, session proxy, record sessions, audit logs, servers etc. Want to ace your presentation in front of a live audience Our Reduce Attack Surface With Privilege Access Management Ppt PowerPoint Presentation Diagram Graph Charts PDF can help you do that by engaging all the users towards you. Slidegeeks experts have put their efforts and expertise into creating these impeccable powerpoint presentations so that you can communicate your ideas clearly. Moreover, all the templates are customizable, and easy to edit and downloadable. Use these for both personal and commercial use.
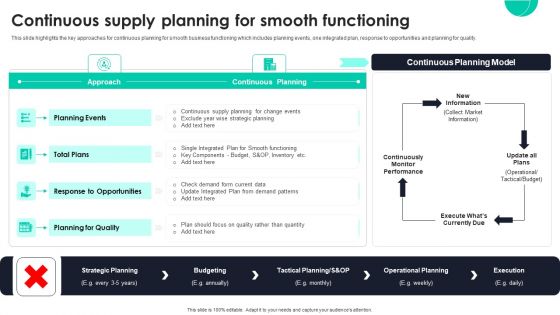
Continuous Supply Planning For Smooth Functioning Ppt PowerPoint Presentation Diagram Graph Charts PDF
This slide highlights the key approaches for continuous planning for smooth business functioning which includes planning events, one integrated plan, response to opportunities and planning for quality. From laying roadmaps to briefing everything in detail, our templates are perfect for you. You can set the stage with your presentation slides. All you have to do is download these easy to edit and customizable templates. Continuous Supply Planning For Smooth Functioning Ppt PowerPoint Presentation Diagram Graph Charts PDF will help you deliver an outstanding performance that everyone would remember and praise you for. Do download this presentation today.
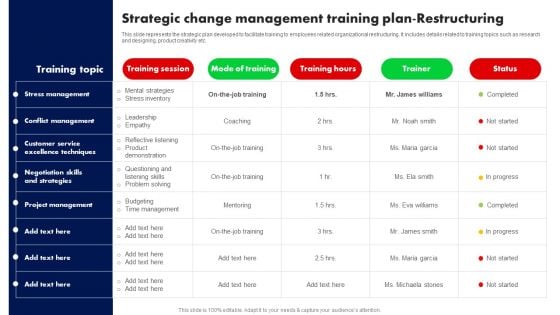
Strategic Change Management Training Plan Restructuring Ppt PowerPoint Presentation Diagram Graph Charts PDF
This slide represents the strategic plan developed to facilitate training to employees related organizational restructuring. It includes details related to training topics such as research and designing, product creativity etc. Take your projects to the next level with our ultimate collection of Strategic Change Management Training Plan Restructuring Ppt PowerPoint Presentation Diagram Graph Charts PDF. Slidegeeks has designed a range of layouts that are perfect for representing task or activity duration, keeping track of all your deadlines at a glance. Tailor these designs to your exact needs and give them a truly corporate look with your own brand colors they will make your projects stand out from the rest.
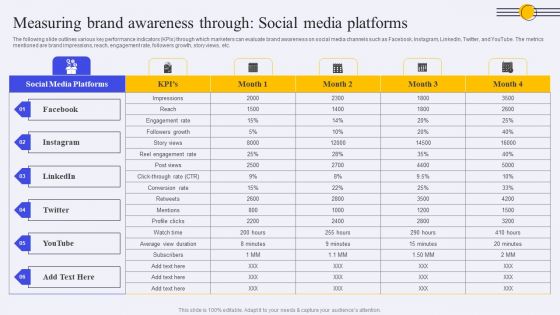
Measuring Brand Awareness Through Social Media Platforms Ppt PowerPoint Presentation Diagram Graph Charts PDF
The following slide outlines various key performance indicators KPIs through which marketers can evaluate brand awareness on social media channels such as Facebook, Instagram, LinkedIn, Twitter, and YouTube. The metrics mentioned are brand impressions, reach, engagement rate, followers growth, story views, etc. The best PPT templates are a great way to save time, energy, and resources. Slidegeeks have 100 percent editable powerpoint slides making them incredibly versatile. With these quality presentation templates, you can create a captivating and memorable presentation by combining visually appealing slides and effectively communicating your message. Download Measuring Brand Awareness Through Social Media Platforms Ppt PowerPoint Presentation Diagram Graph Charts PDF from Slidegeeks and deliver a wonderful presentation.
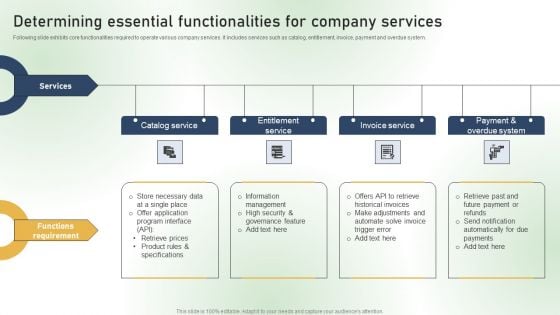
Determining Essential Functionalities For Company Services Ppt PowerPoint Presentation Diagram Graph Charts PDF
Following slide exhibits core functionalities required to operate various company services. It includes services such as catalog, entitlement, invoice, payment and overdue system. This modern and well arranged Determining Essential Functionalities For Company Services Ppt PowerPoint Presentation Diagram Graph Charts PDF provides lots of creative possibilities. It is very simple to customize and edit with the Powerpoint Software. Just drag and drop your pictures into the shapes. All facets of this template can be edited with Powerpoint no extra software is necessary. Add your own material, put your images in the places assigned for them, adjust the colors, and then you can show your slides to the world, with an animated slide included.
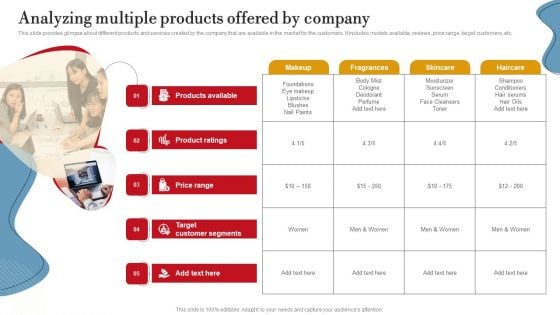
Analyzing Multiple Products Offered By Company Ppt PowerPoint Presentation Diagram Graph Charts PDF
This slide provides glimpse about different products and services created by the company that are available in the market for the customers. It includes models available, reviews, price range, target customers, etc. Find a pre designed and impeccable Analyzing Multiple Products Offered By Company Ppt PowerPoint Presentation Diagram Graph Charts PDF. The templates can ace your presentation without additional effort. You can download these easy to edit presentation templates to make your presentation stand out from others. So, what are you waiting for Download the template from Slidegeeks today and give a unique touch to your presentation.
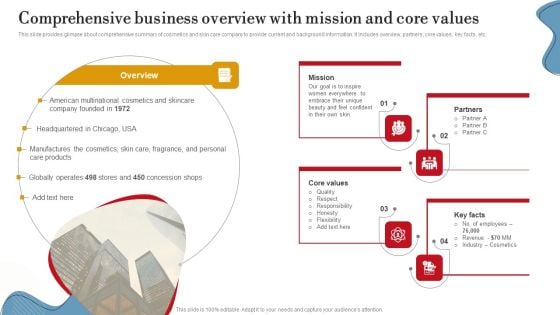
Comprehensive Business Overview With Mission And Core Values Ppt PowerPoint Presentation Diagram Graph Charts PDF
This slide provides glimpse about comprehensive summary of cosmetics and skin care company to provide current and background information. It includes overview, partners, core values, key facts, etc. Want to ace your presentation in front of a live audience Our Comprehensive Business Overview With Mission And Core Values Ppt PowerPoint Presentation Diagram Graph Charts PDF can help you do that by engaging all the users towards you. Slidegeeks experts have put their efforts and expertise into creating these impeccable powerpoint presentations so that you can communicate your ideas clearly. Moreover, all the templates are customizable, and easy to edit and downloadable. Use these for both personal and commercial use.
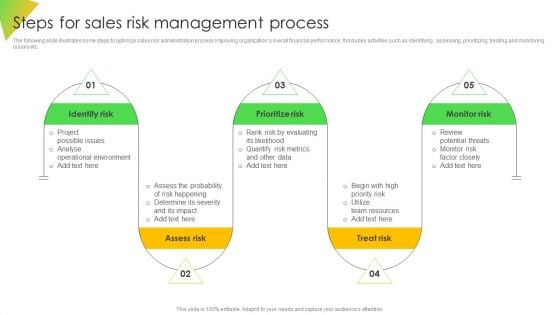
Steps For Sales Risk Management Process Ppt Diagram Graph Charts PDF
The following slide illustrates some steps to optimize sales risk administration process improving organizations overall financial performance. It includes activities such as identifying , assessing, prioritizing, treating and monitoring issues etc. The Steps For Sales Risk Management Process Ppt Diagram Graph Charts PDF is a compilation of the most recent design trends as a series of slides. It is suitable for any subject or industry presentation, containing attractive visuals and photo spots for businesses to clearly express their messages. This template contains a variety of slides for the user to input data, such as structures to contrast two elements, bullet points, and slides for written information. Slidegeeks is prepared to create an impression.
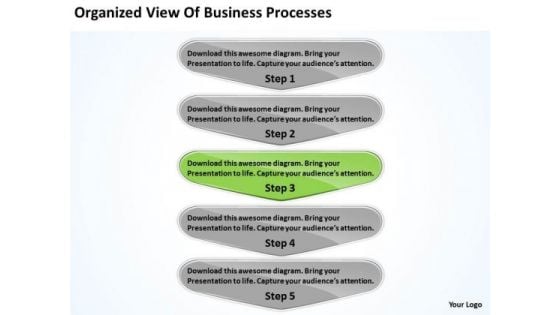
View Of Business PowerPoint Theme Processes Free Plans Software Slides
We present our view of business powerpoint theme processes free plans software Slides.Download and present our Marketing PowerPoint Templates because The marketplace is the merger of your dreams and your ability. Use our Business PowerPoint Templates because the fruits of your labour are beginning to show.Enlighten them on the great plans you have for their enjoyment. Download our Arrow PowerPoint Templates because chain reactions are the element of teamwork which add value to your efforts. Present our Process and Flows PowerPoint Templates because it demonstrates the seeds of many of our successes. Download our Flow chart PowerPoint Templates because you require care and diligence to function well.Use these PowerPoint slides for presentations relating to Arrow, badge,banner, black, blank, business, button, collection,color, decoration, design, direction,elegance, element, empty, financial, flow,gradient, graph, green, grey, horizontal,illustration, isolated, label, menu, placard,process, push, retail, round, sale, set,shape, shiny, silver, steps, symbol,. The prominent colors used in the PowerPoint template are Green, Black, Gray. PowerPoint presentation experts tell us our view of business powerpoint theme processes free plans software Slides are Gorgeous. PowerPoint presentation experts tell us our collection PowerPoint templates and PPT Slides are Tasteful. You can be sure our view of business powerpoint theme processes free plans software Slides are Versatile. You can be sure our blank PowerPoint templates and PPT Slides are Spectacular. PowerPoint presentation experts tell us our view of business powerpoint theme processes free plans software Slides are Handsome. People tell us our banner PowerPoint templates and PPT Slides are Charming. Our View Of Business PowerPoint Theme Processes Free Plans Software Slides keep the faith alive. Belief in you will get stronger.
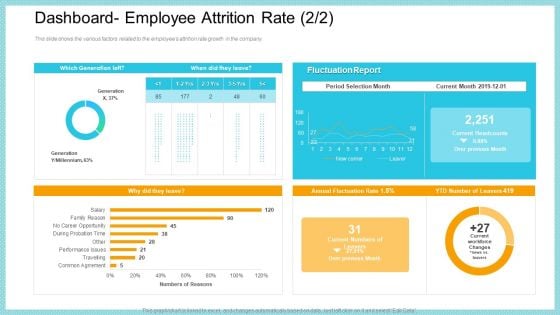
Dashboard Employee Attrition Rate Growth Diagrams PDF
This slide shows the various factors related to the employees attrition rate growth in the company. Deliver and pitch your topic in the best possible manner with this dashboard employee attrition rate growth diagrams pdf. Use them to share invaluable insights on dashboard employee attrition rate and impress your audience. This template can be altered and modified as per your expectations. So, grab it now.
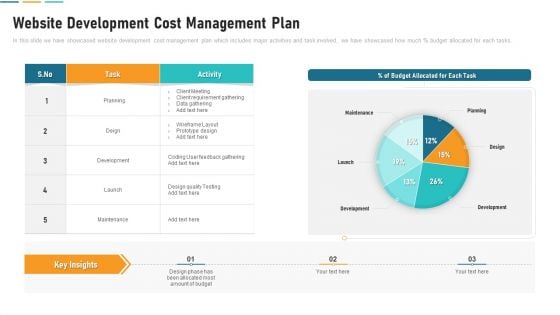
Website Development Cost Management Plan Diagrams PDF
In this slide we have showcased website development cost management plan which includes major activities and task involved, we have showcased how much percentage budget allocated for each tasks. Pitch your topic with ease and precision using this website development cost management plan diagrams pdf. This layout presents information on planning, development, maintenance. It is also available for immediate download and adjustment. So, changes can be made in the color, design, graphics or any other component to create a unique layout
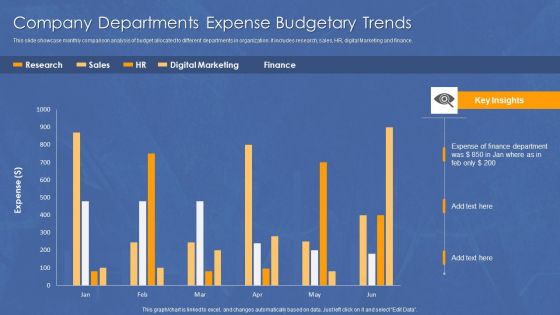
Company Departments Expense Budgetary Trends Diagrams PDF
This slide showcase monthly comparison analysis of budget allocated to different departments in organization. It includes research, sales, HR, digital Marketing and finance. Pitch your topic with ease and precision using this Company Departments Expense Budgetary Trends Diagrams PDF. This layout presents information on Expense, Finance, Department. It is also available for immediate download and adjustment. So, changes can be made in the color, design, graphics or any other component to create a unique layout.
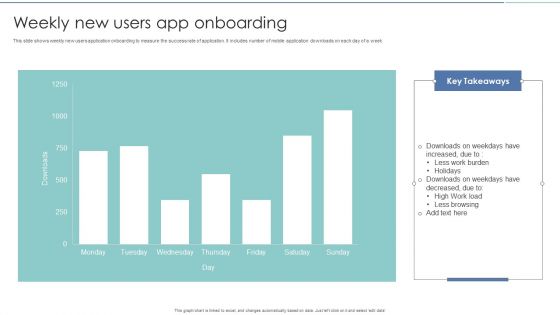
Weekly New Users App Onboarding Diagrams PDF
This slide shows weekly new users application onboarding to measure the success rate of application. It includes number of mobile application downloads on each day of a week. Pitch your topic with ease and precision using this Weekly New Users App Onboarding Diagrams PDF. This layout presents information on Weekly New Users, App Onboarding. It is also available for immediate download and adjustment. So, changes can be made in the color, design, graphics or any other component to create a unique layout.
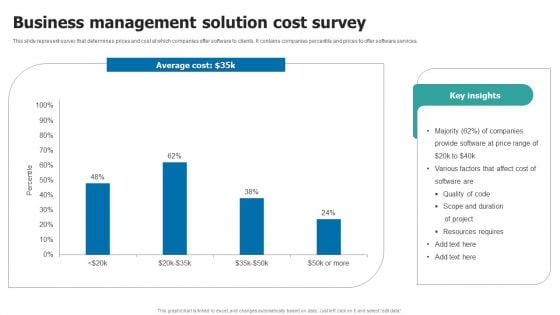
Business Management Solution Cost Survey Diagrams PDF
This slide represent survey that determines prices and cost at which companies offer software to clients. It contains companies percentile and prices to offer software services. Showcasing this set of slides titled Business Management Solution Cost Survey Diagrams PDF. The topics addressed in these templates are Business Management, Solution Cost Survey. All the content presented in this PPT design is completely editable. Download it and make adjustments in color, background, font etc. as per your unique business setting.

Devops Project Incident Administration Dashboard Diagrams PDF
This slide depicts developer operations DevOps project incident management dashboard. It provides information about after hour, daytime, escalation policy, escalations made, etc. Showcasing this set of slides titled Devops Project Incident Administration Dashboard Diagrams PDF. The topics addressed in these templates are Devops Project Incident, Administration Dashboard. All the content presented in this PPT design is completely editable. Download it and make adjustments in color, background, font etc. as per your unique business setting.
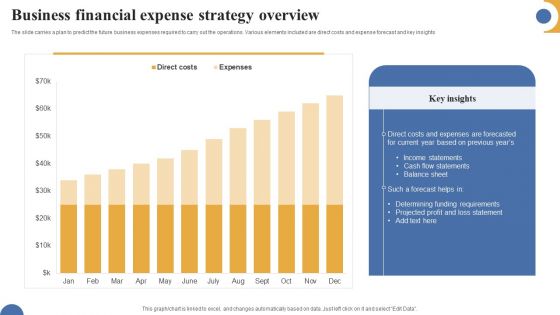
Business Financial Expense Strategy Overview Diagrams PDF
The slide carries a plan to predict the future business expenses required to carry out the operations. Various elements included are direct costs and expense forecast and key insights Showcasing this set of slides titled Business Financial Expense Strategy Overview Diagrams PDF. The topics addressed in these templates are Overview, Key Insights, Statements. All the content presented in this PPT design is completely editable. Download it and make adjustments in color, background, font etc. as per your unique business setting.
Stages To Implement Social Media Audit With Icons Ppt PowerPoint Presentation Icon Diagrams PDF
Presenting stages to implement social media audit with icons ppt powerpoint presentation icon diagrams pdf. to dispense important information. This template comprises four stages. It also presents valuable insights into the topics including gather information, evaluate data, highlight key issues, summarize findings. This is a completely customizable PowerPoint theme that can be put to use immediately. So, download it and address the topic impactfully.
Steps Of Innovative Product Deployment Process With Icons Ppt PowerPoint Presentation Icon Diagrams PDF
Presenting steps of innovative product deployment process with icons ppt powerpoint presentation icon diagrams pdf to dispense important information. This template comprises eight stages. It also presents valuable insights into the topics including deploy, success, target. This is a completely customizable PowerPoint theme that can be put to use immediately. So, download it and address the topic impactfully.
Swot Analysis Icon Diagram Of Equity Portfolio Management Ppt PowerPoint Presentation Icon Professional PDF
Presenting swot analysis icon diagram of equity portfolio management ppt powerpoint presentation icon professional pdf to dispense important information. This template comprises four stages. It also presents valuable insights into the topics including strengths, weaknesses, opportunities. This is a completely customizable PowerPoint theme that can be put to use immediately. So, download it and address the topic impactfully.
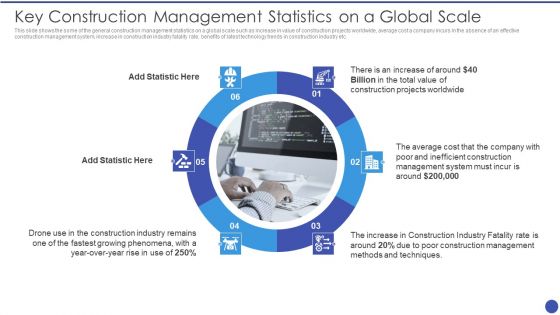
Management Techniques Key Construction Management Statistics On A Global Scale Diagrams PDF
This slide shows the some of the general construction management statistics on a global scale such as increase in value of construction projects worldwide, average cost a company incurs in the absence of an effective construction management system, increase in construction industry fatality rate, benefits of latest technology trends in construction industry etc. Presenting Management Techniques Key Construction Management Statistics On A Global Scale Diagrams PDF to provide visual cues and insights. Share and navigate important information on six stages that need your due attention. This template can be used to pitch topics like Total Value, Projects Worldwide, Poor Construction Management, Methods And Techniques. In addtion, this PPT design contains high resolution images, graphics, etc, that are easily editable and available for immediate download.
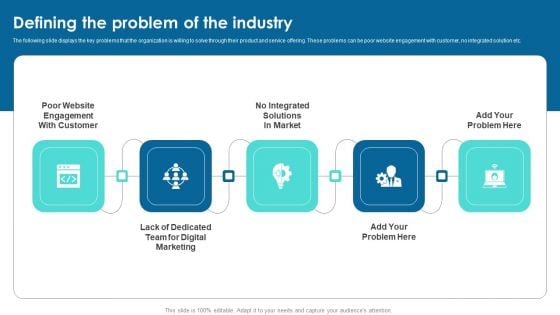
Defining The Problem Of The Industry Inbound Marketing Business Fundraising Elevator Diagrams PDF
The following slide displays the key problems that the organization is willing to solve through their product and service offering. These problems can be poor website engagement with customer, no integrated solution etc. Slidegeeks is one of the best resources for PowerPoint templates. You can download easily and regulate Defining The Problem Of The Industry Inbound Marketing Business Fundraising Elevator Diagrams PDF for your personal presentations from our wonderful collection. A few clicks is all it takes to discover and get the most relevant and appropriate templates. Use our Templates to add a unique zing and appeal to your presentation and meetings. All the slides are easy to edit and you can use them even for advertisement purposes.
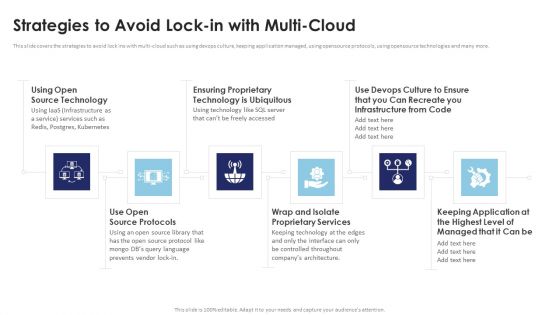
Multi Cloud Infrastructure Management Strategies To Avoid Lock In With Multi Cloud Diagrams PDF
This slide covers the strategies to avoid lock ins with multi-cloud such as using devops culture, keeping application managed, using opensource protocols, using opensource technologies and many more. Slidegeeks has constructed Multi Cloud Infrastructure Management Strategies To Avoid Lock In With Multi Cloud Diagrams PDF after conducting extensive research and examination. These presentation templates are constantly being generated and modified based on user preferences and critiques from editors. Here, you will find the most attractive templates for a range of purposes while taking into account ratings and remarks from users regarding the content. This is an excellent jumping-off point to explore our content and will give new users an insight into our top-notch PowerPoint Templates.
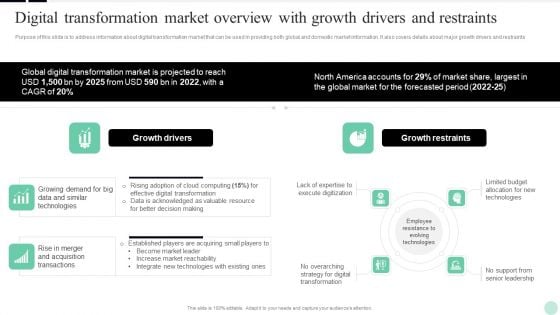
Implementing Digital Transformation Digital Transformation Market Overview With Growth Diagrams PDF
Purpose of this slide is to address information about digital transformation market that can be used in providing both global and domestic market information. It also covers details about major growth drivers and restraints. Coming up with a presentation necessitates that the majority of the effort goes into the content and the message you intend to convey. The visuals of a PowerPoint presentation can only be effective if it supplements and supports the story that is being told. Keeping this in mind our experts created Implementing Digital Transformation Digital Transformation Market Overview With Growth Diagrams PDF to reduce the time that goes into designing the presentation. This way, you can concentrate on the message while our designers take care of providing you with the right template for the situation.
Opportunity Assessment Framework For International Business Diagrams Icons PDF
This slide illustrates opportunity assessment framework for international market which entails identify internal capabilities, assess feasibility of services or products, target audience, prospect screening, market entry and deciding next approach. Presenting Opportunity Assessment Framework For International Business Diagrams Icons PDF to dispense important information. This template comprises six stages. It also presents valuable insights into the topics including Evaluation And Screening Prospects, Product For Globalization, Detection Of Target Audience. This is a completely customizable PowerPoint theme that can be put to use immediately. So, download it and address the topic impactfully.
Potential Benefits Of Digitalizing Loan Process Ppt Icon Diagrams PDF
This slide covers the benefits of digitizing the lending process of loans to make the borrowing easier for the customers. It includes streamline application procedure, use financing data for analysis, mobile lending options, etc. Presenting Potential Benefits Of Digitalizing Loan Process Ppt Icon Diagrams PDF to dispense important information. This template comprises four stages. It also presents valuable insights into the topics including Streamline Application Procedure, Digitize Lending Information, Provide Mobile. This is a completely customizable PowerPoint theme that can be put to use immediately. So, download it and address the topic impactfully.
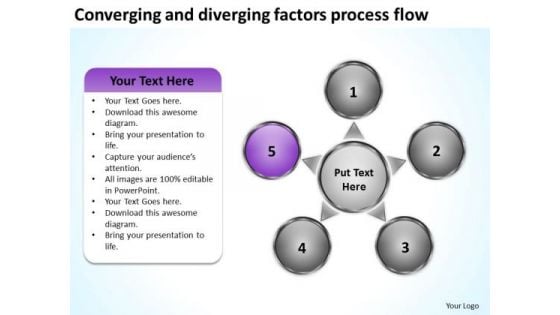
Converging And Diverging Factors Process Flow Chart Target Chart PowerPoint Templates
We present our converging and diverging factors process flow chart Target Chart PowerPoint templates.Download and present our Business PowerPoint Templates because your ideas too are pinpointedly focused on you goals. Present our Process and Flows PowerPoint Templates because our templates illustrates your ability. Download our Marketing PowerPoint Templates because customer satisfaction is a mantra of the marketplace. Building a loyal client base is an essential element of your business. Use our Circle Charts PowerPoint Templates because your brain is always churning out ideas like cogs in a wheel. Present our Flow Charts PowerPoint Templates because they are the stepping stones of our journey till date.Use these PowerPoint slides for presentations relating to Achievement, Aim, Arrow, Business, Chart, Communication, Diagram, Direction, Graphic, Growth, Guide, Increase, Marketing, Presentation, Shape, Sign, Success, Target, Team, Teamwork. The prominent colors used in the PowerPoint template are Purple, Gray, White. People tell us our converging and diverging factors process flow chart Target Chart PowerPoint templates are Attractive. Use our Diagram PowerPoint templates and PPT Slides will make the presenter look like a pro even if they are not computer savvy. Professionals tell us our converging and diverging factors process flow chart Target Chart PowerPoint templates are Zippy. Presenters tell us our Direction PowerPoint templates and PPT Slides are Charming. Professionals tell us our converging and diverging factors process flow chart Target Chart PowerPoint templates are Swanky. PowerPoint presentation experts tell us our Direction PowerPoint templates and PPT Slides are Energetic. Our Converging And Diverging Factors Process Flow Chart Target Chart PowerPoint Templates are like a fine comb. They get different strands of thought together.
Budgeting Planned Actual Comparison Ppt PowerPoint Presentation Icon Design Inspiration
This is a budgeting planned actual comparison ppt powerpoint presentation icon design inspiration. The topics discussed in this diagram are finance, marketing, management, investment, analysis. This is a completely editable PowerPoint presentation, and is available for immediate download.
Stacked Bar Finance Ppt PowerPoint Presentation Icon Deck
This is a stacked bar finance ppt powerpoint presentation icon deck. The topics discussed in this diagram are management, marketing, business, strategy, finance. This is a completely editable PowerPoint presentation, and is available for immediate download.
Stacked Area Clustered Column Ppt PowerPoint Presentation Icon Gallery
This is a stacked area clustered column ppt powerpoint presentation icon gallery. The topics discussed in this diagram are finance, marketing, management, investment, analysis. This is a completely editable PowerPoint presentation, and is available for immediate download.
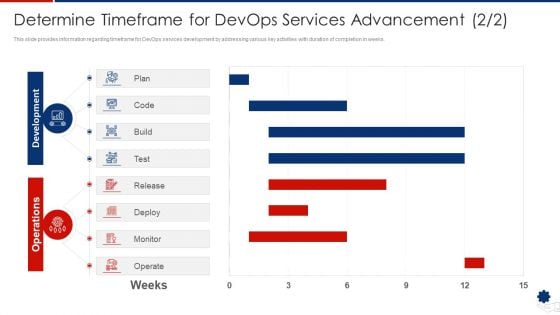
Determine Timeframe For Devops Services Advancement Plan Themes PDF
This slide provides information regarding timeframe for DevOps services development by addressing various key activities with duration of completion in weeks. Deliver and pitch your topic in the best possible manner with this This slide provides information regarding scope of service deliverables associated to in terms of DevOps maturity assessment, DevOps solution, DevOps initiation workshop. . Use them to share invaluable insights on plan, build, monitor, operate and impress your audience. This template can be altered and modified as per your expectations. So, grab it now.
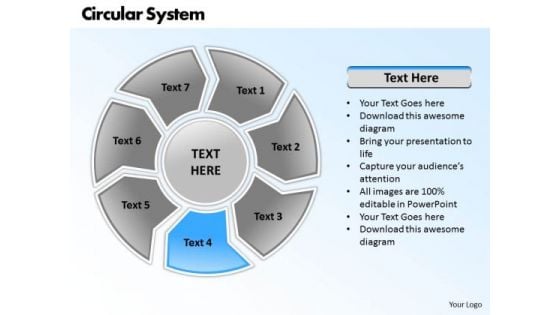
Ppt Circular PowerPoint Menu Template System 7 State Diagram Templates
PPT circular powerpoint menu template system 7 state diagram Templates- This continuous implementation diagram is a graphic representation of all the major steps of a process. This correlative seven stages diagram is a tool that can help your team work productively and successfully. -PPT circular powerpoint menu template system 7 state diagram Templates-Arrow, Art, Blue, Business, Button, Circular, Clip, Design, Diagram, Drop, Element, Glowing, Graph, Graphic, Icon, Illustration, Isolated, Process, Round, Set, Shadow, Sphere, Symbol Balance it out with our Ppt Circular PowerPoint Menu Template System 7 State Diagram Templates. Your suggestions will maintain the equilibrium.
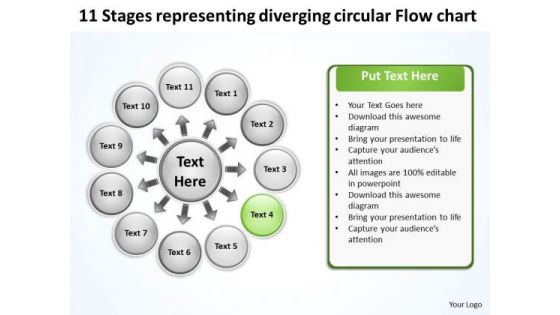
Representing Diverging Circular Flow Chart PowerPoint Templates
We present our representing diverging circular flow chart PowerPoint templates.Present our Ring charts PowerPoint Templates because this PPt slide helps you to measure key aspects of the current process and collect relevant data. Download our Circle charts PowerPoint Templates because the mind is always whirring with new ideas. Download our Process and Flows PowerPoint Templates because you have a clear vision of the cake you want. Download our Business PowerPoint Templates because you can Flutter your wings and enchant the world. Impress them with the innate attractiveness of your thoughts and words. Download our Marketing PowerPoint Templates because with the help of our Slides you can Illustrate your ideas one by one and demonstrate how each is an important cog in running the entire wheel.Use these PowerPoint slides for presentations relating to Circle, circulation, cobalt,colorful, cyan, cycle, element,emblem, grayshadow, green,icon, indicator, interface, internet, label,link, load, marker, motion, movement,navigationpanel, next, orientation, pagsite, pink, pointer, previous, process, reload, rotation, satined, sign, signpost,smooth, sticker, sticky, symbol. The prominent colors used in the PowerPoint template are Green, Black, White. Customers tell us our representing diverging circular flow chart PowerPoint templates will make the presenter successul in his career/life. We assure you our cobalt PowerPoint templates and PPT Slides are Nifty. PowerPoint presentation experts tell us our representing diverging circular flow chart PowerPoint templates are Fabulous. People tell us our grayshadow PowerPoint templates and PPT Slides will help you be quick off the draw. Just enter your specific text and see your points hit home. We assure you our representing diverging circular flow chart PowerPoint templates are Excellent. Use our cobalt PowerPoint templates and PPT Slides have awesome images to get your point across. Compile targets with our Representing Diverging Circular Flow Chart PowerPoint Templates. Download without worries with our money back guaranteee.

Key To Success Business PowerPoint Templates And PowerPoint Themes 1012
Key To Success Business PowerPoint Templates And PowerPoint Themes 1012-Create dynamic Microsoft office PPT Presentations with our professional Templates containing a graphic of a golden key written Success on it. This image has been professionally designed to emphasize the concept of achievement, accomplishment, victory, triumph, feat, realization, attainment, hit, winner, sensation, star, triumph, success story etc. This image has been conceived to enable you to emphatically communicate your ideas in your Business, Financial, Global and Social PPT presentation.-Key To Success Business PowerPoint Templates And PowerPoint Themes 1012-This PowerPoint template can be used for presentations relating to-Key To Success, Security, Success, Business, Shapes, Real Estate Acquire the endorsement of the audience. The use of our Key To Success Business PowerPoint Templates And PowerPoint Themes 1012 will go in your favour.


 Continue with Email

 Home
Home


