Phases
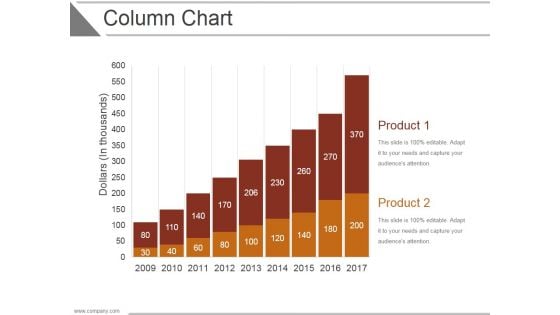
Column Chart Ppt PowerPoint Presentation Designs
This is a column chart ppt powerpoint presentation designs. This is a two stage process. The stages in this process are business, strategy, analysis, marketing, chart and graph, growth.
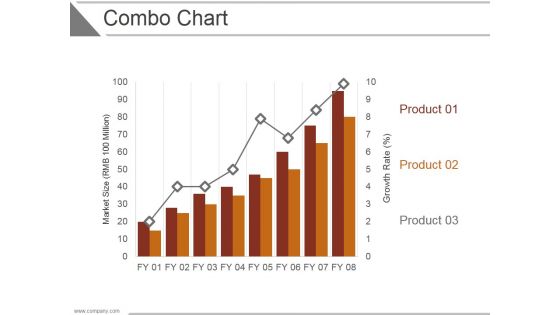
Combo Chart Ppt PowerPoint Presentation Examples
This is a combo chart ppt powerpoint presentation examples. This is a three stage process. The stages in this process are business, strategy, analysis, marketing, chart and graph, growth.
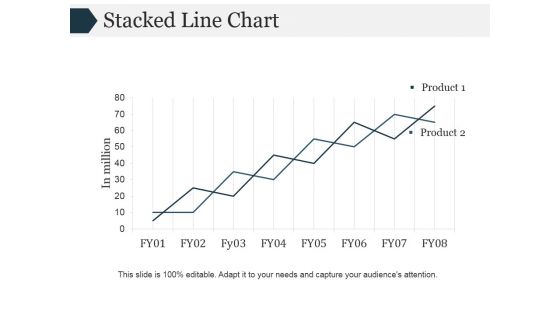
Stacked Line Chart Ppt PowerPoint Presentation Inspiration
This is a stacked line chart ppt powerpoint presentation inspiration. This is a two stage process. The stages in this process are stacked line chart, growth, analysis, management, business.
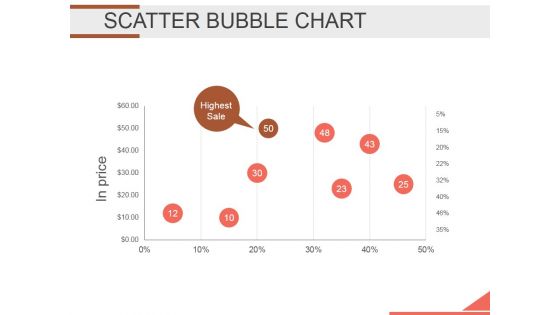
Scatter Bubble Chart Ppt PowerPoint Presentation Backgrounds
This is a scatter bubble chart ppt powerpoint presentation backgrounds. This is a one stage process. The stages in this process are bubble chart, finance, marketing, analysis, strategy, business.
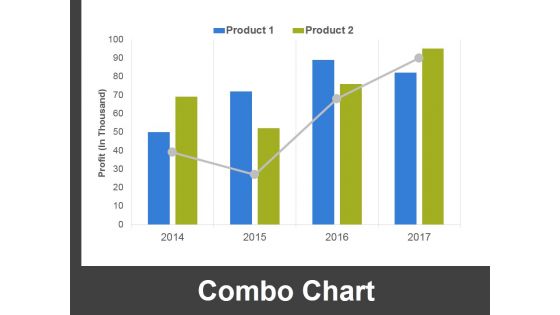
Combo Chart Ppt PowerPoint Presentation Ideas Outfit
This is a combo chart ppt powerpoint presentation ideas outfit. This is a four stage process. The stages in this process are combo chart, finance, analysis, marketing, strategy, business.
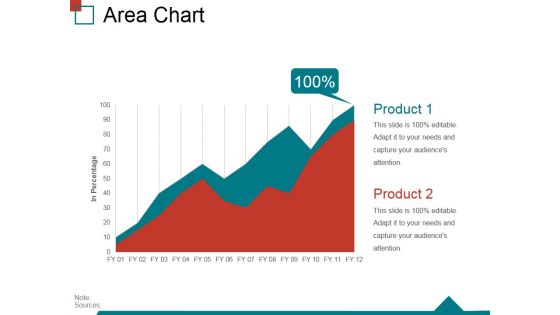
Area Chart Ppt PowerPoint Presentation Inspiration Display
This is a area chart ppt powerpoint presentation inspiration display. This is a two stage process. The stages in this process are area chart, finance, growth, success, strategy, business.
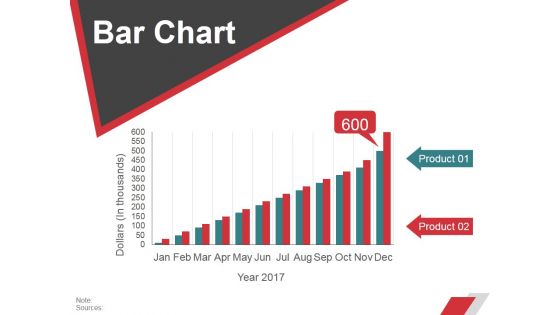
Bar Chart Ppt PowerPoint Presentation Layouts Visuals
This is a bar chart ppt powerpoint presentation layouts visuals. This is a two stage process. The stages in this process are business, strategy, marketing, planning, chart and graph.
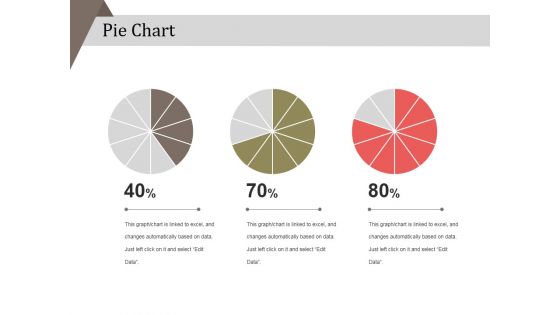
Pie Chart Ppt PowerPoint Presentation Layouts Example
This is a pie chart ppt powerpoint presentation layouts example. This is a three stage process. The stages in this process are business, strategy, analysis, pie chart, finance, marketing.
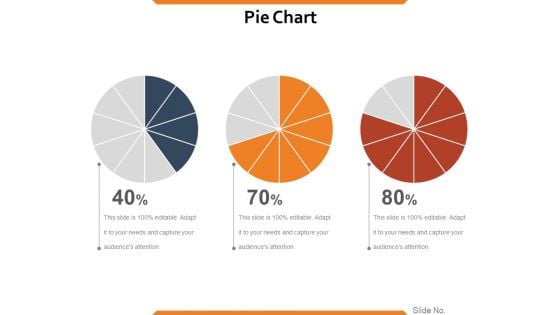
Pie Chart Ppt PowerPoint Presentation Infographics Show
This is a pie chart ppt powerpoint presentation infographics show. This is a three stage process. The stages in this process are process, percentage, business, marketing, success, pie chart.
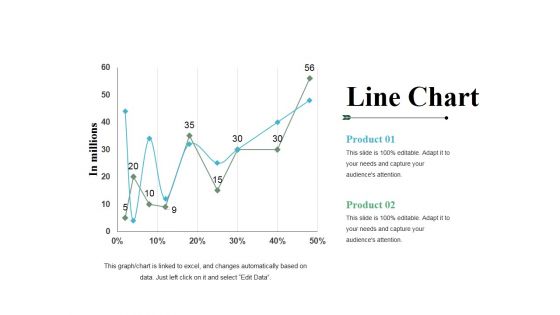
Line Chart Ppt PowerPoint Presentation File Templates
This is a line chart ppt powerpoint presentation file templates. This is a two stage process. The stages in this process are product, line chart, growth, percentage, in millions.
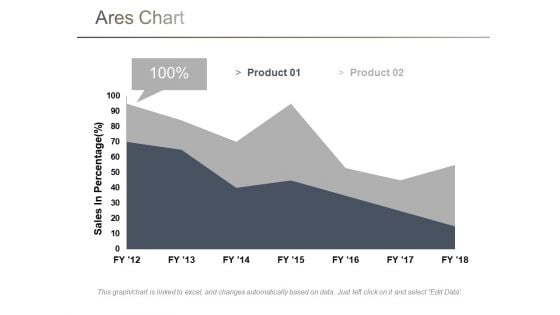
Area Chart Ppt PowerPoint Presentation Model Influencers
This is a area chart ppt powerpoint presentation model influencers. This is a two stage process. The stages in this process are sales in percentage, chart, business, marketing, finance.
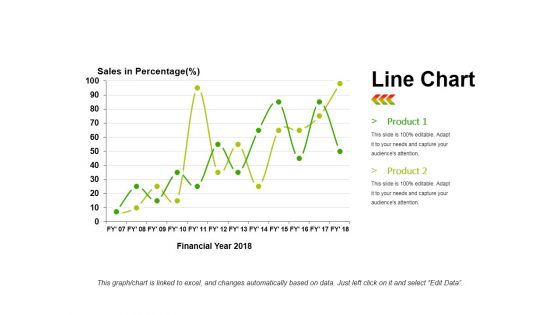
Line Chart Ppt PowerPoint Presentation Infographics Infographics
This is a line chart ppt powerpoint presentation infographics infographics. This is a two stage process. The stages in this process are product, sales in percentage, financial year, line chart, finance.

Scatter Chart Ppt PowerPoint Presentation Model Influencers
This is a scatter chart ppt powerpoint presentation model influencers. This is a one stage process. The stages in this process are scatter chart, analysis, finance, marketing, business, growth.
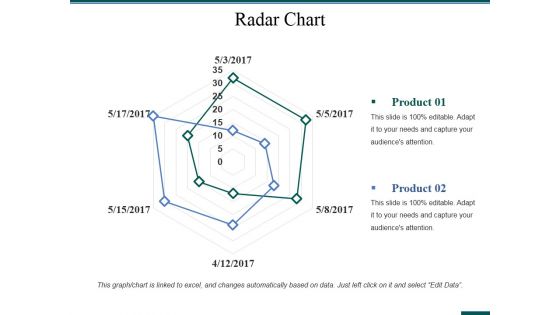
Radar Chart Ppt PowerPoint Presentation Layouts Gallery
This is a radar chart ppt powerpoint presentation layouts gallery. This is a two stage process. The stages in this process are business, analysis, strategy, marketing, radar chart, finance.
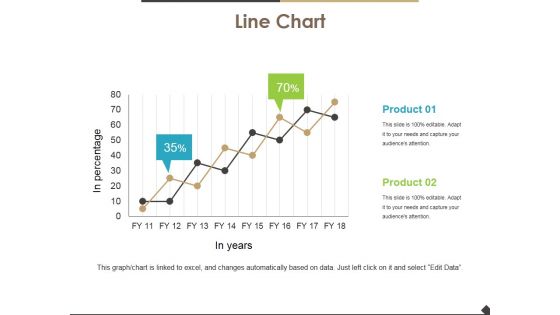
Line Chart Ppt PowerPoint Presentation Inspiration Graphics
This is a line chart ppt powerpoint presentation inspiration graphics. This is a two stage process. The stages in this process are line chart, growth, percentage, marketing, analysis, business.
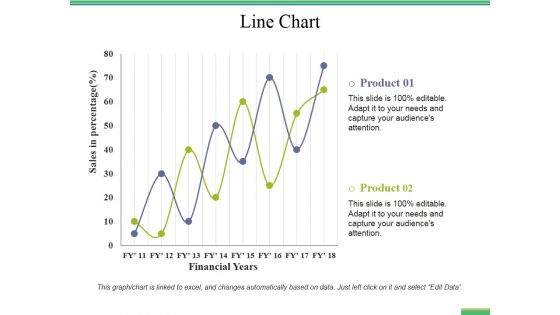
Line Chart Ppt PowerPoint Presentation Portfolio Portrait
This is a line chart ppt powerpoint presentation portfolio portrait. This is a two stage process. The stages in this process are line chart, growth, analysis, marketing, strategy, business.
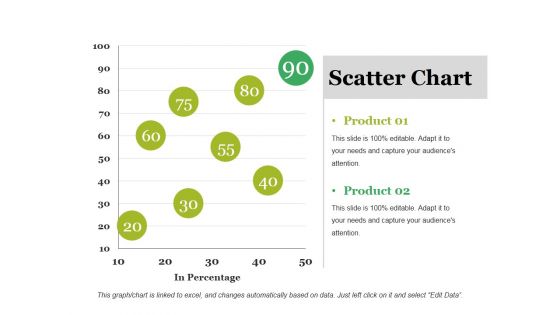
Scatter Chart Ppt PowerPoint Presentation Outline Ideas
This is a scatter chart ppt powerpoint presentation outline ideas. This is a two stage process. The stages in this process are product, scatter chart, business, in percentage, marketing.
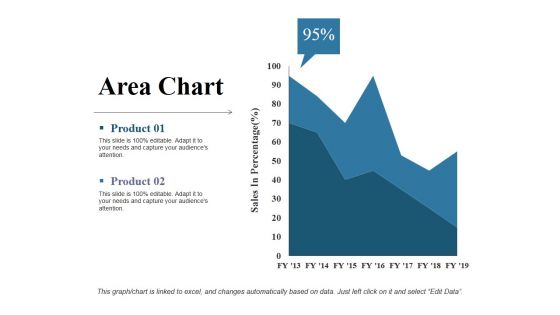
Area Chart Ppt PowerPoint Presentation Slides Example
This is a area chart ppt powerpoint presentation slides example. This is a two stage process. The stages in this process are sales in percentage, product, area chart, business, finance.
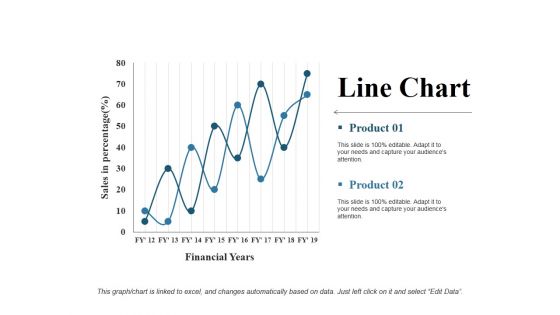
Line Chart Ppt PowerPoint Presentation Gallery Rules
This is a line chart ppt powerpoint presentation gallery rules. This is a two stage process. The stages in this process are financial years, product, sales in percentage, line chart, growth.
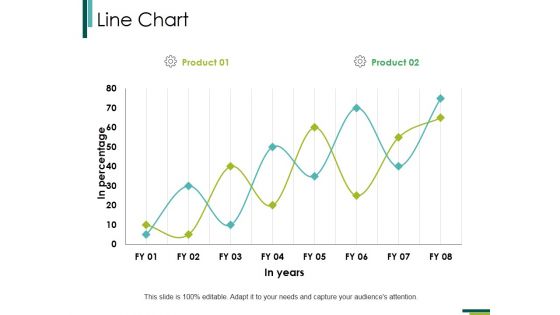
Line Chart Ppt PowerPoint Presentation Professional Examples
This is a line chart ppt powerpoint presentation professional examples. This is a two stage process. The stages in this process are line chart, analysis, growth, marketing, strategy, business.
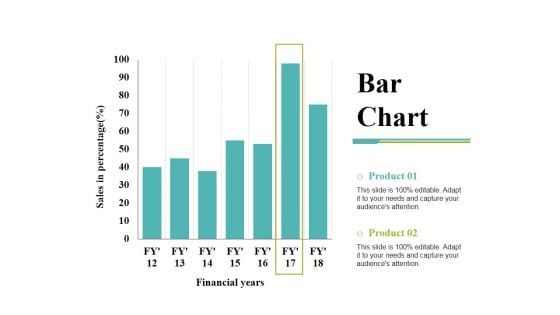
Bar Chart Ppt PowerPoint Presentation Inspiration Demonstration
This is a bar chart ppt powerpoint presentation inspiration demonstration. This is a two stage process. The stages in this process are bar chart, financial years, sales in percentage, product, finance.
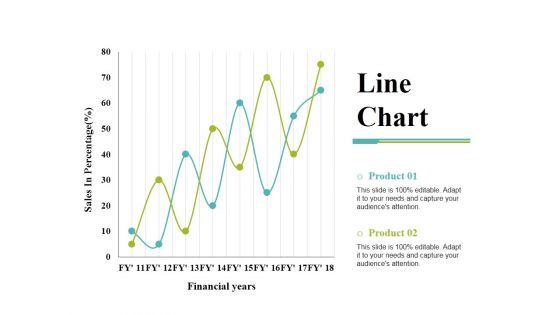
Line Chart Ppt PowerPoint Presentation Gallery Templates
This is a line chart ppt powerpoint presentation gallery templates. This is a two stage process. The stages in this process are product, financial years, sales in percentage, line chart.
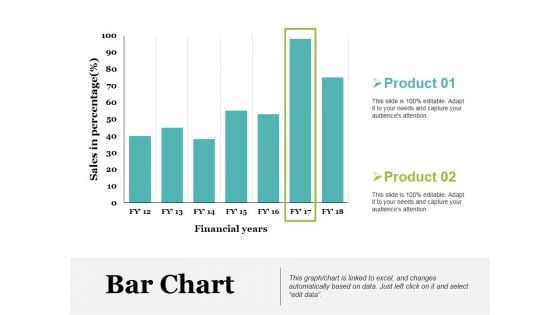
Bar Chart Ppt PowerPoint Presentation Model Picture
This is a bar chart ppt powerpoint presentation model picture. This is a two stage process. The stages in this process are product, sales in percentage, financial years, bar chart.
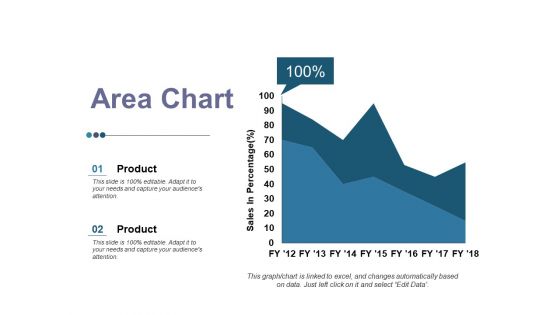
Area Chart Ppt PowerPoint Presentation Inspiration Graphics
This is a area chart ppt powerpoint presentation inspiration graphics. This is a two stage process. The stages in this process are product, area chart, business, growth, sales in percentage.
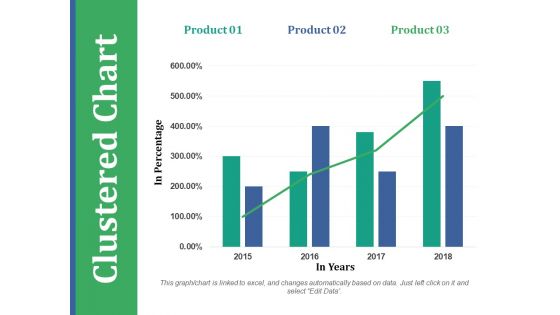
Clustered Chart Ppt PowerPoint Presentation Outline Templates
This is a clustered chart ppt powerpoint presentation outline templates. This is a three stage process. The stages in this process are product, in percentage, in years, clustered chart.
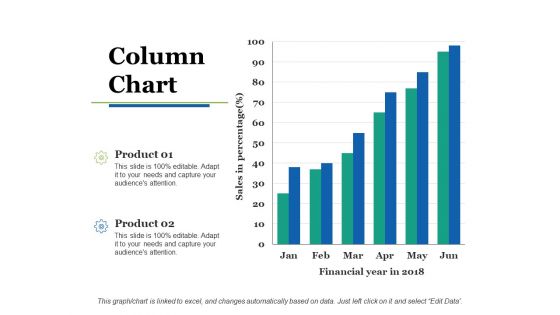
Column Chart Ppt PowerPoint Presentation Slides Show
This is a column chart ppt powerpoint presentation slides show. This is a two stage process. The stages in this process are column chart, product, sales in percentage, financial year, growth.
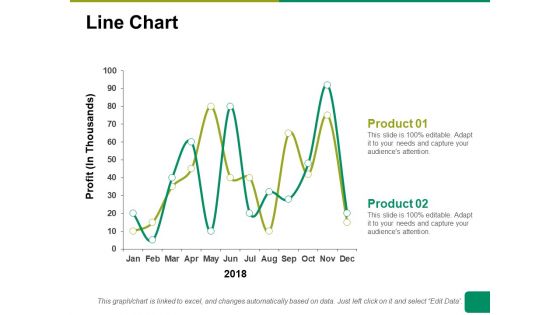
Line Chart Ppt PowerPoint Presentation Summary Ideas
This is a line chart ppt powerpoint presentation summary ideas. This is a two stage process. The stages in this process are line chart, profit, product, financial years, business.
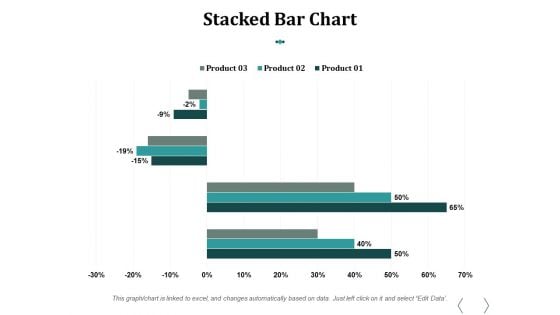
Stacked Bar Chart Ppt PowerPoint Presentation Influencers
This is a stacked bar chart ppt powerpoint presentation influencers. This is a three stage process. The stages in this process are stacked bar chart, product, percentage, finance, business.
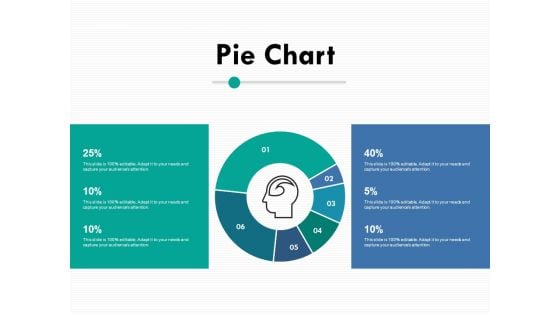
Pie Chart Ppt PowerPoint Presentation Ideas Designs
This is a pie chart ppt powerpoint presentation ideas designs. This is a six stage process. The stages in this process are pie chart, business, management, marketing, percentage, product.
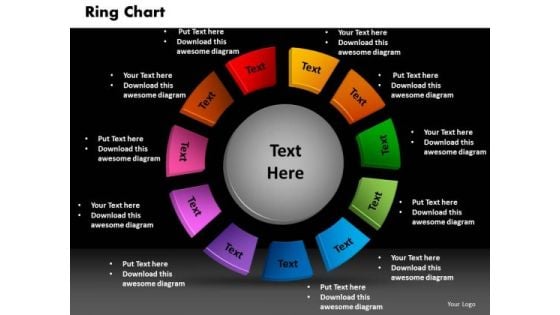
Business Cycle Process PowerPoint Templates Growth Ring Chart Ppt Slides
Business Cycle Process PowerPoint Templates Growth Ring Chart PPT Slides-This PowerPoint Template shows Growth Ring Chart.You can easily edit the size, position, text and color.-Business Cycle Process PowerPoint Templates Growth Ring Chart PPT Slides-This template can be used for presentations relating to 3d, Abstract, Advertising, Art, Branding, Business, Circles, Clipart, Company, Corporate, Design, Dimensional, Drawings, Element, Entwined, Graphics, Icon, Illustrations, Images, Internet, Marketing, Online, Pictures, Professional, Ready, Rings, Site, Team, Teamwork The audience will erupt in applause. Touch their hearts with our Business Cycle Process PowerPoint Templates Growth Ring Chart Ppt Slides.
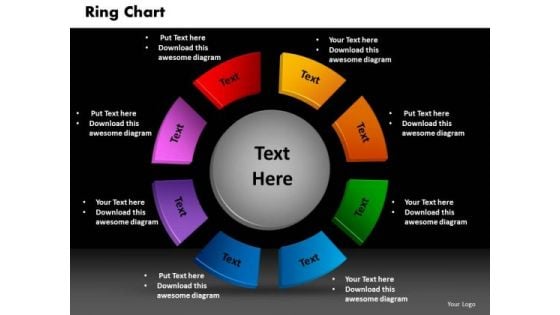
Business Cycle Process PowerPoint Templates Marketing Ring Chart Ppt Slides
Business Cycle Process PowerPoint Templates Marketing Ring Chart PPT Slides-This PowerPoint Template shows marketng Ring Chart.You can easily edit the size, position, text and color.-Business Cycle Process PowerPoint Templates Marketing Ring Chart PPT Slides-This template can be used for presentations relating to 3d, Abstract, Advertising, Art, Branding, Business, Circles, Clipart, Company, Corporate, Design, Dimensional, Drawings, Element, Entwined, Graphics, Icon, Illustrations, Images, Internet, Marketing, Online, Pictures, Professional, Ready, Rings, Site, Team, Teamwork Confident and committed define you well. Add to your dynamism with our Business Cycle Process PowerPoint Templates Marketing Ring Chart Ppt Slides.
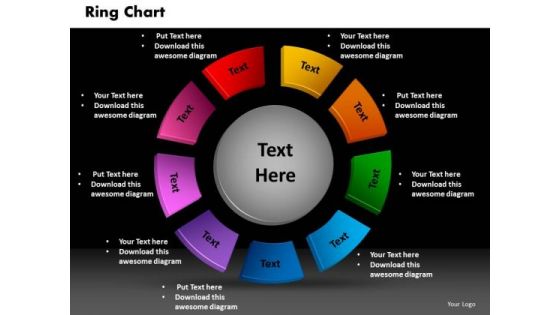
Business Cycle Process PowerPoint Templates Sales Ring Chart Ppt Slides
Business Cycle Process PowerPoint Templates Sales Ring Chart PPT Slides-This PowerPoint Template shows Sales Ring Chart.You can easily edit the size, position, text and color.-Business Cycle Process PowerPoint Templates Sales Ring Chart PPT Slides-This template can be used for presentations relating to 3d, Abstract, Advertising, Art, Branding, Business, Circles, Clipart, Company, Corporate, Design, Dimensional, Drawings, Element, Entwined, Graphics, Icon, Illustrations, Images, Internet, Marketing, Online, Pictures, Professional, Ready, Rings, Site, Team, Teamwork Our Business Cycle Process PowerPoint Templates Sales Ring Chart Ppt Slides are fairly far sighted. They help you see clearly into the distance.
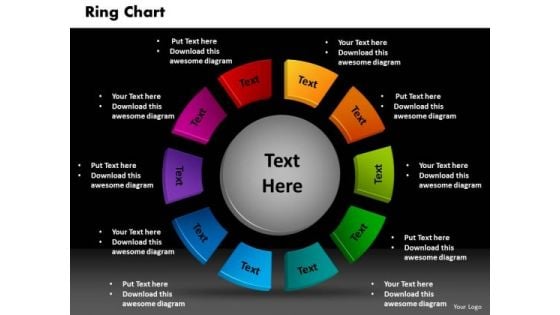
Business Cycle Process PowerPoint Templates Success Ring Chart Ppt Slides
Business Cycle Process PowerPoint Templates Success Ring Chart PPT Slides-This PowerPoint Template shows Success Ring Chart.You can easily edit the size, position, text and color.-Business Cycle Process PowerPoint Templates Success Ring Chart PPT Slides-This template can be used for presentations relating to 3d, Abstract, Advertising, Art, Branding, Business, Circles, Clipart, Company, Corporate, Design, Dimensional, Drawings, Element, Entwined, Graphics, Icon, Illustrations, Images, Internet, Marketing, Online, Pictures, Professional, Ready, Rings, Site, Team, Teamwork Advise teams with our Business Cycle Process PowerPoint Templates Success Ring Chart Ppt Slides. Download without worries with our money back guaranteee.
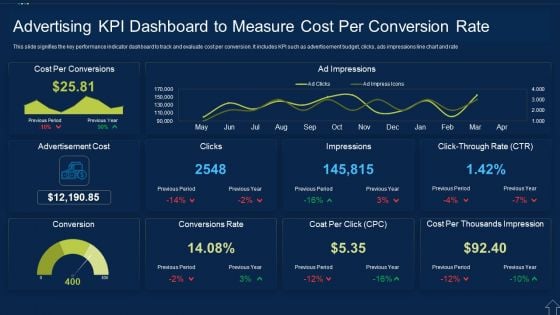
Advertising KPI Dashboard To Measure Cost Per Conversion Rate Themes PDF
This slide signifies the key performance indicator dashboard to track and evaluate cost per conversion. It includes KPI such as advertisement budget, clicks, ads impressions line chart and rate Showcasing this set of slides titled Advertising KPI Dashboard To Measure Cost Per Conversion Rate Themes PDF The topics addressed in these templates are Advertising Kpi Dashboard To Measure Cost Per Conversion Rate All the content presented in this PPT design is completely editable. Download it and make adjustments in color, background, font etc. as per your unique business setting.
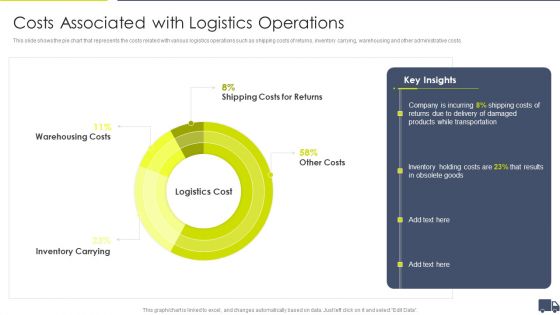
Enhancing Logistics Customer Service Costs Associated With Logistics Operations Themes PDF
This slide shows the pie chart that represents the costs related with various logistics operations such as shipping costs of returns, inventory carrying, warehousing and other administrative costs. Deliver and pitch your topic in the best possible manner with this Enhancing Logistics Customer Service Costs Associated With Logistics Operations Themes PDF. Use them to share invaluable insights on Warehousing Costs Shipping, Costs For Returns, Other Costs Logistics, Cost Inventory Carrying and impress your audience. This template can be altered and modified as per your expectations. So, grab it now.
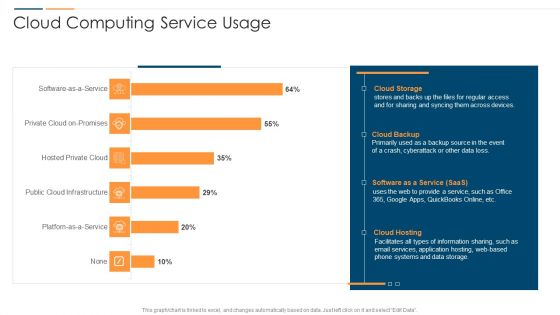
Revolution In Online Business Cloud Computing Service Usage Ppt PowerPoint Presentation File Themes PDF
This graph or chart is linked to excel, and changes automatically based on data. Just left click on it and select Edit Data. Deliver and pitch your topic in the best possible manner with this Revolution In Online Business Cloud Computing Service Usage Ppt PowerPoint Presentation File Themes PDF. Use them to share invaluable insights on Cloud Storage System, Cloud Backup Saas, Cloud Hosting Storage and impress your audience. This template can be altered and modified as per your expectations. So, grab it now.
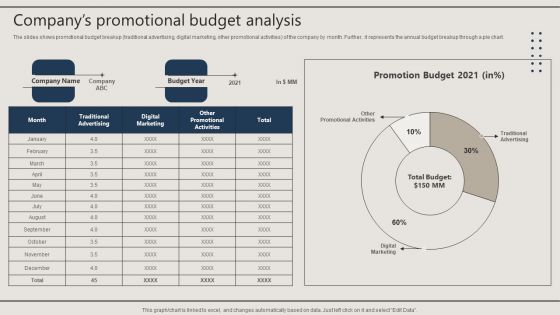
Promotion Techniques Used By B2B Firms Companys Promotional Budget Analysis Themes PDF
The slides shows promotional budget breakup traditional advertising, digital marketing, other promotional activities of the company by month. Further, it represents the annual budget breakup through a pie chart. Take your projects to the next level with our ultimate collection of Promotion Techniques Used By B2B Firms Companys Promotional Budget Analysis Themes PDF. Slidegeeks has designed a range of layouts that are perfect for representing task or activity duration, keeping track of all your deadlines at a glance. Tailor these designs to your exact needs and give them a truly corporate look with your own brand colors they will make your projects stand out from the rest.
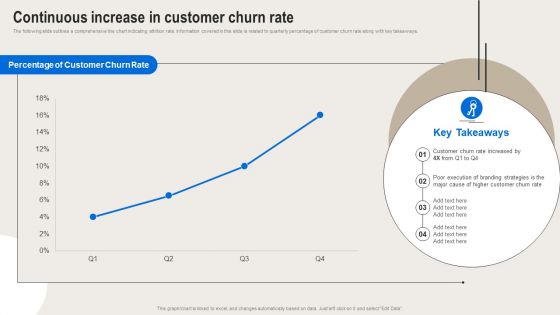
Formulating Branding Strategy To Enhance Revenue And Sales Continuous Increase In Customer Churn Rate Themes PDF
The following slide outlines a comprehensive line chart indicating attrition rate. Information covered in this slide is related to quarterly percentage of customer churn rate along with key takeaways. Boost your pitch with our creative Formulating Branding Strategy To Enhance Revenue And Sales Continuous Increase In Customer Churn Rate Themes PDF. Deliver an awe-inspiring pitch that will mesmerize everyone. Using these presentation templates you will surely catch everyones attention. You can browse the ppts collection on our website. We have researchers who are experts at creating the right content for the templates. So you do not have to invest time in any additional work. Just grab the template now and use them.
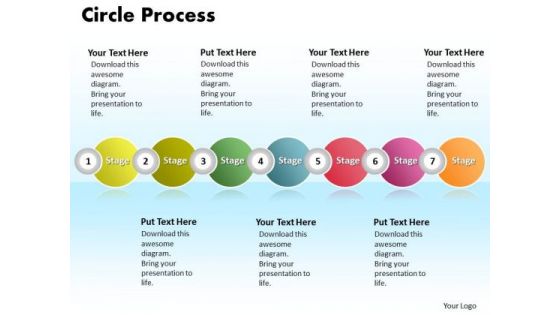
Ppt Half Circle PowerPoint 2010 Process 7 State Diagram Templates
PPT half circle powerpoint 2010 process 7 state diagram Templates-This continual illustration of procedure graphic is a visual representation of your information and ideas-PPT half circle powerpoint 2010 process 7 state diagram Templates-Abstract, Business, Chart, Circle, Company, Corporate, Design, Diagram, Different, Graph, Illustration, Information, Item, Junction, Management, Marketing, Menu, Modern, Network, Options, Parts, Pie, Plan, Presentation, Process, Report, Representational, Segments, Sphere, Statistics, Strategy, Structure, Wheel Our Ppt Half Circle PowerPoint 2010 Process 7 State Diagram Templates are exceptionally adaptive. They will blend in with any scenario.
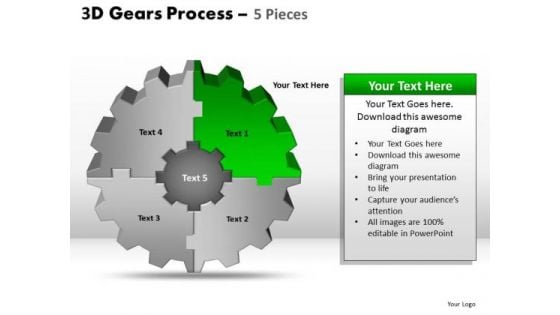
PowerPoint Slide Chart Gear Process Ppt Slide
Supply great ideas with our PowerPoint Slide Chart Gear Process Ppt Slide. Download without worries with our money back guaranteee.
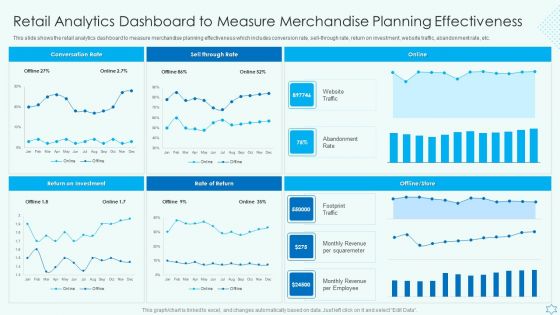
Retail Analytics Dashboard To Measure Merchandise Planning Effectiveness Diagrams PDF
This slide shows the retail analytics dashboard to measure merchandise planning effectiveness which includes conversion rate, sell through rate, return on investment, website traffic, abandonment rate, etc. Are you searching for a Retail Analytics Dashboard To Measure Merchandise Planning Effectiveness Diagrams PDF that is uncluttered, straightforward, and original Its easy to edit, and you can change the colors to suit your personal or business branding. For a presentation that expresses how much effort you have put in, this template is ideal With all of its features, including tables, diagrams, statistics, and lists, its perfect for a business plan presentation. Make your ideas more appealing with these professional slides. Download Retail Analytics Dashboard To Measure Merchandise Planning Effectiveness Diagrams PDF from Slidegeeks today.
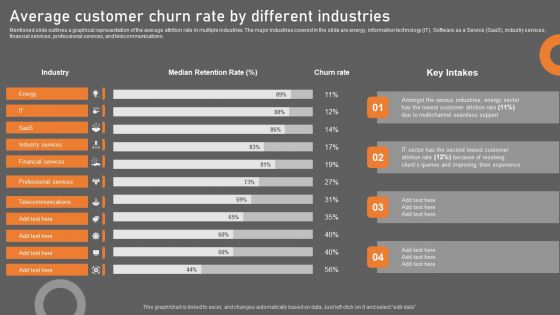
Average Customer Churn Rate By Different Industries Diagrams PDF
Mentioned slide outlines a graphical representation of the average attrition rate in multiple industries. The major industries covered in the slide are energy, information technology IT, Software as a Service SaaS, industry services, financial services, professional services, and telecommunications. Presenting this PowerPoint presentation, titled Average Customer Churn Rate By Different Industries Diagrams PDF, with topics curated by our researchers after extensive research. This editable presentation is available for immediate download and provides attractive features when used. Download now and captivate your audience. Presenting this Average Customer Churn Rate By Different Industries Diagrams PDF. Our researchers have carefully researched and created these slides with all aspects taken into consideration. This is a completely customizable Average Customer Churn Rate By Different Industries Diagrams PDF that is available for immediate downloading. Download now and make an impact on your audience. Highlight the attractive features available with our PPTs.
PowerPoint Process Chart Uniform Business Ppt Slide
PowerPoint Process Chart Uniform Business PPT Slide-PowerPoint Slide Graphic Uniform Business PPT Designs-These high quality powerpoint pre-designed slides and powerpoint templates have been carefully created by our professional team to help you impress your audience.-PowerPoint Process Chart Uniform Business PPT Slide Inspire team with our PowerPoint Process Chart Uniform Business Ppt Slide. Download without worries with our money back guaranteee.
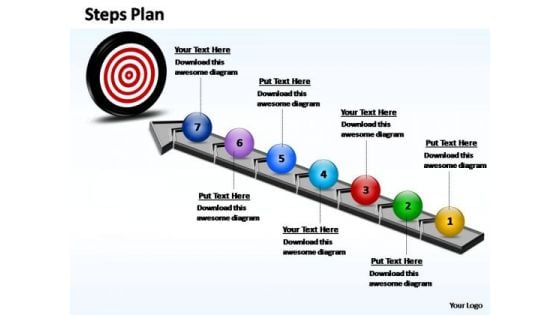
PowerPoint Designs Chart Steps Plan Ppt Process
PowerPoint Designs Chart Steps Plan PPT Process-This PowerPoint template shows Step Plan which consists of 3 Stages. It can be used to to show grouped or related information.-PowerPoint Designs Chart Steps Plan PPT Process Give good counsel with our PowerPoint Designs Chart Steps Plan Ppt Process. Your thoughts will show your compassion.
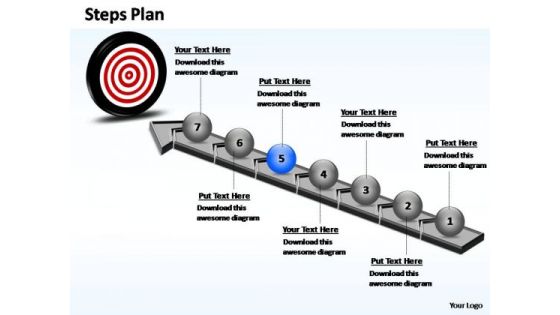
PowerPoint Template Chart Steps Plan Ppt Slides
PowerPoint Template Chart Steps Plan PPT Slides-This PowerPoint template shows Step Plan which consists of 4 Stages. It can be used to to show grouped or related information.-PowerPoint Template Chart Steps Plan PPT Slides Fetch up with our PowerPoint Template Chart Steps Plan Ppt Slides. You will be applauded wherever you go.
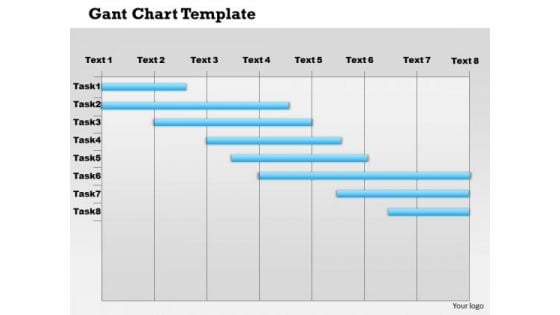
Business Framework Gantt Chart PowerPoint Presentation
A Gantt chart is a type of bar chart, that illustrates a project schedule. Gantt charts illustrate the start and finish dates of the terminal elements and summary elements of a project. Terminal elements and summary elements comprise the work breakdown structure of the project. Use this image slide to depict project management in your presentations.

Business Diagram 3d World Globe With Network Presentation Template
This diagram contains 3d world globe with network. This slide displays a network connecting on world globe. This template is excellent for making technology and business related presentations.
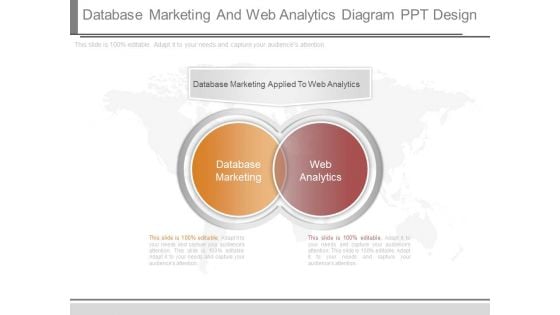
Database Marketing And Web Analytics Diagram Ppt Design
This is a database marketing and web analytics diagram ppt design. This is a two stage process. The stages in this process are database marketing, web analytics.
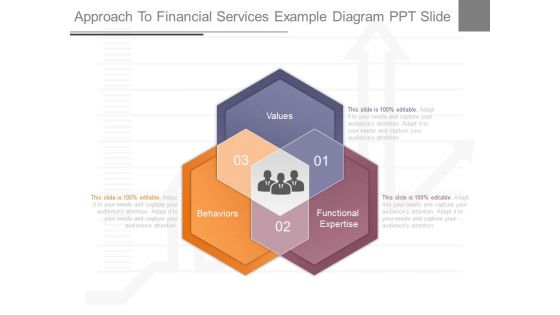
Approach To Financial Services Example Diagram Ppt Slide
This is a approach to financial services example diagram ppt slide. This is a three stage process. The stages in this process are values, functional expertise, behaviors.
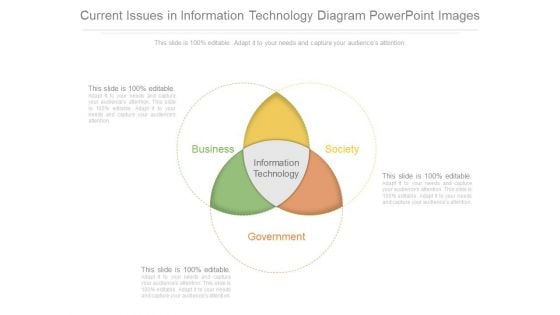
Current Issues In Information Technology Diagram Powerpoint Images
This is a current issues in information technology diagram powerpoint images. This is a three stage process. The stages in this process are information technology, business, government, society.
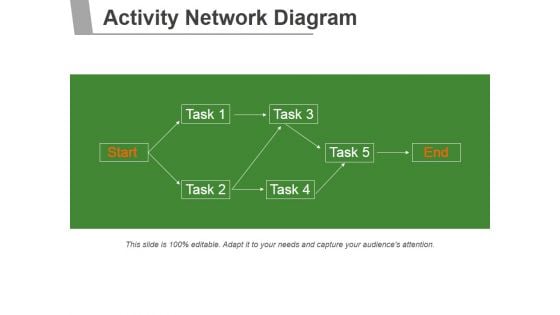
Activity Network Diagram Ppt PowerPoint Presentation Visual Aids
This is a activity network diagram ppt powerpoint presentation visual aids. This is a five stage process. The stages in this process are business, marketing, management, network, planning.
Venn Sales Marketing Ppt Powerpoint Presentation Model Diagrams
This is a venn sales marketing ppt powerpoint presentation model diagrams. This is a four stage process. The stages in this process are venn, sales, marketing, business, management.
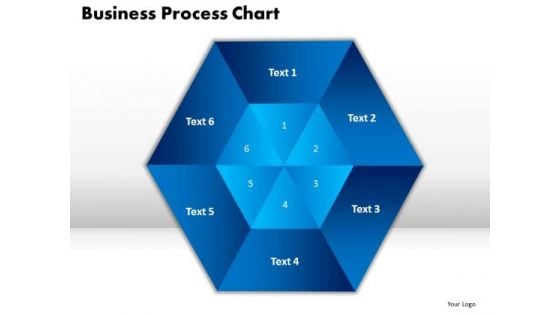
PowerPoint Slide Business Process Chart Marketing Ppt Slides
PowerPoint Slide Business Process Chart Marketing PPT Slides-This Hexagonal PowerPoint Diagram provides you the different way for explaining six approaches. This Business Process Chart will make your Presentation more Effective and interesting. -PowerPoint Slide Business Process Chart Marketing PPT Slides Excellence is an article of faith with our PowerPoint Slide Business Process Chart Marketing Ppt Slides team. They give their all and more to achieve it.
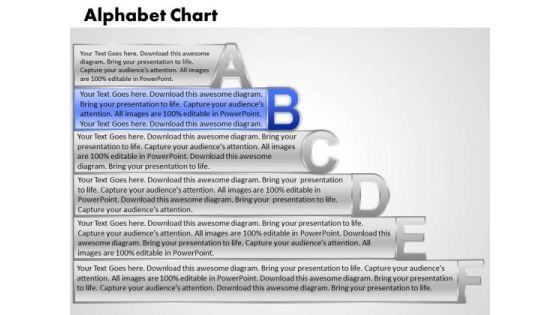
Ppt Alphabet Chart With Textboxes Project Management PowerPoint Business Templates
PPT alpahabet chart with textboxes project management powerpoint Business Templates-Use this Amazing PowerPoint Diagram which shows the different way to represent your text and make your Presentation more interesting and impressive to watch for Audiences.-PPT alpahabet chart with textboxes project management powerpoint Business Templates Make everyday special with our Ppt Alphabet Chart With Textboxes Project Management PowerPoint Business Templates. Ring in the changes with our Ppt Alphabet Chart With Textboxes Project Management PowerPoint Business Templates.
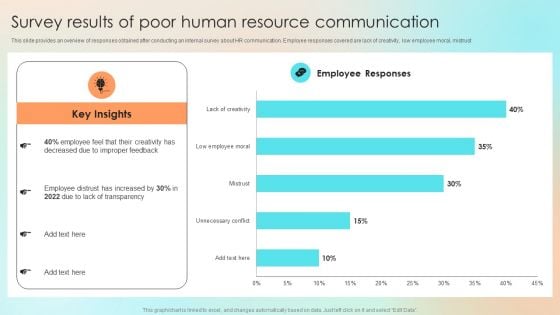
Survey Results Of Poor Human Resource Communication Diagrams PDF
This slide provides an overview of responses obtained after conducting an internal survey about HR communication. Employee responses covered are lack of creativity, low employee moral, mistrust. Get a simple yet stunning designed Survey Results Of Poor Human Resource Communication Diagrams PDF. It is the best one to establish the tone in your meetings. It is an excellent way to make your presentations highly effective. So, download this PPT today from Slidegeeks and see the positive impacts. Our easy to edit Survey Results Of Poor Human Resource Communication Diagrams PDF can be your go to option for all upcoming conferences and meetings. So, what are you waiting for Grab this template today.
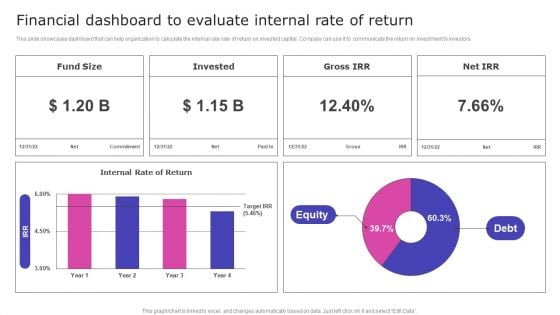
Financial Dashboard To Evaluate Internal Rate Of Return Diagrams PDF
This slide showcases dashboard that can help organization to calculate the internal rate rate of return on invested capital. Company can use it to communicate the return on investment to investors. Create an editable Financial Dashboard To Evaluate Internal Rate Of Return Diagrams PDF that communicates your idea and engages your audience. Whether youre presenting a business or an educational presentation, pre designed presentation templates help save time. Financial Dashboard To Evaluate Internal Rate Of Return Diagrams PDF is highly customizable and very easy to edit, covering many different styles from creative to business presentations. Slidegeeks has creative team members who have crafted amazing templates. So, go and get them without any delay.
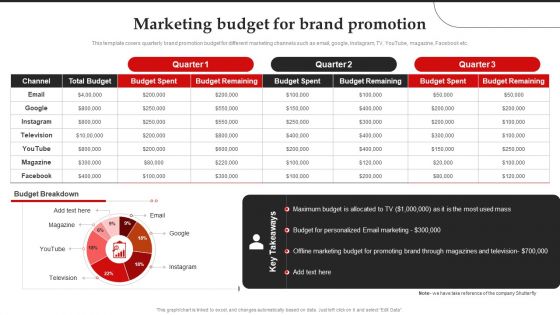
Marketing Budget For Brand Promotion Brand Introduction Plan Diagrams PDF
This template covers quarterly brand promotion budget for different marketing channels such as email, google, Instagram, TV, YouTube, magazine, Facebook etc. Create an editable Marketing Budget For Brand Promotion Brand Introduction Plan Diagrams PDF that communicates your idea and engages your audience. Whether you are presenting a business or an educational presentation, pre-designed presentation templates help save time. Marketing Budget For Brand Promotion Brand Introduction Plan Diagrams PDF is highly customizable and very easy to edit, covering many different styles from creative to business presentations. Slidegeeks has creative team members who have crafted amazing templates. So, go and get them without any delay.
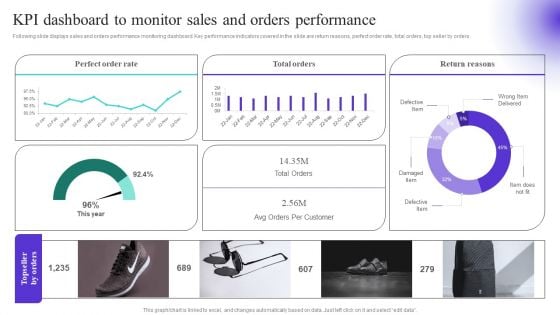
KPI Dashboard To Monitor Sales And Orders Performance Diagrams PDF
Following slide displays sales and orders performance monitoring dashboard. Key performance indicators covered in the slide are return reasons, perfect order rate, total orders, top seller by orders. Create an editable KPI Dashboard To Monitor Sales And Orders Performance Diagrams PDF that communicates your idea and engages your audience. Whether you are presenting a business or an educational presentation, pre designed presentation templates help save time. KPI Dashboard To Monitor Sales And Orders Performance Diagrams PDF is highly customizable and very easy to edit, covering many different styles from creative to business presentations. Slidegeeks has creative team members who have crafted amazing templates. So, go and get them without any delay.
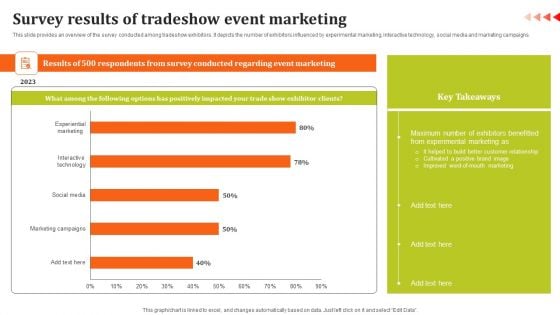
Survey Results Of Tradeshow Event Marketing Diagrams PDF
This slide provides an overview of the survey conducted among tradeshow exhibitors. It depicts the number of exhibitors influenced by experimental marketing, interactive technology, social media and marketing campaigns. Get a simple yet stunning designed Survey Results Of Tradeshow Event Marketing Diagrams PDF. It is the best one to establish the tone in your meetings. It is an excellent way to make your presentations highly effective. So, download this PPT today from Slidegeeks and see the positive impacts. Our easy to edit Survey Results Of Tradeshow Event Marketing Diagrams PDF can be your go to option for all upcoming conferences and meetings. So, what are you waiting for Grab this template today.
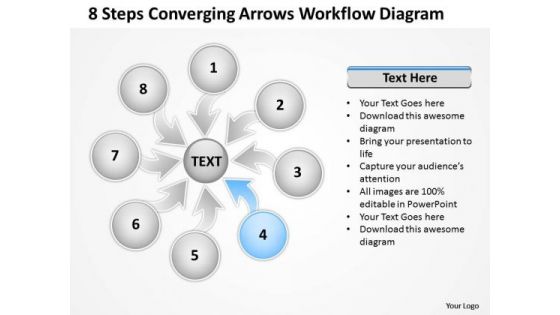
8 Steps Converging Arrows Workflow Diagram Process Software PowerPoint Slides
We present our 8 steps converging arrows workflow diagram Process Software PowerPoint Slides.Download our Circle Charts PowerPoint Templates because You can Connect the dots. Fan expectations as the whole picture emerges. Download our Arrows PowerPoint Templates because They will Put the wind in your sails. Skim smoothly over the choppy waters of the market. Download our Circle Charts PowerPoint Templates because they are the tools that helped most of us evolve. Download our Shapes PowerPoint Templates because Our On the face of it our 8 Steps Converging Arrows Workflow Diagram Process Software PowerPoint Slides may appear quite simple. It takes a lot of effort to keep it that way.


 Continue with Email

 Home
Home


