Problem Solving Approach
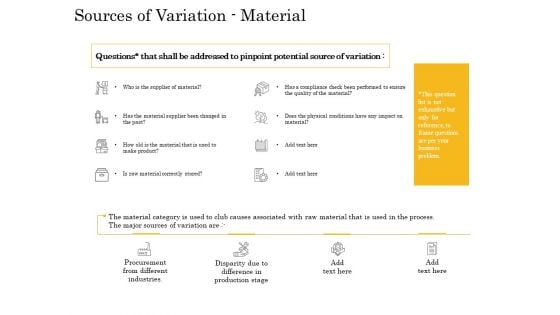
The Fishbone Analysis Tool Sources Of Variation Material Sample PDF
Deliver an awe-inspiring pitch with this creative the fishbone analysis tool sources of variation material sample pdf bundle. Topics like material supplier, procurement different industries, disparity difference production stage, material product, material correctly stored can be discussed with this completely editable template. It is available for immediate download depending on the needs and requirements of the user.
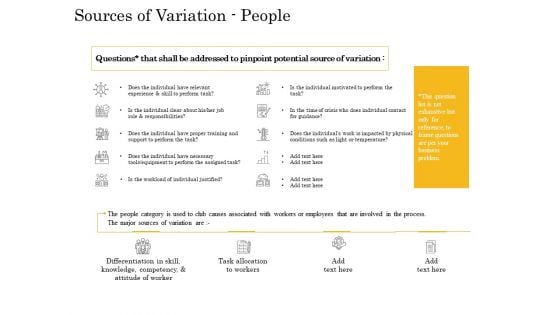
The Fishbone Analysis Tool Sources Of Variation People Pictures PDF
Deliver an awe-inspiring pitch with this creative the fishbone analysis tool sources of variation people pictures pdf bundle. Topics like differentiation skill knowledge competency, task allocation to workers, relevant experience skill to perform, training support, individual have necessary, perform assigned task can be discussed with this completely editable template. It is available for immediate download depending on the needs and requirements of the user.
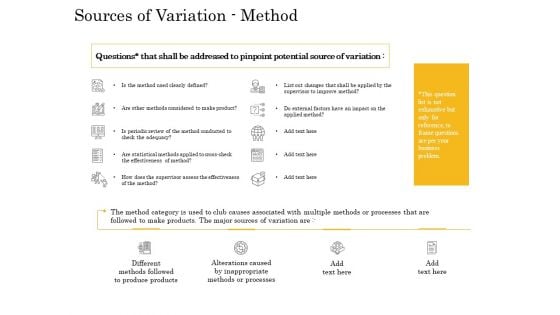
The Fishbone Analysis Tool Sources Of Variation Method Rules PDF
Deliver and pitch your topic in the best possible manner with this the fishbone analysis tool sources of variation method rules pdf. Use them to share invaluable insights on inappropriate methods processes, different methods followed to produce products, statistical methods applied, effectiveness method, external factors, conducted adequacy and impress your audience. This template can be altered and modified as per your expectations. So, grab it now.
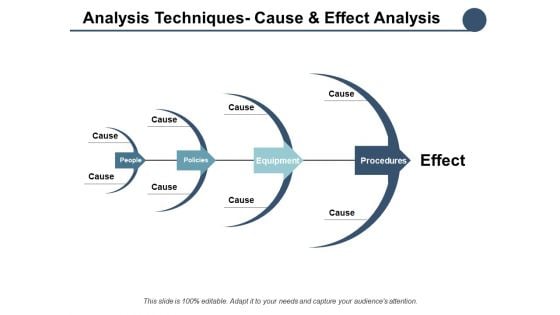
Analysis Techniques Cause And Effect Analysis Ppt PowerPoint Presentation Layouts Diagrams
This is a analysis techniques cause and effect analysis ppt powerpoint presentation layouts diagrams. This is a four stage process. The stages in this process are business, management, planning, strategy, marketing.

Cause And Effect Diagram Software For Quality Administration Summary PDF
Showcasing this set of slides titled cause and effect diagram software for quality administration summary pdf. The topics addressed in these templates are equipment, quality, equipment. All the content presented in this PPT design is completely editable. Download it and make adjustments in color, background, font etc. as per your unique business setting.
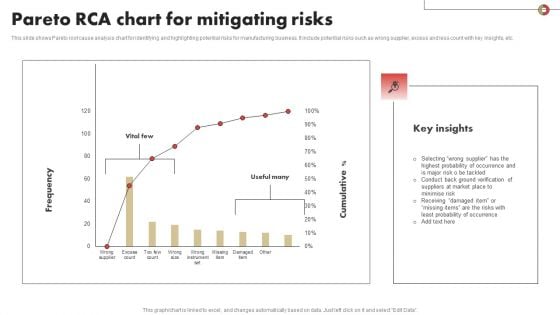
Pareto RCA Chart For Mitigating Risks Slides PDF
This slide shows Pareto root cause analysis chart for identifying and highlighting potential risks for manufacturing business. It include potential risks such as wrong supplier, excess and less count with key insights, etc. Pitch your topic with ease and precision using this Pareto RCA Chart For Mitigating Risks Slides PDF Download. This layout presents information on Mitigating, Pareto, Probability. It is also available for immediate download and adjustment. So, changes can be made in the color, design, graphics or any other component to create a unique layout.
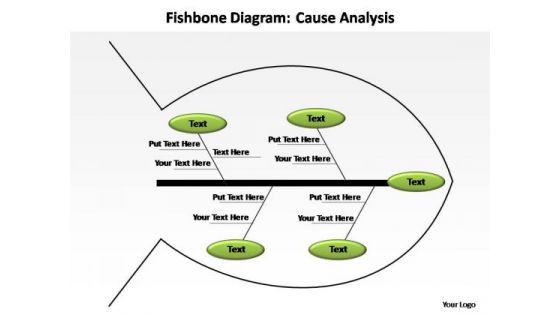
PowerPoint Slide Designs Image Cause Analysis Ppt Backgrounds
PowerPoint Slide Designs Image Cause Analysis PPT Backgrounds--These amazing PowerPoint pre-deSignsed slides and PowerPoint templates have been carefully created by our team of experts to help you impress your audience. Our stunning collection of Powerpoint slides are 100% editable and can easily fit in any PowerPoint presentations. By using these animations and graphics in PowerPoint and you can easily make professional presentations. Any text can be entered at any point in the PowerPoint template or slide. Just DOWNLOAD our awesome PowerPoint templates and you are ready to go. Exercise options with our PowerPoint Slide Designs Image Cause Analysis Ppt Backgrounds. Find answers to multiple challenges.
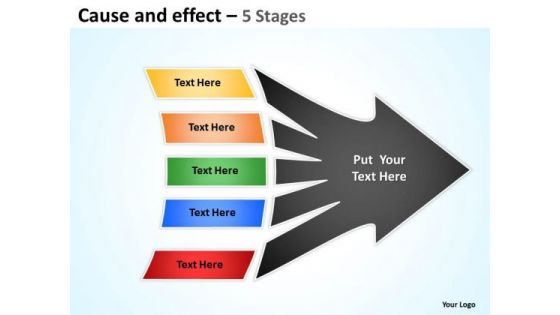
Business Framework Model Cause And Effect Step 5 Strategy Diagram
Our Business Framework Model Cause And Effect Step 5 Strategy Diagram Powerpoint Templates Team Are A Dogged Lot. They Keep At It Till They Get It Right.
The Fishbone Analysis Tool Comparison Ppt Icon Template PDF
This is a the fishbone analysis tool comparison ppt icon template pdf template with various stages. Focus and dispense information on two stages using this creative set, that comes with editable features. It contains large content boxes to add your information on topics like comparison. You can also showcase facts, figures, and other relevant content using this PPT layout. Grab it now.
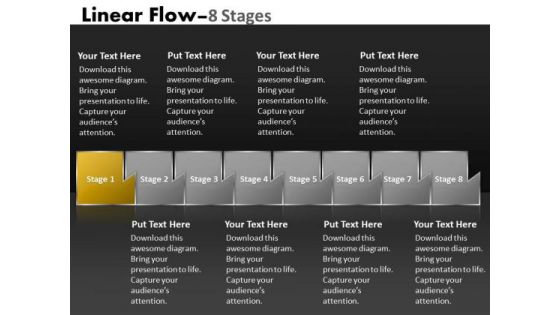
PowerPoint Template Multicolored Sequential Flow Ishikawa Diagram Design
We present our PowerPoint template multicolored sequential flow ishikawa diagram design. Use our Business PowerPoint Templates because, Marketing Strategy Business Template: - Maximizing sales of your product is the intended destination. Use our Shapes PowerPoint Templates because, You have some exciting plans to spread goodwill among the underprivileged, Expound on your ideas and show to your colleagues how they can help others and in the process increase your Brand value. Use our Design PowerPoint Templates because, Illuminate the spiritual brilliance of Jesus and shower the love for mankind he showed even while being crucified. Use our Signs PowerPoint Templates because, Puzzles or Jigsaw Template: - It is all there in bits and pieces. Use our Process and Flows PowerPoint Templates because, you have churned your mind and come up with effective ways and means to further refine it. Use these PowerPoint slides for presentations relating to Abstract, Algorithm, Arrow, Business, Chart, Connection, Design, Development, Diagram, Direction, Element, Flow, Graph, Linear, Linear Diagram, Management, Organization, Plan, Process, Section, Segment, Set, Sign, Solution, Strategy, Symbol, Vector. The prominent colors used in the PowerPoint template are Yellow, Gray, and Black Be an outperforming global competititor with our PowerPoint Template Multicolored Sequential Flow Ishikawa Diagram Design. They will make you look good.
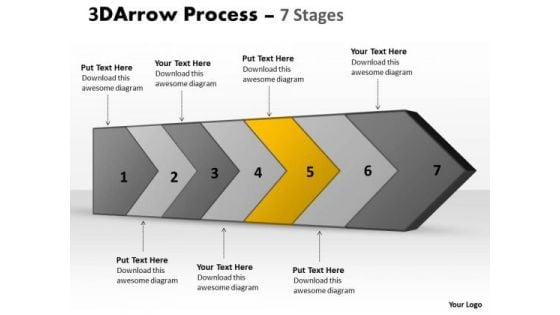
PowerPoint Template 3d Continuous Arrow Steps Ishikawa Diagram Business Image
We present our PowerPoint template 3d continuous arrow steps ishikawa diagram business Image. Use our Marketing PowerPoint Templates because; Break it all down to Key Result Areas. Use our Finance PowerPoint Templates because, The Venn graphic comprising interlinking circles geometrically demonstrate how various functions operating independently, to a large extent, are essentially interdependent. Use our Business PowerPoint Templates because, Marketing Strategy Business Template:- Maximizing sales of your product is the intended destination. Use our Arrows PowerPoint Templates because, determine your targets and sequence them as per your priorities. Use our Process and flows PowerPoint Templates because, you have some exciting plans to spread goodwill among the underprivileged, Expound on your ideas and show to your colleagues how they can help others and in the process increase your Brand value. Use these PowerPoint slides for presentations relating to 3d, arrow, background, bullet, business, chart, checkmark, chevron, diagram, drop, eps10, financial, five, glass, graphic, icon, illustration, isometric, management, perspective, placeholder, point, process, project, reflection, set, shadow, silver, stage, text, transparency, vector. The prominent colors used in the PowerPoint template are Yellow, Black, and Gray Establish your command over the subject. Display your awareness with our PowerPoint Template 3d Continuous Arrow Steps Ishikawa Diagram Business Image.

PowerPoint Template Multicolored Sequential Flow Ishikawa Diagram Business Design
We present our PowerPoint template multicolored sequential flow ishikawa diagram business design. Use our Business PowerPoint Templates because; enlighten others on your team with your views. Use our Shapes PowerPoint Templates because; Help them develop their thoughts along the way. Use our Design PowerPoint Templates because, illustrate your ideas and imprint them in the minds of your team with this template. Use our Signs PowerPoint Templates because, creating a winner is your passion and dream. Use our Process and Flows PowerPoint Templates because, you understand how each drives the next to motor the entire sequence. Use these PowerPoint slides for presentations relating to Abstract, Algorithm, Arrow, Business, Chart, Connection, Design, Development, Diagram, Direction, Element, Flow, Graph, Linear, Linear Diagram, Management, Organization, Plan, Process, Section, Segment, Set, Sign, Solution, Strategy, Symbol, Vector. The prominent colors used in the PowerPoint template are Brown, Gray, and Black With our PowerPoint Template Multicolored Sequential Flow Ishikawa Diagram Business Design you will surely fare well. They take your address to a higher level.
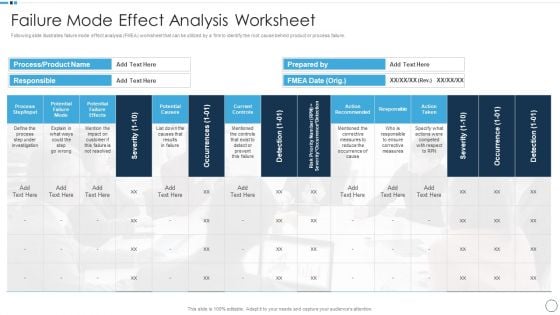
QA Plan Set 1 Failure Mode Effect Analysis Worksheet Download PDF
Following slide illustrates failure mode effect analysis FMEA worksheet that can be utilized by a firm to identify the root cause behind product or process failure. Deliver an awe inspiring pitch with this creative QA Plan Set 1 Failure Mode Effect Analysis Worksheet Download PDF bundle. Topics like Risk Priority, Customer, Potential Failure Effects can be discussed with this completely editable template. It is available for immediate download depending on the needs and requirements of the user.

Issues And Impact Of Failure Mode And Effects Of Failure Mode And Effects Analysis FMEA Process Diagrams PDF
The slide provides the analysis of FMEA process, that covers major headings process steps, failure mode, failure effect, failure cause etc.along with the description and example.Deliver and pitch your topic in the best possible manner with this Issues And Impact Of Failure Mode And Effects Of Failure Mode And Effects Analysis FMEA Process Diagrams PDF. Use them to share invaluable insights on Potential Failure, Potential Cause, Current Process and impress your audience. This template can be altered and modified as per your expectations. So, grab it now.
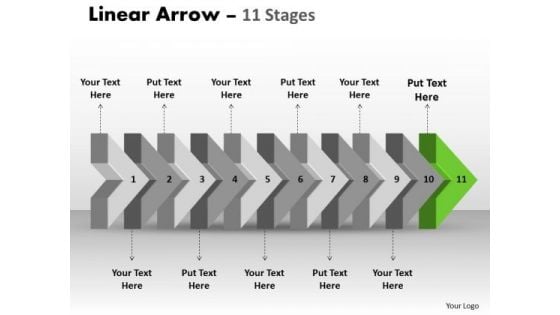
Ppt 3d Illustration Of Beeline Arrow Flow Ishikawa Diagram PowerPoint Template 12 Graphic
We present our PPT 3d illustration of beeline arrow flow ishikawa diagram PowerPoint template 12 Graphic. Use our Arrows PowerPoint Templates because; Watch their mental juices begin to flow. Use our Business PowerPoint Templates because, Marketing Strategy Business Template: - Maximizing sales of your product is the intended destination. Use our Process and Flows PowerPoint Templates because, Set out the goals and your plan of action for them. Use our Symbol PowerPoint Templates because, It is in your DNA to analyze possible causes to the minutest detail. Use our Metaphor PowerPoint Templates because; Show them how to churn out fresh ideas. Use these PowerPoint slides for presentations relating to Abstract, Age, Ancient, Antique, Arrows, Art, Artistic, Background, Colors, Decoration, Design, Dynamic, Elegant, Element, Future, Illustration, Index, Linear, Lines, Modern, Old, Paper, Pattern, Scratch, Text, Texture, Up, Vintage. The prominent colors used in the PowerPoint template are Green, Gray, Black Create failsafe designs with our Ppt 3d Illustration Of Beeline Arrow Flow Ishikawa Diagram PowerPoint Template 12 Graphic. Examine likely defects in detail.
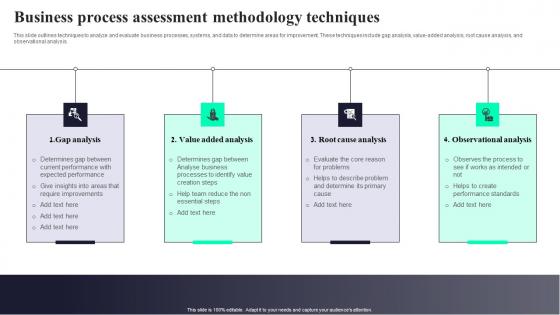
Business Process Assessment Methodology Techniques Demonstration Pdf
This slide outlines techniques to analyze and evaluate business processes, systems, and data to determine areas for improvement. These techniques include gap analysis, value-added analysis, root cause analysis, and observational analysis. Showcasing this set of slides titled Business Process Assessment Methodology Techniques Demonstration Pdf. The topics addressed in these templates are Gap Analysis, Value Added Analysis, Root Cause Analysis. All the content presented in this PPT design is completely editable. Download it and make adjustments in color, background, font etc. as per your unique business setting. This slide outlines techniques to analyze and evaluate business processes, systems, and data to determine areas for improvement. These techniques include gap analysis, value-added analysis, root cause analysis, and observational analysis.
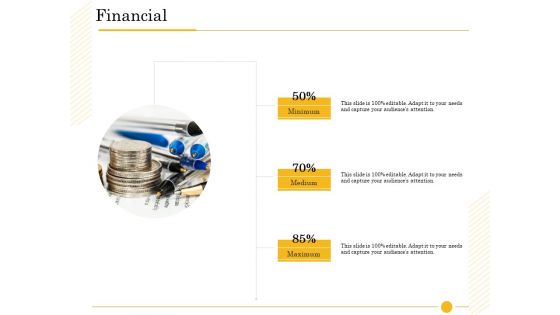
The Fishbone Analysis Tool Financial Ppt File Inspiration PDF
Presenting the fishbone analysis tool financial ppt file inspiration pdf to provide visual cues and insights. Share and navigate important information on three stages that need your due attention. This template can be used to pitch topics like minimum, medium, maximum. In addtion, this PPT design contains high-resolution images, graphics, etc, that are easily editable and available for immediate download.
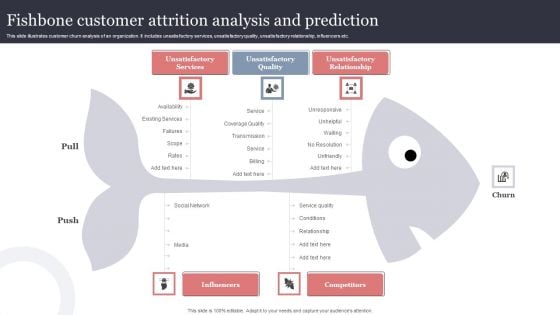
Fishbone Customer Attrition Analysis And Prediction Structure PDF
This slide illustrates customer churn analysis of an organization. It includes unsatisfactory services, unsatisfactory quality, unsatisfactory relationship, influencers etc. Showcasing this set of slides titled Fishbone Customer Attrition Analysis And Prediction Structure PDF. The topics addressed in these templates are Unsatisfactory Services, Unsatisfactory Quality, Unsatisfactory Relationship, Influencers. All the content presented in this PPT design is completely editable. Download it and make adjustments in color, background, font etc. as per your unique business setting.
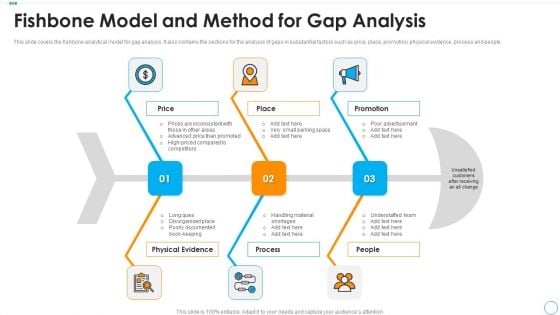
Fishbone Model And Method For Gap Analysis Elements PDF
This slide covers the fishbone analytical model for gap analysis. It also contains the sections for the analysis of gaps in substantial factors such as price, place, promotion, physical evidence, process and people. Persuade your audience using this fishbone model and method for gap analysis elements pdf. This PPT design covers three stages, thus making it a great tool to use. It also caters to a variety of topics including physical evidence, process, people. Download this PPT design now to present a convincing pitch that not only emphasizes the topic but also showcases your presentation skills.
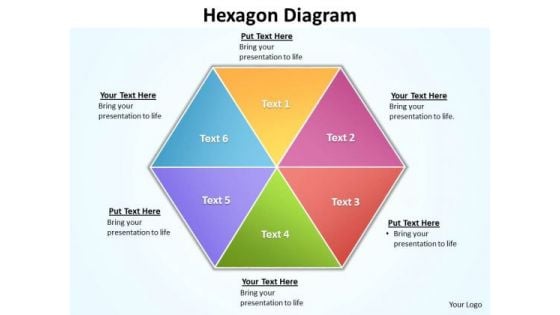
Ppt 6 Factors Hexagon Angles Free Fishbone Diagram PowerPoint Template Editable Templates
PPT 6 factors hexagon angles free fishbone diagram PowerPoint template editable Templates-Visually support your Microsoft office PPT Presentation with our above Diagram illustrating six factors combined in the form of Hexagon. This image identifies the concept of Inter-related issues to be explained together. Adjust the above image in your PPT presentations to visually support your content in your Business PPT slideshows -PPT 6 factors hexagon angles free fishbone diagram PowerPoint template editable Templates-attached, backgrounds, blue, cell, color, component, connect, connection, diagram, elements, geometric, graphic, group, hexagon, honeycomb, icon, illustration, intricacy, lines, link, map, mesh, model, network, science, shape, shiny, strategy, structure, symbol, teamwork, technology Our Ppt 6 Factors Hexagon Angles Free Fishbone Diagram PowerPoint Template Editable Templates will fetch it for you. They will bring audience adulation to your doorstep.
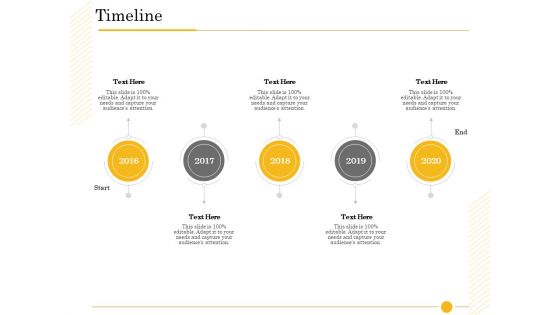
The Fishbone Analysis Tool Timeline Ppt Show Guidelines PDF
This is a the fishbone analysis tool timeline ppt show guidelines pdf template with various stages. Focus and dispense information on five stages using this creative set, that comes with editable features. It contains large content boxes to add your information on topics like timeline, 2016 to 2020. You can also showcase facts, figures, and other relevant content using this PPT layout. Grab it now.
RCA Action Plan For Business Cyber Security Icons PDF
This slide shows root cause analysis action plan to identify and provide strategies for overcoming cyber security threats. It include root cause, action plan and outcomes, etc. Showcasing this set of slides titled RCA Action Plan For Business Cyber Security Icons PDF Elements. The topics addressed in these templates are Root Cause, Action Plan, Outcomes. All the content presented in this PPT design is completely editable. Download it and make adjustments in color, background, font etc. as per your unique business setting.
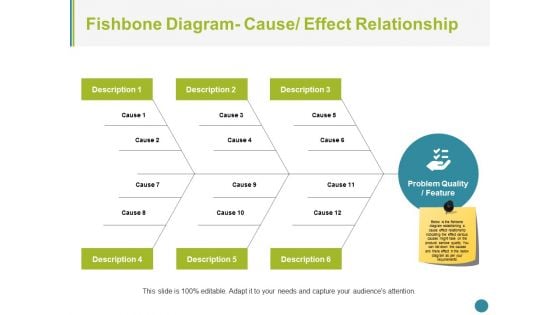
Fishbone Diagram Cause Effect Relationship Ppt PowerPoint Presentation Styles Files
This is a Fishbone Diagram Cause Effect Relationship Ppt PowerPoint Presentation Styles Files. This is a six stage process. The stages in this process are fishbone, management, strategy, analysis, business.
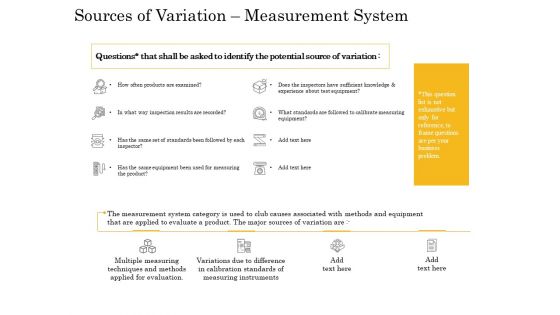
The Fishbone Analysis Tool Sources Of Variation Measurement System Slides PDF
Deliver and pitch your topic in the best possible manner with this the fishbone analysis tool sources of variation measurement system slides pdf. Use them to share invaluable insights on calibrate measuring equipment, measuring product, sufficient knowledge experience, system category, sources variation, evaluate a product and impress your audience. This template can be altered and modified as per your expectations. So, grab it now.
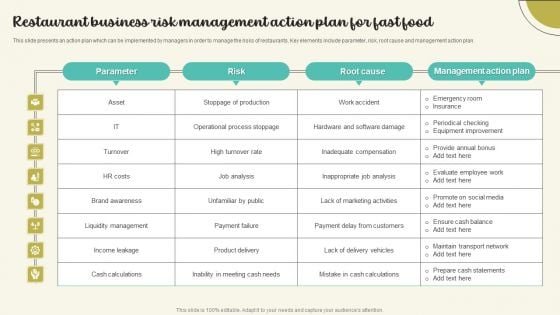
Restaurant Business Risk Management Action Plan For Fast Food Background PDF
This slide presents an action plan which can be implemented by managers in order to manage the risks of restaurants. Key elements include parameter, risk, root cause and management action plan. Showcasing this set of slides titled Restaurant Business Risk Management Action Plan For Fast Food Background PDF. The topics addressed in these templates are Brand Awareness, Liquidity Management, Inappropriate Job Analysis. All the content presented in this PPT design is completely editable. Download it and make adjustments in color, background, font etc. as per your unique business setting.
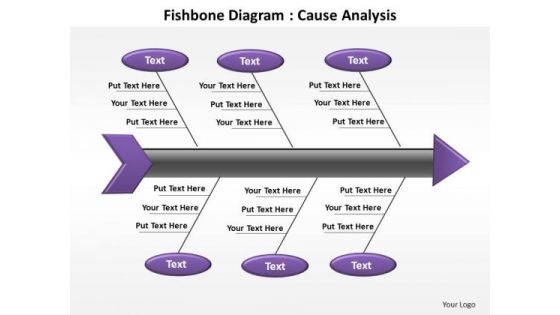
PowerPoint Process Leadership Fishbone Diagram Ppt Slide Designs
PowerPoint Process Leadership Fishbone Diagram PPT Slide Designs-Explore the various directions and layers existing in your in your plans and processes. Unravel the desired and essential elements of your overall strategy. Explain the relevance of the different layers and stages and directions in getting down to your core competence, ability and desired result.-These amazing PowerPoint pre-designed slides and PowerPoint templates have been carefully created by our team of experts to help you impress your audience. Our stunning collection of Powerpoint slides are 100% editable and can easily fit in any PowerPoint presentations. By using these animations and graphics in PowerPoint and you can easily make professional presentations. Any text can be entered at any point in the PowerPoint template or slide. Just DOWNLOAD our awesome PowerPoint templates and you are ready to go. Advise teams with our PowerPoint Process Leadership Fishbone Diagram Ppt Slide Designs. You will come out on top.
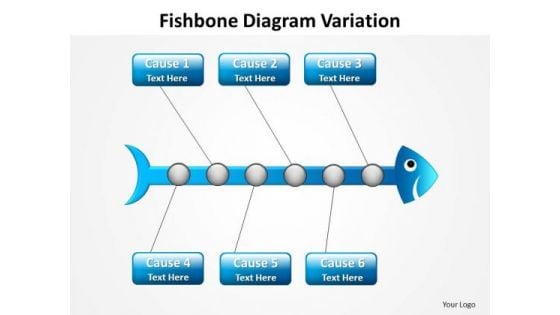
PowerPoint Design Slides Teamwork Fishbone Diagram Ppt Theme
PowerPoint Design Slides Teamwork Fishbone Diagram PPT Theme-Explore the various directions and layers existing in your in your plans and processes. Unravel the desired and essential elements of your overall strategy. Explain the relevance of the different layers and stages and directions in getting down to your core competence, ability and desired result.-These amazing PowerPoint pre-designed slides and PowerPoint templates have been carefully created by our team of experts to help you impress your audience. Our stunning collection of Powerpoint slides are 100% editable and can easily fit in any PowerPoint presentations. By using these animations and graphics in PowerPoint and you can easily make professional presentations. Any text can be entered at any point in the PowerPoint template or slide. Just DOWNLOAD our awesome PowerPoint templates and you are ready to go. Bring it all to a fever pitch. Boost the buzz with our PowerPoint Design Slides Teamwork Fishbone Diagram Ppt Theme.
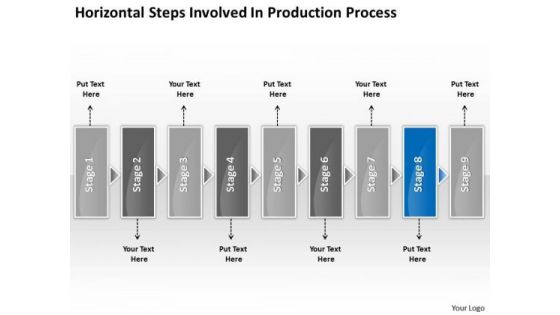
Horizontal Steps Involved Production Processs Business Fishbone Chart PowerPoint Templates
We present our horizontal steps involved production processs business fishbone chart PowerPoint templates.Download and present our Arrows PowerPoint Templates because this layout helps you to see satisfaction spread across the room as they unravel your gifted views. Use our Shapes PowerPoint Templates because you should take your team soaring to the pinnacle they crave. Present our Business PowerPoint Templates because this is the unerring accuracy in reaching the target. the effortless ability to launch into flight. Use our Boxes PowerPoint Templates because your listeners do not have to put on their thinking caps. Download our Communication PowerPoint Templates because you can gain the success to desired levels in one go.Use these PowerPoint slides for presentations relating to abstract, arrow, blank, business, chart, circular, circulation, concept, conceptual, design, diagram, executive, flow, horizontal, icon, idea, illustration, management, model, numbers, organization, process, progression, resource, sequence, stages, steps, strategy. The prominent colors used in the PowerPoint template are Blue, Gray, Black. The feedback we get is that our horizontal steps involved production processs business fishbone chart PowerPoint templates are Magnificent. PowerPoint presentation experts tell us our chart PowerPoint templates and PPT Slides are Elegant. People tell us our horizontal steps involved production processs business fishbone chart PowerPoint templates are Nice. Professionals tell us our circulation PowerPoint templates and PPT Slides are Colorful. You can be sure our horizontal steps involved production processs business fishbone chart PowerPoint templates are Fun. We assure you our concept PowerPoint templates and PPT Slides are designed by a team of presentation professionals. Present top flight leadership competencies with our Horizontal Steps Involved Production Processs Business Fishbone Chart PowerPoint Templates. They will make you look good.
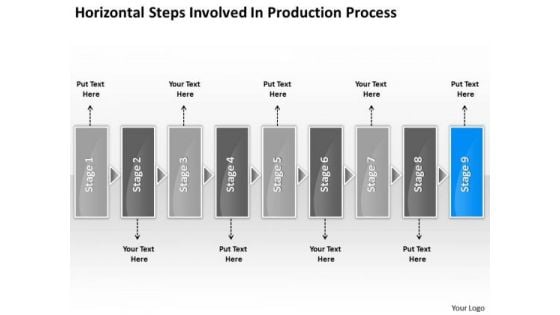
Horizontal Steps Involved Production Processs Flowchart Fishbone Chart PowerPoint Templates
We present our horizontal steps involved production processs flowchart fishbone chart PowerPoint templates.Download our Arrows PowerPoint Templates because the gears of youthful minds are useful, therefore set them in motion. Download and present our Shapes PowerPoint Templates because this is Aesthetically designed to make a great first impression this template highlights . Download our Business PowerPoint Templates because you can Flutter your wings and enchant the world. Impress them with the innate attractiveness of your thoughts and words. Download and present our Boxes PowerPoint Templates because you will be able to Highlight the various ways in which we can maintain its efficiency. Present our Communication PowerPoint Templates because if making a mark is your obsession, then let others get Obsessed with you.Use these PowerPoint slides for presentations relating to abstract, arrow, blank, business, chart, circular, circulation, concept, conceptual, design, diagram, executive, flow, horizontal, icon, idea, illustration, management, model, numbers, organization, process, progression, resource, sequence, stages, steps, strategy. The prominent colors used in the PowerPoint template are Blue, Gray, Black. The feedback we get is that our horizontal steps involved production processs flowchart fishbone chart PowerPoint templates are Tasteful. PowerPoint presentation experts tell us our business PowerPoint templates and PPT Slides are Second to none. People tell us our horizontal steps involved production processs flowchart fishbone chart PowerPoint templates are Fun. Professionals tell us our blank PowerPoint templates and PPT Slides are Tasteful. You can be sure our horizontal steps involved production processs flowchart fishbone chart PowerPoint templates are specially created by a professional team with vast experience. They diligently strive to come up with the right vehicle for your brilliant Ideas. We assure you our chart PowerPoint templates and PPT Slides are Reminiscent. Our Horizontal Steps Involved Production Processs Flowchart Fishbone Chart PowerPoint Templates will give you the right feeling. You will be sure you have made the right choice.
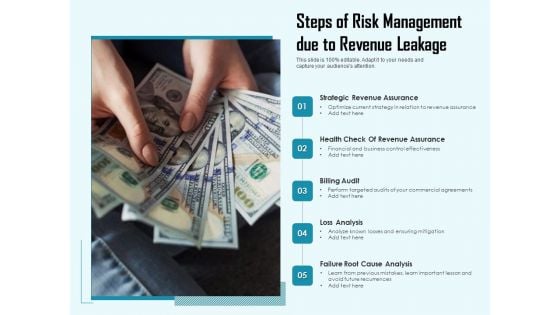
Steps Of Risk Management Due To Revenue Leakage Ppt PowerPoint Presentation Ideas Skills PDF
Presenting steps of risk management due to revenue leakage ppt powerpoint presentation ideas skills pdf to dispense important information. This template comprises five stages. It also presents valuable insights into the topics including strategic revenue assurance, health check of revenue assurance, billing audit, loss analysis, failure root cause analysis. This is a completely customizable PowerPoint theme that can be put to use immediately. So, download it and address the topic impactfully.
The Fishbone Analysis Tool Post It Notes Ppt Inspiration Picture PDF
This is a the fishbone analysis tool post it notes ppt inspiration picture pdf template with various stages. Focus and dispense information on three stages using this creative set, that comes with editable features. It contains large content boxes to add your information on topics like post it notes. You can also showcase facts, figures, and other relevant content using this PPT layout. Grab it now.
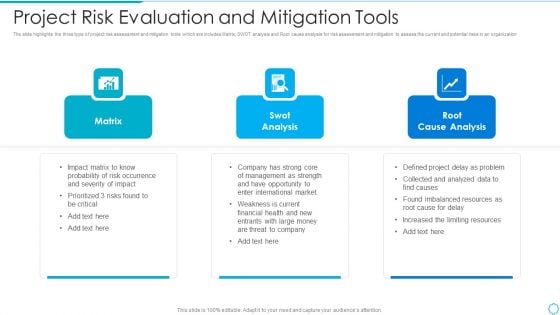
Project Risk Evaluation And Mitigation Tools Professional PDF
The slide highlights the three type of project risk assessment and mitigation tools which are includes Matrix, SWOT analysis and Root cause analysis for risk assessment and mitigation to assess the current and potential risks in an organization Persuade your audience using this project risk evaluation and mitigation tools professional pdf This PPT design covers three stages, thus making it a great tool to use. It also caters to a variety of topics including probability of risk occurrence, impact matrix, management as strength Download this PPT design now to present a convincing pitch that not only emphasizes the topic but also showcases your presentation skills.
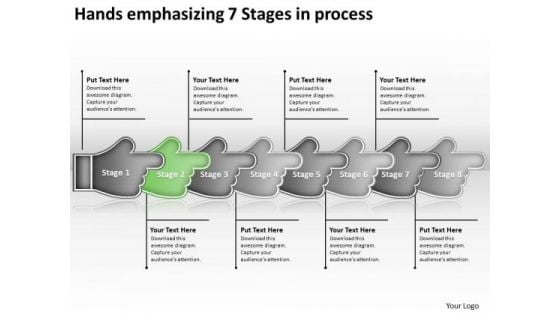
Hands Emphasizing 7 Stages Process Fishbone Chart PowerPoint Slides
We present our hands emphasizing 7 stages process fishbone chart PowerPoint Slides. Use our Advertising PowerPoint Templates because, to achieve sure shot success they need to come together at the right time, place and manner. Use our Shapes PowerPoint Templates because; Impress upon the audience how your strategy will carry all to the top of the corporate heap. Use our Targets PowerPoint Templates because, guaranteed to focus the minds of your team. Use our Process and Flows PowerPoint Templates because; adorn them with your ideas and thoughts. Use our Signs PowerPoint Templates because, your brain is always churning out ideas like cogs in a wheel. Use these PowerPoint slides for presentations relating to Adult, alone, arranging, background, child, dirty, empty, family, handprint, hands, human, identity, illustration, isolated, love, messy, naked, objects, paint, painting, palm, set, shape, simple, stage, stained, stamp, toe, togetherness. The prominent colors used in the PowerPoint template are Green, Gray, and White Heal the misdirected with our Hands Emphasizing 7 Stages Process Fishbone Chart PowerPoint Slides. Try us out and see what a difference our templates make.
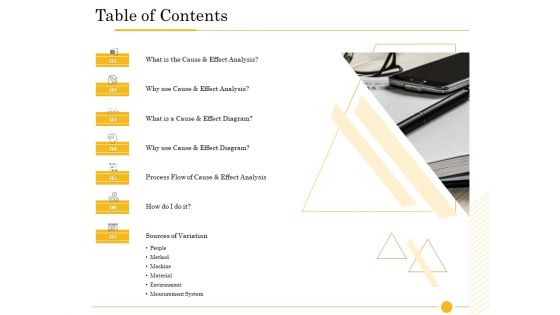
The Fishbone Analysis Tool Table Of Contents Ppt Styles Background Designs PDF
Presenting the fishbone analysis tool table of contents ppt styles background designs pdf to provide visual cues and insights. Share and navigate important information on seven stages that need your due attention. This template can be used to pitch topics like measurement system, sources variation, effect analysis, machine, environment, table contents. In addtion, this PPT design contains high-resolution images, graphics, etc, that are easily editable and available for immediate download.
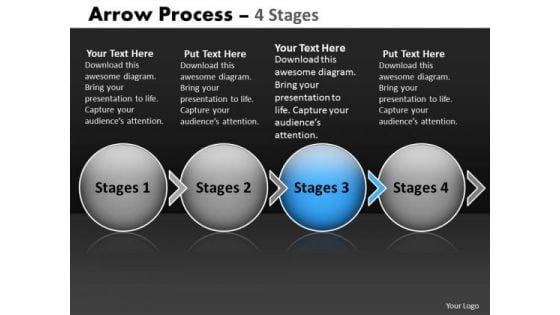
Ppt Theme Circular Flow Of 4 Stage Ishikawa Diagram PowerPoint Template Image
We present our PPT Theme circular flow of 4 stage ishikawa diagram PowerPoint template Image. Use our Arrows PowerPoint Templates because; explain your strategy to co-ordinate activities of these separate groups. Use our Symbol PowerPoint Templates because; Raise your Company stocks at the Opening Bell. Use our Business PowerPoint Templates because; explain your strategy to co-ordinate activities of these separate groups. Use our Process and Flows PowerPoint Templates because, Brilliant ideas popping up all over the place. Use our Marketing PowerPoint Templates because, now spread the fruits of your efforts and elaborate your ideas on the prevention, diagnosis, control and cure of prevalent diseases. Use these PowerPoint slides for presentations relating to Account, Arrow, Arrows, Away, Box, Business, Chart, Choice, Choose, Concept, Concepts, Consultation, Corporate, Design, Diagram, Direction, Elements, Flow, Follow, Follows, Future, Group, Grow, Increase, Lines, Many, Month, Move, Past, Period, Phase, Project, Report, Rise, Row, Step, Success, Text, Time, Timeline, Today, Up, Way, Ways, Work, Year. The prominent colors used in the PowerPoint template are Blue, Gray, and Black Equip your thoughts with our Ppt Theme Circular Flow Of 4 Stage Ishikawa Diagram PowerPoint Template Image. They will prove a worthwhile accessory.
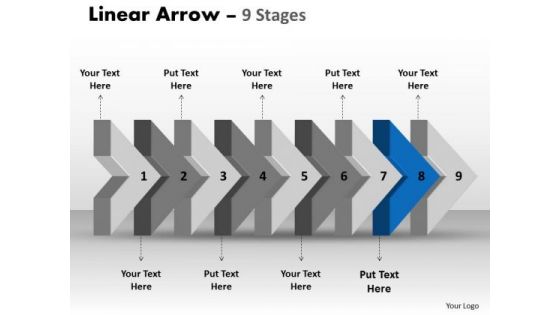
Ppt Theme Beeline Flow Manner Charts Arrow Ishikawa Diagram PowerPoint Template 9 Design
We present our PPT Theme beeline flow manner charts arrow ishikawa diagram PowerPoint template 9 design. Use our Arrows PowerPoint Templates because, you have a great training programmed in mind to upgrade the skills of your staff. Use our Symbol PowerPoint Templates because, to achieve sure shot success they need to come together at the right time, place and manner. Use our Business PowerPoint Templates because, Marketing Strategy Business Template: - Maximizing sales of your product is the intended destination. Use our Process and Flows PowerPoint Templates because, our ready backdrops leave a lasting impression. Use our Marketing PowerPoint Templates because, you have the people in place, selected the team leaders and all are raring to go. Use these PowerPoint slides for presentations relating to Aim, Angle, Arrow, Arrowheads, Badge, Banner, Connection, Curve, Design, Direction, Download, Element, Fuchsia, Icon, Illustration, Indicator, Internet, Label, Link, Magenta, Mark, Marker, Next, Object, Orientation, Pointer, Shadow, Shape, Signs, Symbol. The prominent colors used in the PowerPoint template are Blue, Gray, and Black Become a leader with our Ppt Theme Beeline Flow Manner Charts Arrow Ishikawa Diagram PowerPoint Template 9 Design. You will come out on top.
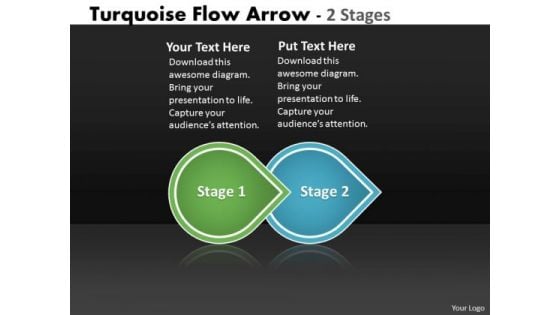
Ppt Theme Beeline Two Phase Diagram Arrow Ishikawa PowerPoint Template 1 Design
We present our PPT Theme beeline two phase diagram arrow ishikawa PowerPoint template 1 design. Use our Arrows PowerPoint Templates because; Use them to help you organize the logic of your views. Use our Symbol PowerPoint Templates because; unravel the desired and essential elements of your overall strategy. Use our Business PowerPoint Templates because; emphasize the benefits of healthy food habits and lifestyles in respect of vital organs of the human anatomy. Use our Process and Flows PowerPoint Templates because; illustrate your plans on using the many social media modes available to inform society at large of the benefits of your product. Use our Marketing PowerPoint Templates because; Take your team along by explaining your plans. Use these PowerPoint slides for presentations relating to Arrows, Background, Business, Chart, Circle, Circular, Financial, Flow, Graphic, Gray, Icon, Illustration, Isometric, Leadership, Marketing, Perspective, Process, Recycle, Round, Shape, Steps. The prominent colors used in the PowerPoint template are Green, Blue, and White Festoon your address with our Ppt Theme Beeline Two Phase Diagram Arrow Ishikawa PowerPoint Template 1 Design. You will come up with a festival of ideas.
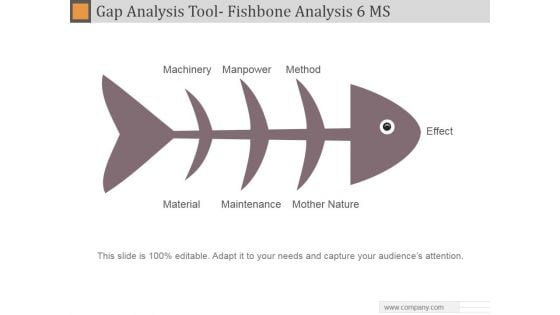
Gap Analysis Tool Fishbone Analysis 6 MS Ppt PowerPoint Presentation Inspiration
This is a gap analysis tool fishbone analysis 6 ms ppt powerpoint presentation inspiration. This is a three stage process. The stages in this process are machinery, manpower, method, material, maintenance, mother nature, effect.
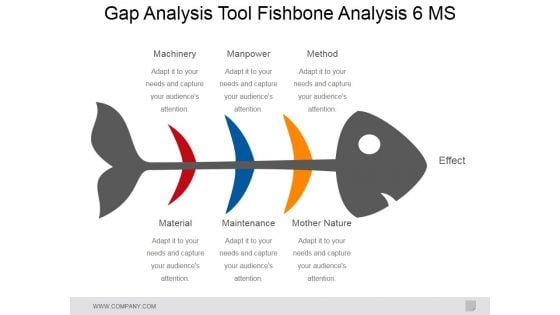
Gap Analysis Tool Fishbone Analysis 6 Ms Ppt PowerPoint Presentation Ideas Slides
This is a gap analysis tool fishbone analysis 6 ms ppt powerpoint presentation ideas slides. This is a six stage process. The stages in this process are machinery, manpower, method, material, maintenance, mother nature, effect.
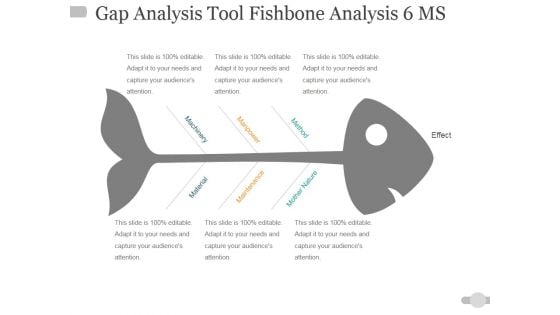
Gap Analysis Tool Fishbone Analysis 6 Ms Ppt PowerPoint Presentation Infographic Template Information
This is a gap analysis tool fishbone analysis 6 ms ppt powerpoint presentation infographic template information. This is a one stage process. The stages in this process are material, maintenance, mother nature, machinery, manpower, method, effect.

Gap Analysis Tool Fishbone Analysis 6 Ms Ppt Powerpoint Presentation Summary Samples
This is a gap analysis tool fishbone analysis 6 ms ppt powerpoint presentation summary samples. This is a three stage process. The stages in this process are machinery, manpower, method, effect.
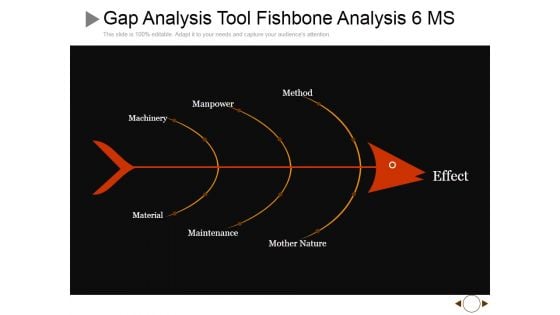
Gap Analysis Tool Fishbone Analysis 6 MS Ppt PowerPoint Presentation Summary Graphic Images
This is a gap analysis tool fishbone analysis 6 ms ppt powerpoint presentation summary graphic images. This is a three stage process. The stages in this process are machinery, manpower, method, effect, maintenance.
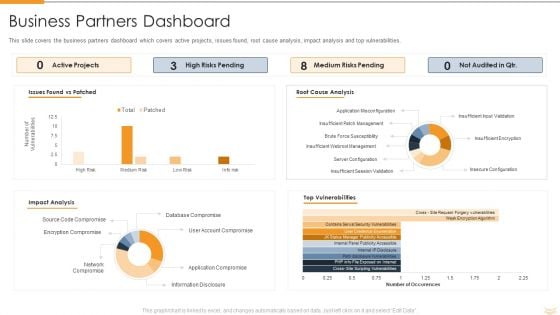
Strategic Partnership Management Plan Business Partners Dashboard Mockup PDF
This slide covers the business partners dashboard which covers active projects, issues found, root cause analysis, impact analysis and top vulnerabilities. Deliver an awe inspiring pitch with this creative strategic partnership management plan business partners dashboard mockup pdf bundle. Topics like issues found vs patched, impact analysis, root cause analysis, top vulnerabilities can be discussed with this completely editable template. It is available for immediate download depending on the needs and requirements of the user.
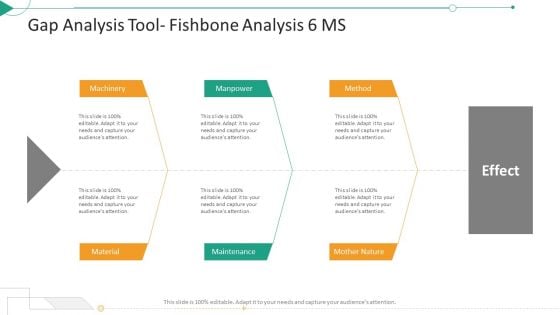
Strategic Planning Needs Evaluation Gap Analysis Tool Fishbone Analysis 6 MS Portrait PDF
Presenting strategic planning needs evaluation gap analysis tool fishbone analysis 6 ms portrait pdf to provide visual cues and insights. Share and navigate important information on three stages that need your due attention. This template can be used to pitch topics like machinery, material, maintenance, method. In addtion, this PPT design contains high resolution images, graphics, etc, that are easily editable and available for immediate download.
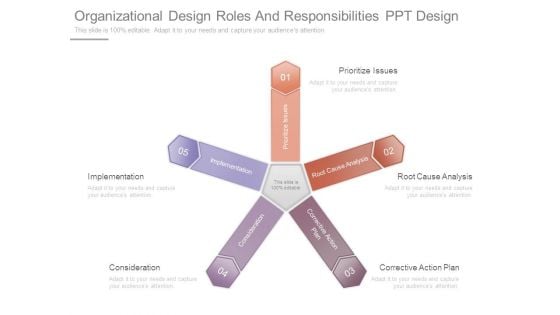
Organizational Design Roles And Responsibilities Ppt Design
This is a organizational design roles and responsibilities ppt design. This is a five stage process. The stages in this process are implementation, consideration, prioritize, issues, root cause analysis, corrective action plan.
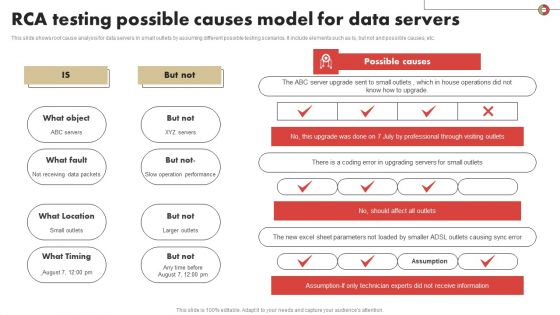
RCA Testing Possible Causes Model For Data Servers Structure PDF
This slide shows root cause analysis for data servers in small outlets by assuming different possible testing scenarios. It include elements such as Is, but not and possible causes, etc. Pitch your topic with ease and precision using this RCA Testing Possible Causes Model For Data Servers Structure PDF Themes. This layout presents information on Possible Causes, Receive Information, Server Upgrade. It is also available for immediate download and adjustment. So, changes can be made in the color, design, graphics or any other component to create a unique layout.
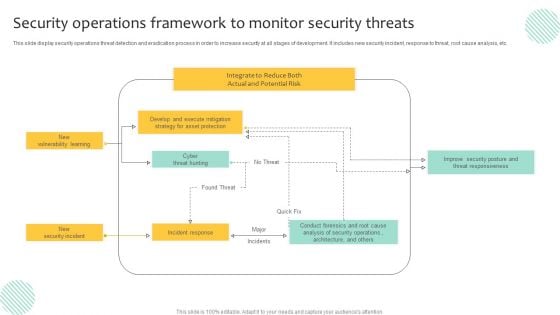
Security Operations Framework To Monitor Security Threats Demonstration PDF
This slide display security operations threat detection and eradication process in order to increase security at all stages of development. It includes new security incident, response to threat, root cause analysis, etc. Pitch your topic with ease and precision using this Security Operations Framework To Monitor Security Threats Demonstration PDF. This layout presents information on Execute Mitigation, Develop, Strategy. It is also available for immediate download and adjustment. So, changes can be made in the color, design, graphics or any other component to create a unique layout.
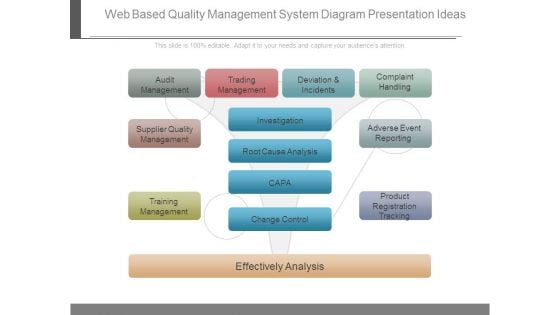
Web Based Quality Management System Diagram Presentation Ideas
This is a web based quality management system diagram presentation ideas. This is a six stage process. The stages in this process are audit management, trading management, deviation and incidents, complaint handling, supplier quality management, training management, effectively analysis, investigation, root cause analysis, capa, change control, adverse event reporting, product registration tracking.
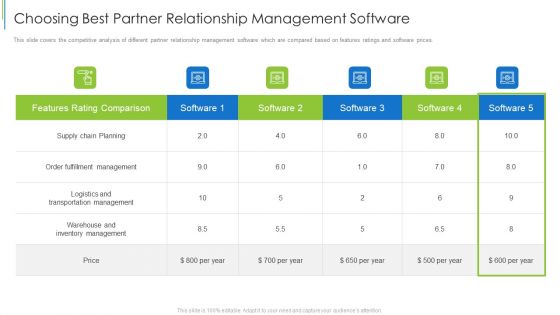
Choosing Best Partner Relationship Management Software Ideas PDF
This slide covers the business partners dashboard which covers active projects, issues found, root cause analysis, impact analysis and top vulnerabilities. Deliver an awe inspiring pitch with this creative choosing best partner relationship management software ideas pdf bundle. Topics like impact analysis, vulnerabilities, root cause analysis can be discussed with this completely editable template. It is available for immediate download depending on the needs and requirements of the user.
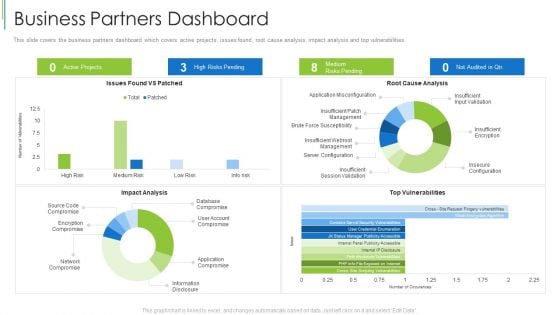
Business Partners Dashboard Effective Partnership Administration With Clients Channel And Corporate Partners Guidelines PDF
This slide covers the business partners dashboard which covers active projects, issues found, root cause analysis, impact analysis and top vulnerabilities. Deliver an awe inspiring pitch with this creative business partners dashboard effective partnership administration with clients channel and corporate partners guidelines pdf bundle. Topics like impact analysis, vulnerabilities, root cause analysis can be discussed with this completely editable template. It is available for immediate download depending on the needs and requirements of the user.
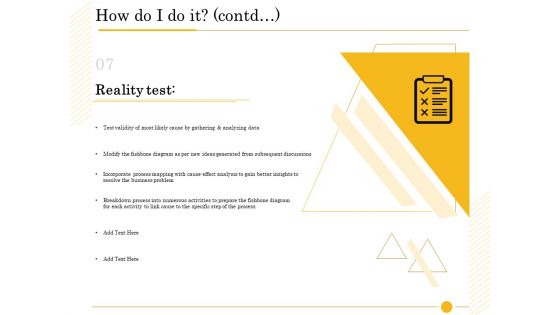
The Fishbone Analysis Tool How Do I Do It Contd Activities Infographics PDF
Deliver an awe-inspiring pitch with this creative the fishbone analysis tool how do i do it contd activities infographics pdf bundle. Topics like gathering analyzing data, modify fishbone diagram, incorporate process mapping, activities prepare, subsequent discussions, specific process can be discussed with this completely editable template. It is available for immediate download depending on the needs and requirements of the user.
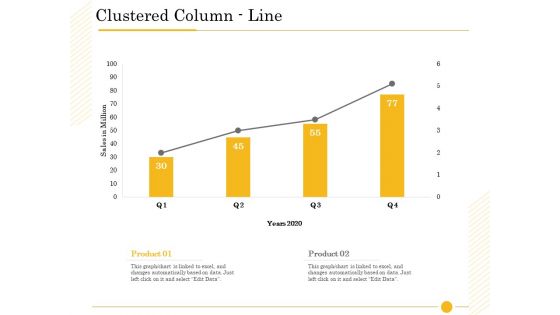
The Fishbone Analysis Tool Clustered Column Line Ppt Pictures Guidelines PDF
Deliver an awe-inspiring pitch with this creative the fishbone analysis tool clustered column line ppt pictures guidelines pdf bundle. Topics like Product 01, Product 02, product can be discussed with this completely editable template. It is available for immediate download depending on the needs and requirements of the user.
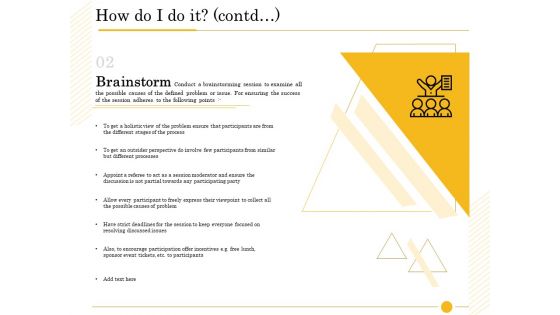
The Fishbone Analysis Tool How Do I Do It Contd Ppt Gallery Visual Aids PDF
Deliver and pitch your topic in the best possible manner with this the fishbone analysis tool how do i do it contd ppt gallery visual aids pdf. Use them to share invaluable insights on participants different stages process, outsider perspective, strict deadlines session, moderator ensure discussion and impress your audience. This template can be altered and modified as per your expectations. So, grab it now.
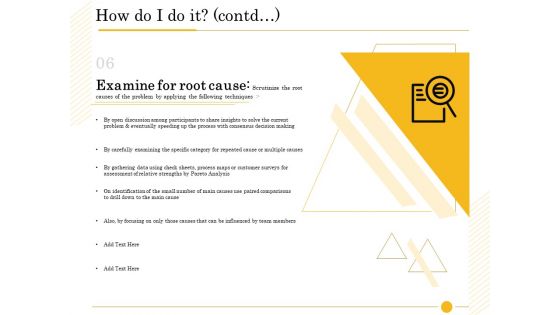
The Fishbone Analysis Tool How Do I Do It Contd Process Clipart PDF
Deliver and pitch your topic in the best possible manner with this the fishbone analysis tool how do i do it contd process clipart pdf. Use them to share invaluable insights on consensus decision making, customer surveys assessment relative strengths, process maps, paired comparisons, influenced team members, eventually speeding process and impress your audience. This template can be altered and modified as per your expectations. So, grab it now.
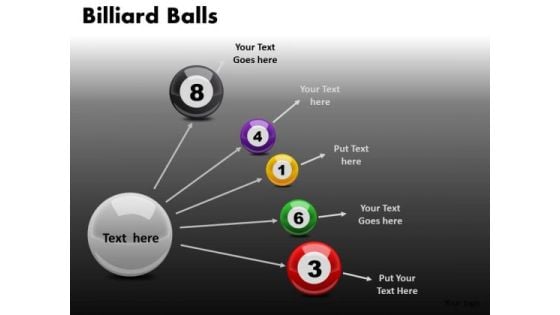
Cause Effect Options PowerPoint Ppt Templates
Cause Effect Options PowerPoint PPT templates-These high quality powerpoint pre-designed slides and powerpoint templates have been carefully created by our professional team to help you impress your audience. All slides have been created and are 100% editable in powerpoint. Each and every property of any graphic - color, size, orientation, shading, outline etc. can be modified to help you build an effective powerpoint presentation. Any text can be entered at any point in the powerpoint template or slide. Simply DOWNLOAD, TYPE and PRESENT! Sharpen your strategy with our Cause Effect Options PowerPoint Ppt Templates. You will come out on top.
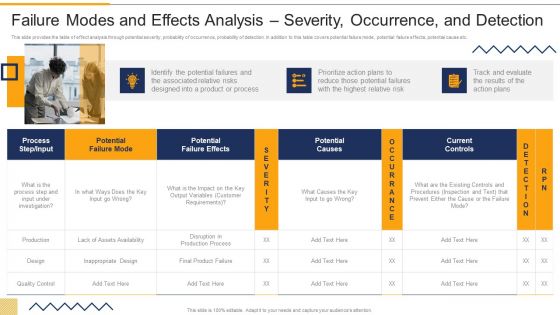
Failure Modes And Effects Analysis Severity Occurrence And Detection FMEA Techniques For Process Assessment Diagrams PDF
This slide provides the table of effect analysis through potential severity, probability of occurrence, probability of detection. In addition to this table covers potential failure mode, potential failure effects, potential cause etc.Deliver an awe inspiring pitch with this creative Failure Modes And Effects Analysis Severity Occurrence And Detection FMEA Techniques For Process Assessment Diagrams PDF bundle. Topics like Potential Failure, Customer Requirements, Potential Causes can be discussed with this completely editable template. It is available for immediate download depending on the needs and requirements of the user.
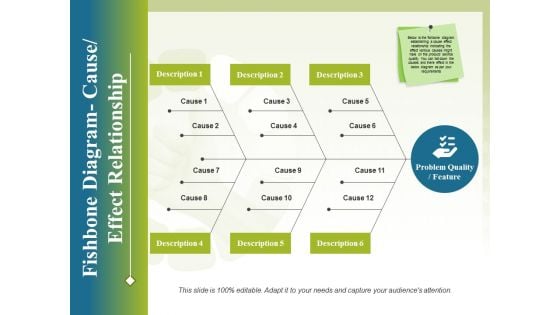
Fishbone Diagram Cause Effect Relationship Ppt PowerPoint Presentation Styles Design Inspiration
This is a fishbone diagram cause effect relationship ppt powerpoint presentation styles design inspiration. This is a three stage process. The stages in this process are business, process, analysis, strategy, management.
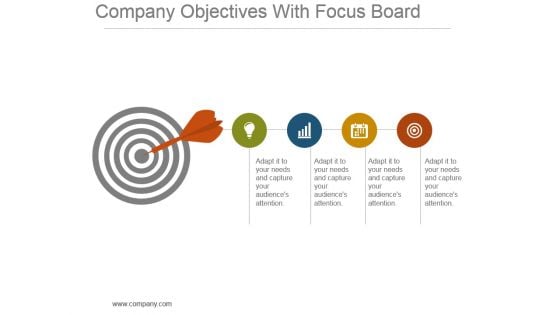
Company Objectives With Focus Board Powerpoint Slide Influencers
This is a company objectives with focus board powerpoint slide influencers. This is a one stage process. The stages in this process are icons, strategy, our goals, achievement, business.

The Fishbone Analysis Tool Ppt PowerPoint Presentation Complete Deck With Slides
This complete deck acts as a great communication tool. It helps you in conveying your business message with personalized sets of graphics, icons etc. Comprising a set of thirty three slides, this complete deck can help you persuade your audience. It also induces strategic thinking as it has been thoroughly researched and put together by our experts. Not only is it easily downloadable but also editable. The color, graphics, theme any component can be altered to fit your individual needs. So grab it now.
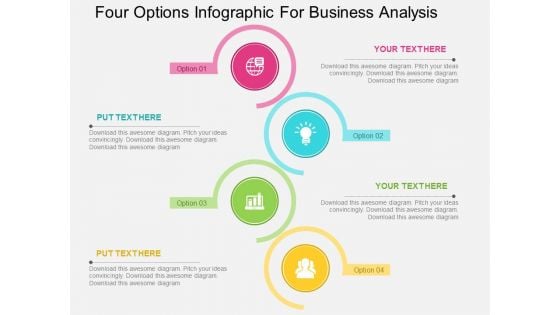
Four Options Infographic For Business Analysis Powerpoint Templates
This business diagram has been designed with four options infographic. This slide can be used for displaying business success and targets. Use this diagram for your business and success milestones related presentations.


 Continue with Email

 Home
Home


