Process Evaluation
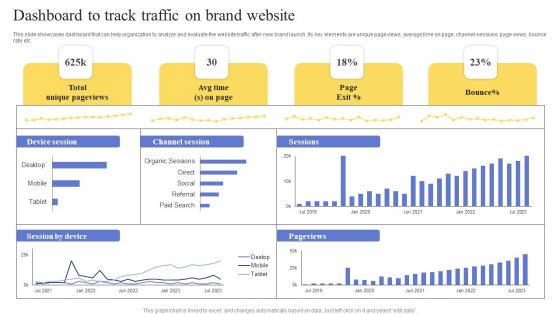
Dashboard To Track Traffic On Brand Website Maximizing Revenue Using Professional Pdf
This slide showcases dashboard that can help organization to analyze and evaluate the website traffic after new brand launch. Its key elements are unique page views, average time on page, channel sessions, page views, bounce rate etc. Are you in need of a template that can accommodate all of your creative concepts This one is crafted professionally and can be altered to fit any style. Use it with Google Slides or PowerPoint. Include striking photographs, symbols, depictions, and other visuals. Fill, move around, or remove text boxes as desired. Test out color palettes and font mixtures. Edit and save your work, or work with colleagues. Download Dashboard To Track Traffic On Brand Website Maximizing Revenue Using Professional Pdf and observe how to make your presentation outstanding. Give an impeccable presentation to your group and make your presentation unforgettable. This slide showcases dashboard that can help organization to analyze and evaluate the website traffic after new brand launch. Its key elements are unique page views, average time on page, channel sessions, page views, bounce rate etc.
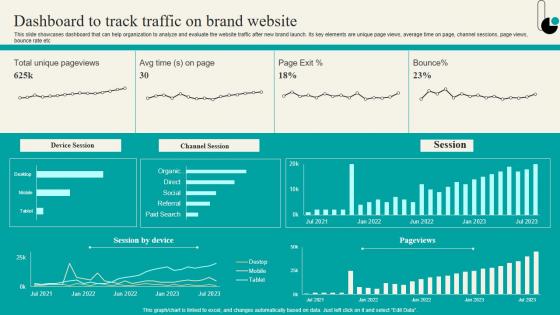
Dashboard To Track Traffic On Brand Website Strategic Marketing Plan Structure PDF
This slide showcases dashboard that can help organization to analyze and evaluate the website traffic after new brand launch. Its key elements are unique page views, average time on page, channel sessions, page views, bounce rate etc. Are you in need of a template that can accommodate all of your creative concepts This one is crafted professionally and can be altered to fit any style. Use it with Google Slides or PowerPoint. Include striking photographs, symbols, depictions, and other visuals. Fill, move around, or remove text boxes as desired. Test out color palettes and font mixtures. Edit and save your work, or work with colleagues. Download Dashboard To Track Traffic On Brand Website Strategic Marketing Plan Structure PDF and observe how to make your presentation outstanding. Give an impeccable presentation to your group and make your presentation unforgettable. This slide showcases dashboard that can help organization to analyze and evaluate the website traffic after new brand launch. Its key elements are unique page views, average time on page, channel sessions, page views, bounce rate etc.
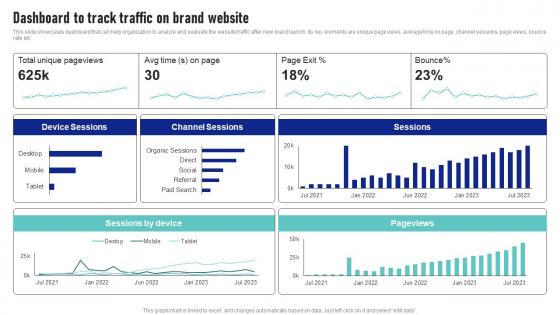
Dashboard To Track Traffic On Brand Website Launching New Product Brand Sample Pdf
This slide showcases dashboard that can help organization to analyze and evaluate the website traffic after new brand launch. Its key elements are unique page views, average time on page, channel sessions, page views, bounce rate etc Are you in need of a template that can accommodate all of your creative concepts This one is crafted professionally and can be altered to fit any style. Use it with Google Slides or PowerPoint. Include striking photographs, symbols, depictions, and other visuals. Fill, move around, or remove text boxes as desired. Test out color palettes and font mixtures. Edit and save your work, or work with colleagues. Download Dashboard To Track Traffic On Brand Website Launching New Product Brand Sample Pdf and observe how to make your presentation outstanding. Give an impeccable presentation to your group and make your presentation unforgettable. This slide showcases dashboard that can help organization to analyze and evaluate the website traffic after new brand launch. Its key elements are unique page views, average time on page, channel sessions, page views, bounce rate etc
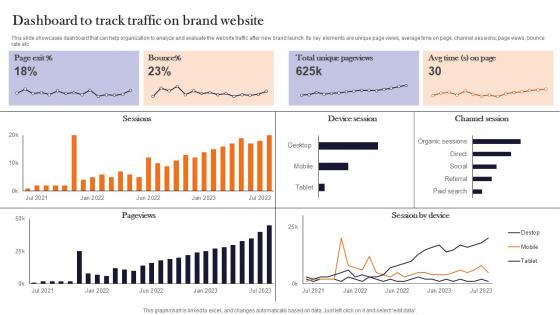
Dashboard To Track Traffic On Brand Website Product Advertising And Positioning Diagrams Pdf
This slide showcases dashboard that can help organization to analyze and evaluate the website traffic after new brand launch. Its key elements are unique page views, average time on page, channel sessions, page views, bounce rate etc. Are you in need of a template that can accommodate all of your creative concepts This one is crafted professionally and can be altered to fit any style. Use it with Google Slides or PowerPoint. Include striking photographs, symbols, depictions, and other visuals. Fill, move around, or remove text boxes as desired. Test out color palettes and font mixtures. Edit and save your work, or work with colleagues. Download Dashboard To Track Traffic On Brand Website Product Advertising And Positioning Diagrams Pdf and observe how to make your presentation outstanding. Give an impeccable presentation to your group and make your presentation unforgettable. This slide showcases dashboard that can help organization to analyze and evaluate the website traffic after new brand launch. Its key elements are unique page views, average time on page, channel sessions, page views, bounce rate etc.
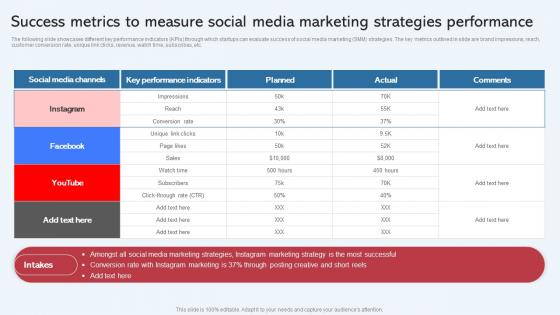
Success Metrics To Measure Social Media Marketing Strategies Effective Startup Mockup Microsoft Pdf
The following slide showcases different key performance indicators KPIs through which startups can evaluate success of social media marketing SMM strategies. The key metrics outlined in slide are brand impressions, reach, customer conversion rate, unique link clicks, revenue, watch time, subscribes, etc. Boost your pitch with our creative Success Metrics To Measure Social Media Marketing Strategies Effective Startup Mockup Microsoft Pdf. Deliver an awe inspiring pitch that will mesmerize everyone. Using these presentation templates you will surely catch everyones attention. You can browse the ppts collection on our website. We have researchers who are experts at creating the right content for the templates. So you do not have to invest time in any additional work. Just grab the template now and use them. The following slide showcases different key performance indicators KPIs through which startups can evaluate success of social media marketing SMM strategies. The key metrics outlined in slide are brand impressions, reach, customer conversion rate, unique link clicks, revenue, watch time, subscribes, etc.
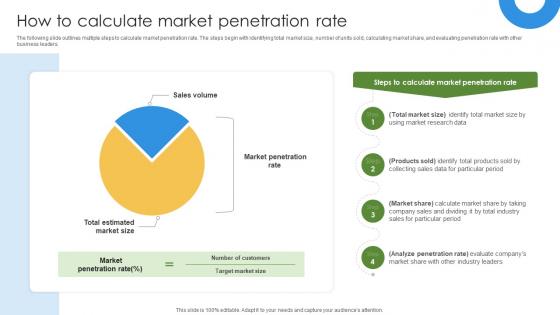
Marketing Growth Strategy How To Calculate Market Penetration Rate Strategy SS V
The following slide outlines multiple steps to calculate market penetration rate. The steps begin with identifying total market size, number of units sold, calculating market share, and evaluating penetration rate with other business leaders. If you are looking for a format to display your unique thoughts, then the professionally designed Marketing Growth Strategy How To Calculate Market Penetration Rate Strategy SS V is the one for you. You can use it as a Google Slides template or a PowerPoint template. Incorporate impressive visuals, symbols, images, and other charts. Modify or reorganize the text boxes as you desire. Experiment with shade schemes and font pairings. Alter, share or cooperate with other people on your work. Download Marketing Growth Strategy How To Calculate Market Penetration Rate Strategy SS V and find out how to give a successful presentation. Present a perfect display to your team and make your presentation unforgettable. The following slide outlines multiple steps to calculate market penetration rate. The steps begin with identifying total market size, number of units sold, calculating market share, and evaluating penetration rate with other business leaders.
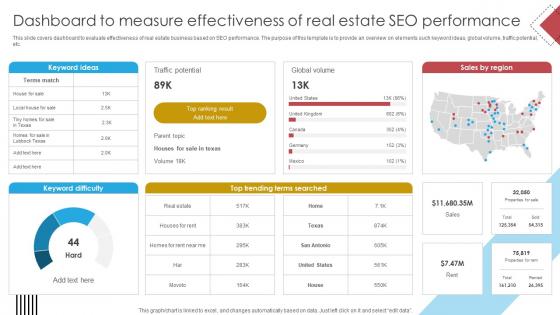
Blueprint For Effective Real Dashboard To Measure Effectiveness Of Real Estate Strategy SS V
This slide covers dashboard to evaluate effectiveness of real estate business based on SEO performance. The purpose of this template is to provide an overview on elements such keyword ideas, global volume, traffic potential, etc. If you are looking for a format to display your unique thoughts, then the professionally designed Blueprint For Effective Real Dashboard To Measure Effectiveness Of Real Estate Strategy SS V is the one for you. You can use it as a Google Slides template or a PowerPoint template. Incorporate impressive visuals, symbols, images, and other charts. Modify or reorganize the text boxes as you desire. Experiment with shade schemes and font pairings. Alter, share or cooperate with other people on your work. Download Blueprint For Effective Real Dashboard To Measure Effectiveness Of Real Estate Strategy SS V and find out how to give a successful presentation. Present a perfect display to your team and make your presentation unforgettable. This slide covers dashboard to evaluate effectiveness of real estate business based on SEO performance. The purpose of this template is to provide an overview on elements such keyword ideas, global volume, traffic potential, etc.
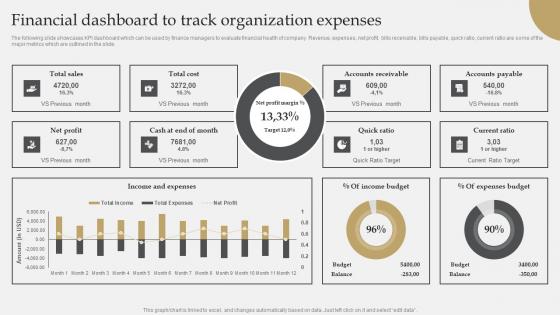
IT Industry Market Research Financial Dashboard To Track Organization Expenses Introduction Pdf
The following slide showcases KPI dashboard which can be used by finance managers to evaluate financial health of company. Revenue, expenses, net profit, bills receivable, bills payable, quick ratio, current ratio are some of the major metrics which are outlined in the slide. Present like a pro with IT Industry Market Research Financial Dashboard To Track Organization Expenses Introduction Pdf Create beautiful presentations together with your team, using our easy-to-use presentation slides. Share your ideas in real-time and make changes on the fly by downloading our templates. So whether you are in the office, on the go, or in a remote location, you can stay in sync with your team and present your ideas with confidence. With Slidegeeks presentation got a whole lot easier. Grab these presentations today. The following slide showcases KPI dashboard which can be used by finance managers to evaluate financial health of company. Revenue, expenses, net profit, bills receivable, bills payable, quick ratio, current ratio are some of the major metrics which are outlined in the slide.
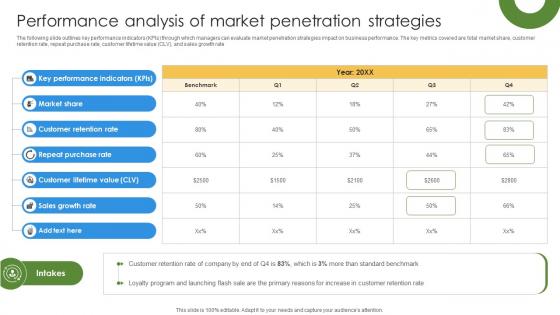
Marketing Growth Strategy To Performance Analysis Of Market Penetration Strategies Strategy SS V
The following slide outlines key performance indicators KPIs through which managers can evaluate market penetration strategies impact on business performance. The key metrics covered are total market share, customer retention rate, repeat purchase rate, customer lifetime value CLV, and sales growth rate. Slidegeeks is here to make your presentations a breeze with Marketing Growth Strategy To Performance Analysis Of Market Penetration Strategies Strategy SS V With our easy-to-use and customizable templates, you can focus on delivering your ideas rather than worrying about formatting. With a variety of designs to choose from, you are sure to find one that suits your needs. And with animations and unique photos, illustrations, and fonts, you can make your presentation pop. So whether you are giving a sales pitch or presenting to the board, make sure to check out Slidegeeks first The following slide outlines key performance indicators KPIs through which managers can evaluate market penetration strategies impact on business performance. The key metrics covered are total market share, customer retention rate, repeat purchase rate, customer lifetime value CLV, and sales growth rate.
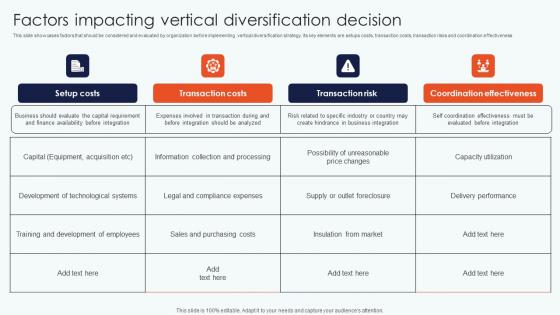
Factors Impacting Vertical Leveraging Horizontal Vertical Diversification Entering Background Pdf
This slide showcases factors that should be considered and evaluated by organization before implementing vertical diversification strategy. Its key elements are setups costs, transaction costs, transaction risks and coordination effectiveness Formulating a presentation can take up a lot of effort and time, so the content and message should always be the primary focus. The visuals of the PowerPoint can enhance the presenters message, so our Factors Impacting Vertical Leveraging Horizontal Vertical Diversification Entering Background Pdf was created to help save time. Instead of worrying about the design, the presenter can concentrate on the message while our designers work on creating the ideal templates for whatever situation is needed. Slidegeeks has experts for everything from amazing designs to valuable content, we have put everything into Factors Impacting Vertical Leveraging Horizontal Vertical Diversification Entering Background Pdf This slide showcases factors that should be considered and evaluated by organization before implementing vertical diversification strategy. Its key elements are setups costs, transaction costs, transaction risks and coordination effectiveness
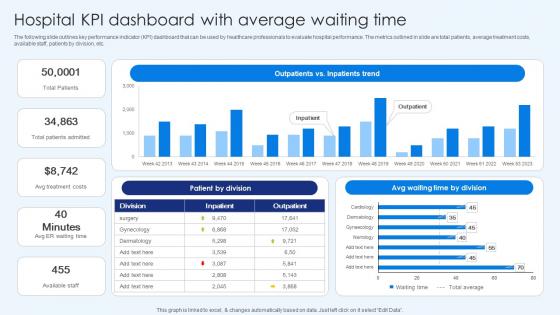
Hospital Kpi Dashboard With Average Waiting Time Healthcare Promotion Ideas Pdf
The following slide outlines key performance indicator KPI dashboard that can be used by healthcare professionals to evaluate hospital performance. The metrics outlined in slide are total patients, average treatment costs, available staff, patients by division, etc. Coming up with a presentation necessitates that the majority of the effort goes into the content and the message you intend to convey. The visuals of a PowerPoint presentation can only be effective if it supplements and supports the story that is being told. Keeping this in mind our experts created Hospital KPI Dashboard With Average Waiting Time Healthcare Promotion Ideas Pdf to reduce the time that goes into designing the presentation. This way, you can concentrate on the message while our designers take care of providing you with the right template for the situation. The following slide outlines key performance indicator KPI dashboard that can be used by healthcare professionals to evaluate hospital performance. The metrics outlined in slide are total patients, average treatment costs, available staff, patients by division, etc.
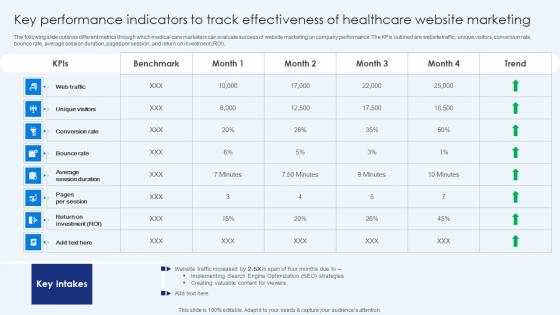
Key Performance Indicators To Track Effectiveness Healthcare Promotion Portrait Pdf
The following slide outlines different metrics through which medical care marketers can evaluate success of website marketing on company performance. The KPIs outlined are website traffic, unique visitors, conversion rate, bounce rate, average session duration, pages per session, and return on investment ROI. Are you searching for a Key Performance Indicators To Track Effectiveness Healthcare Promotion Portrait Pdf that is uncluttered, straightforward, and original Its easy to edit, and you can change the colors to suit your personal or business branding. For a presentation that expresses how much effort you have put in, this template is ideal With all of its features, including tables, diagrams, statistics, and lists, its perfect for a business plan presentation. Make your ideas more appealing with these professional slides. Download Key Performance Indicators To Track Effectiveness Healthcare Promotion Portrait Pdffrom Slidegeeks today. The following slide outlines different metrics through which medical care marketers can evaluate success of website marketing on company performance. The KPIs outlined are website traffic, unique visitors, conversion rate, bounce rate, average session duration, pages per session, and return on investment ROI.
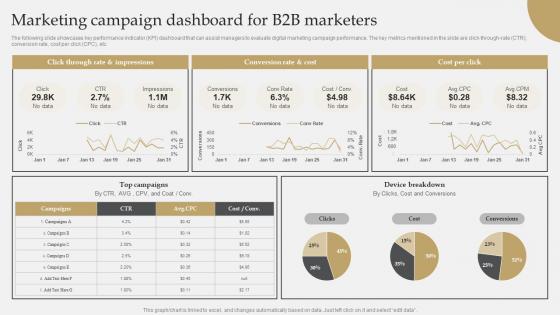
IT Industry Market Research Marketing Campaign Dashboard For B2b Marketers Demonstration Pdf
The following slide showcases key performance indicator KPI dashboard that can assist managers to evaluate digital marketing campaign performance. The key metrics mentioned in the slide are click-through-rate CTR, conversion rate, cost per click CPC, etc. Are you in need of a template that can accommodate all of your creative concepts This one is crafted professionally and can be altered to fit any style. Use it with Google Slides or PowerPoint. Include striking photographs, symbols, depictions, and other visuals. Fill, move around, or remove text boxes as desired. Test out color palettes and font mixtures. Edit and save your work, or work with colleagues. Download IT Industry Market Research Marketing Campaign Dashboard For B2b Marketers Demonstration Pdf and observe how to make your presentation outstanding. Give an impeccable presentation to your group and make your presentation unforgettable. The following slide showcases key performance indicator KPI dashboard that can assist managers to evaluate digital marketing campaign performance. The key metrics mentioned in the slide are click-through-rate CTR, conversion rate, cost per click CPC, etc.
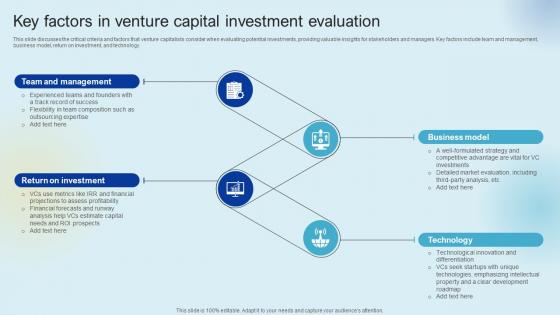
Key Factors In Venture Capital Investment Raising Venture Capital A Holistic Approach Fin SS V
This slide discusses the critical criteria and factors that venture capitalists consider when evaluating potential investments, providing valuable insights for stakeholders and managers. Key factors include team and management, business model, return on investment, and technology. Formulating a presentation can take up a lot of effort and time, so the content and message should always be the primary focus. The visuals of the PowerPoint can enhance the presenters message, so our Key Factors In Venture Capital Investment Raising Venture Capital A Holistic Approach Fin SS V was created to help save time. Instead of worrying about the design, the presenter can concentrate on the message while our designers work on creating the ideal templates for whatever situation is needed. Slidegeeks has experts for everything from amazing designs to valuable content, we have put everything into Key Factors In Venture Capital Investment Raising Venture Capital A Holistic Approach Fin SS V This slide discusses the critical criteria and factors that venture capitalists consider when evaluating potential investments, providing valuable insights for stakeholders and managers. Key factors include team and management, business model, return on investment, and technology.
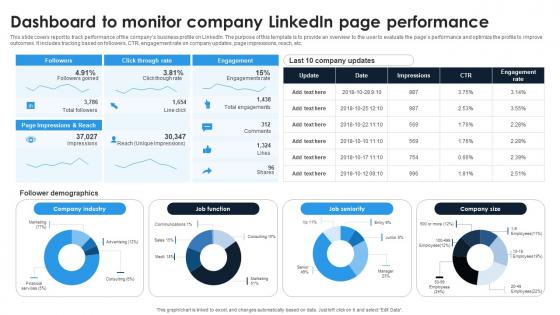
Linkedin Content Strategies Dashboard To Monitor Company Linkedin Page MKT SS V
This slide covers report to track performance of the compans business profile on LinkedIn. The purpose of this template is to provide an overview to the user to evaluate the pages performance and optimize the profile to improve outcomes. It includes tracking based on followers, CTR, engagement rate on company updates, page impressions, reach, etc. Slidegeeks is here to make your presentations a breeze with Linkedin Content Strategies Dashboard To Monitor Company Linkedin Page MKT SS V With our easy-to-use and customizable templates, you can focus on delivering your ideas rather than worrying about formatting. With a variety of designs to choose from, you are sure to find one that suits your needs. And with animations and unique photos, illustrations, and fonts, you can make your presentation pop. So whether you are giving a sales pitch or presenting to the board, make sure to check out Slidegeeks first This slide covers report to track performance of the compans business profile on LinkedIn. The purpose of this template is to provide an overview to the user to evaluate the pages performance and optimize the profile to improve outcomes. It includes tracking based on followers, CTR, engagement rate on company updates, page impressions, reach, etc.
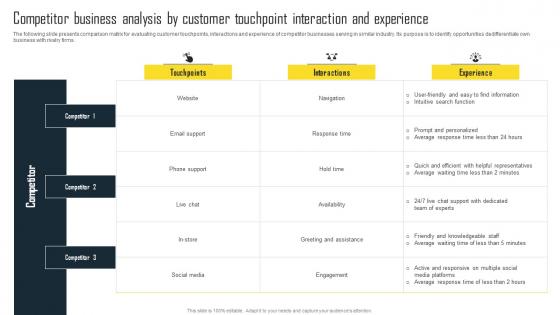
Competitor Business Analysis By Customer Efficient Plan For Conducting Competitor Template Pdf
The following slide presents comparison matrix for evaluating customer touchpoints, interactions and experience of competitor businesses serving in similar industry. Its purpose is to identify opportunities dedifferentiate own business with rivalry firms. Formulating a presentation can take up a lot of effort and time, so the content and message should always be the primary focus. The visuals of the PowerPoint can enhance the presenters message, so our Competitor Business Analysis By Customer Efficient Plan For Conducting Competitor Template Pdf was created to help save time. Instead of worrying about the design, the presenter can concentrate on the message while our designers work on creating the ideal templates for whatever situation is needed. Slidegeeks has experts for everything from amazing designs to valuable content, we have put everything into Competitor Business Analysis By Customer Efficient Plan For Conducting Competitor Template Pdf The following slide presents comparison matrix for evaluating customer touchpoints, interactions and experience of competitor businesses serving in similar industry. Its purpose is to identify opportunities dedifferentiate own business with rivalry firms.
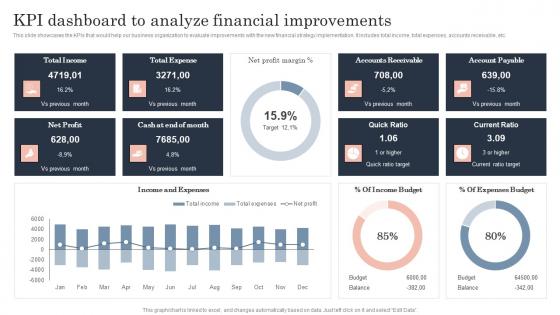
Kpi Dashboard To Analyze Financial Guide To Corporate Financial Growth Plan Designs Pdf
This slide showcases the KPIs that would help our business organization to evaluate improvements with the new financial strategy implementation. It includes total income, total expenses, accounts receivable, etc.Presenting this PowerPoint presentation, titled Kpi Dashboard To Analyze Financial Guide To Corporate Financial Growth Plan Designs Pdf, with topics curated by our researchers after extensive research. This editable presentation is available for immediate download and provides attractive features when used. Download now and captivate your audience. Presenting this Kpi Dashboard To Analyze Financial Guide To Corporate Financial Growth Plan Designs Pdf. Our researchers have carefully researched and created these slides with all aspects taken into consideration. This is a completely customizable Kpi Dashboard To Analyze Financial Guide To Corporate Financial Growth Plan Designs Pdf that is available for immediate downloading. Download now and make an impact on your audience. Highlight the attractive features available with our PPTs. This slide showcases the KPIs that would help our business organization to evaluate improvements with the new financial strategy implementation. It includes total income, total expenses, accounts receivable, etc.
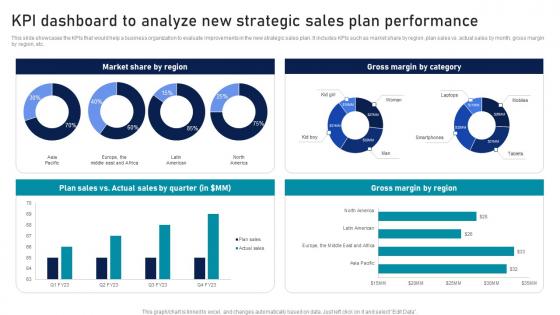
KPI Dashboard To Analyze New Strategic Sales Plan Strategic Sales Plan To Enhance Ideas Pdf
This slide showcases the KPIs that would help a business organization to evaluate improvements in the new strategic sales plan. It includes KPIs such as market share by region, plan sales vs. actual sales by month, gross margin by region, etc. Explore a selection of the finest KPI Dashboard To Analyze New Strategic Sales Plan Strategic Sales Plan To Enhance Ideas Pdf here. With a plethora of professionally designed and pre-made slide templates, you can quickly and easily find the right one for your upcoming presentation. You can use our KPI Dashboard To Analyze New Strategic Sales Plan Strategic Sales Plan To Enhance Ideas Pdf to effectively convey your message to a wider audience. Slidegeeks has done a lot of research before preparing these presentation templates. The content can be personalized and the slides are highly editable. Grab templates today from Slidegeeks. This slide showcases the KPIs that would help a business organization to evaluate improvements in the new strategic sales plan. It includes KPIs such as market share by region, plan sales vs. actual sales by month, gross margin by region, etc.
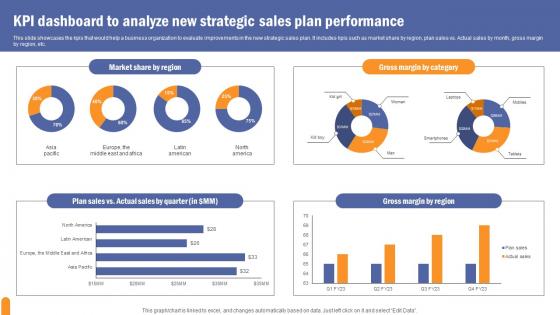
KPI Dashboard To Analyze Developing Extensive Sales And Operations Strategy Slides Pdf
This slide showcases the kpis that would help a business organization to evaluate improvements in the new strategic sales plan. It includes kpis such as market share by region, plan sales vs. Actual sales by month, gross margin by region, etc. Explore a selection of the finest KPI Dashboard To Analyze Developing Extensive Sales And Operations Strategy Slides Pdf here. With a plethora of professionally designed and pre made slide templates, you can quickly and easily find the right one for your upcoming presentation. You can use our KPI Dashboard To Analyze Developing Extensive Sales And Operations Strategy Slides Pdf to effectively convey your message to a wider audience. Slidegeeks has done a lot of research before preparing these presentation templates. The content can be personalized and the slides are highly editable. Grab templates today from Slidegeeks. This slide showcases the kpis that would help a business organization to evaluate improvements in the new strategic sales plan. It includes kpis such as market share by region, plan sales vs. Actual sales by month, gross margin by region, etc.
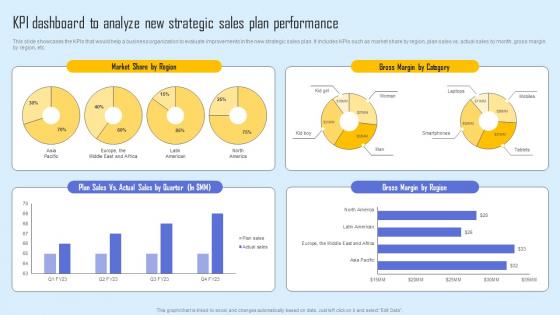
KPI Dashboard Analyze New Effective Sales Strategy To Enhance Customer Retention Background Pdf
This slide showcases the KPIs that would help a business organization to evaluate improvements in the new strategic sales plan. It includes KPIs such as market share by region, plan sales vs. actual sales by month, gross margin by region, etc. Explore a selection of the finest KPI Dashboard Analyze New Effective Sales Strategy To Enhance Customer Retention Background Pdf here. With a plethora of professionally designed and pre made slide templates, you can quickly and easily find the right one for your upcoming presentation. You can use our KPI Dashboard Analyze New Effective Sales Strategy To Enhance Customer Retention Background Pdf to effectively convey your message to a wider audience. Slidegeeks has done a lot of research before preparing these presentation templates. The content can be personalized and the slides are highly editable. Grab templates today from Slidegeeks. This slide showcases the KPIs that would help a business organization to evaluate improvements in the new strategic sales plan. It includes KPIs such as market share by region, plan sales vs. actual sales by month, gross margin by region, etc.
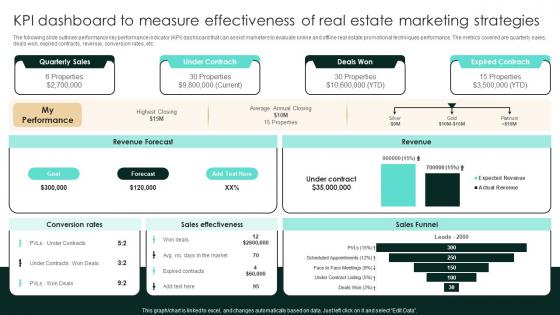
KPI Dashboard To Measure Effectiveness Of Real Estate Marketing Strategic Real Estate Structure Pdf
The following slide outlines performance key performance indicator KPI dashboard that can assist marketers to evaluate online and offline real estate promotional techniques performance. The metrics covered are quarterly sales, deals won, expired contracts, revenue, conversion rates, etc. Here you can discover an assortment of the finest PowerPoint and Google Slides templates. With these templates, you can create presentations for a variety of purposes while simultaneously providing your audience with an eye-catching visual experience. Download KPI Dashboard To Measure Effectiveness Of Real Estate Marketing Strategic Real Estate Structure Pdf to deliver an impeccable presentation. These templates will make your job of preparing presentations much quicker, yet still, maintain a high level of quality. Slidegeeks has experienced researchers who prepare these templates and write high-quality content for you. Later on, you can personalize the content by editing the KPI Dashboard To Measure Effectiveness Of Real Estate Marketing Strategic Real Estate Structure Pdf The following slide outlines performance key performance indicator KPI dashboard that can assist marketers to evaluate online and offline real estate promotional techniques performance. The metrics covered are quarterly sales, deals won, expired contracts, revenue, conversion rates, etc.
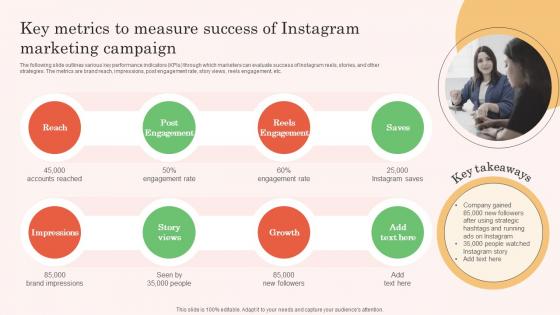
Key Metrics To Measure Success Of Instagram Real Estate Property Marketing Microsoft Pdf
The following slide outlines various key performance indicators KPIs through which marketers can evaluate success of Instagram reels, stories, and other strategies. The metrics are brand reach, impressions, post engagement rate, story views, reels engagement, etc.Presenting this PowerPoint presentation, titled Key Metrics To Measure Success Of Instagram Real Estate Property Marketing Microsoft Pdf, with topics curated by our researchers after extensive research. This editable presentation is available for immediate download and provides attractive features when used. Download now and captivate your audience. Presenting this Key Metrics To Measure Success Of Instagram Real Estate Property Marketing Microsoft Pdf. Our researchers have carefully researched and created these slides with all aspects taken into consideration. This is a completely customizable Key Metrics To Measure Success Of Instagram Real Estate Property Marketing Microsoft Pdf that is available for immediate downloading. Download now and make an impact on your audience. Highlight the attractive features available with our PPTs. The following slide outlines various key performance indicators KPIs through which marketers can evaluate success of Instagram reels, stories, and other strategies. The metrics are brand reach, impressions, post engagement rate, story views, reels engagement, etc.
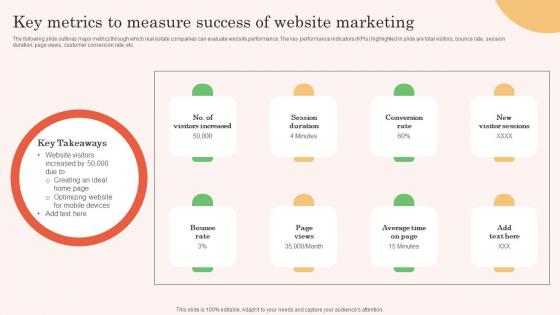
Key Metrics To Measure Success Of Website Marketing Real Estate Property Marketing Slides Pdf
The following slide outlines major metrics through which real estate companies can evaluate website performance. The key performance indicators KPIs highlighted in slide are total visitors, bounce rate, session duration, page views, customer conversion rate, etc.This Key Metrics To Measure Success Of Website Marketing Real Estate Property Marketing Slides Pdf from Slidegeeks makes it easy to present information on your topic with precision. It provides customization options, so you can make changes to the colors, design, graphics, or any other component to create a unique layout. It is also available for immediate download, so you can begin using it right away. Slidegeeks has done good research to ensure that you have everything you need to make your presentation stand out. Make a name out there for a brilliant performance. The following slide outlines major metrics through which real estate companies can evaluate website performance. The key performance indicators KPIs highlighted in slide are total visitors, bounce rate, session duration, page views, customer conversion rate, etc.
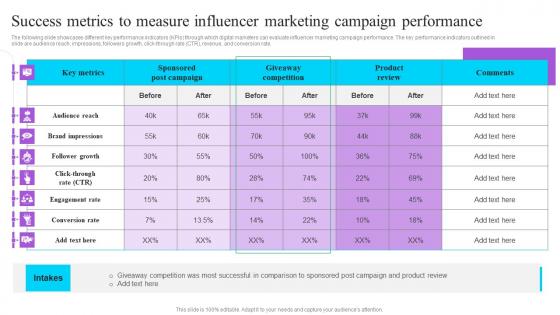
Success Metrics To Measure Influencer Marketing Campaign Performance Effective GTM Techniques Summary PDF
The following slide showcases different key performance indicators KPIs through which digital marketers can evaluate influencer marketing campaign performance. The key performance indicators outlined in slide are audience reach, impressions, followers growth, click-through rate CTR, revenue, and conversion rate. Present like a pro with Success Metrics To Measure Influencer Marketing Campaign Performance Effective GTM Techniques Summary PDF Create beautiful presentations together with your team, using our easy-to-use presentation slides. Share your ideas in real-time and make changes on the fly by downloading our templates. So whether you are in the office, on the go, or in a remote location, you can stay in sync with your team and present your ideas with confidence. With Slidegeeks presentation got a whole lot easier. Grab these presentations today. The following slide showcases different key performance indicators KPIs through which digital marketers can evaluate influencer marketing campaign performance. The key performance indicators outlined in slide are audience reach, impressions, followers growth, click-through rate CTR, revenue, and conversion rate.
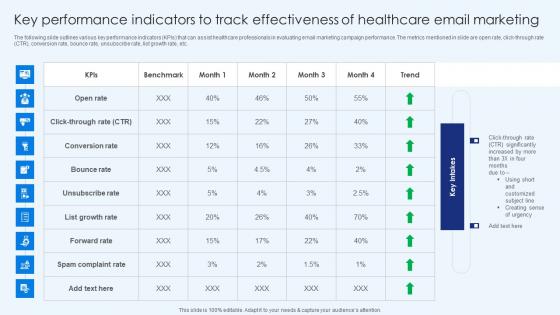
Key Performance Indicators To Track Effectiveness Of Healthcare Promotion Download Pdf
The following slide outlines various key performance indicators KPIs that can assist healthcare professionals in evaluating email marketing campaign performance. The metrics mentioned in slide are open rate, click-through rate CTR, conversion rate, bounce rate, unsubscribe rate, list growth rate, etc. Retrieve professionally designed Key Performance Indicators To Track Effectiveness Of Healthcare Promotion Download Pdf to effectively convey your message and captivate your listeners. Save time by selecting pre-made slideshows that are appropriate for various topics, from business to educational purposes. These themes come in many different styles, from creative to corporate, and all of them are easily adjustable and can be edited quickly. Access them as PowerPoint templates or as Google Slides themes. You do not have to go on a hunt for the perfect presentation because Slidegeeks got you covered from everywhere. The following slide outlines various key performance indicators KPIs that can assist healthcare professionals in evaluating email marketing campaign performance. The metrics mentioned in slide are open rate, click-through rate CTR, conversion rate, bounce rate, unsubscribe rate, list growth rate, etc.
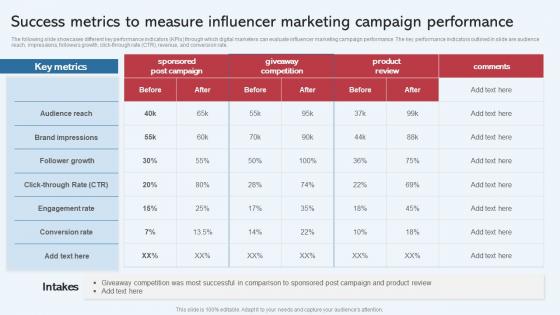
Success Metrics To Measure Influencer Marketing Campaign Effective Startup Promotion Plan Slides Pdf
The following slide showcases different key performance indicators KPIs through which digital marketers can evaluate influencer marketing campaign performance. The key performance indicators outlined in slide are audience reach, impressions, followers growth, click through rate CTR, revenue, and conversion rate. Present like a pro with Success Metrics To Measure Influencer Marketing Campaign Effective Startup Promotion Plan Slides Pdf Create beautiful presentations together with your team, using our easy to use presentation slides. Share your ideas in real time and make changes on the fly by downloading our templates. So whether you are in the office, on the go, or in a remote location, you can stay in sync with your team and present your ideas with confidence. With Slidegeeks presentation got a whole lot easier. Grab these presentations today. The following slide showcases different key performance indicators KPIs through which digital marketers can evaluate influencer marketing campaign performance. The key performance indicators outlined in slide are audience reach, impressions, followers growth, click through rate CTR, revenue, and conversion rate.
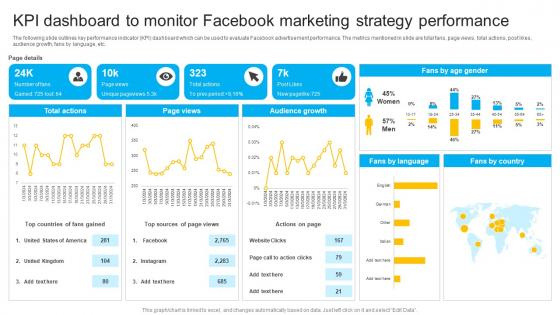
How To Create Cost Effective KPI Dashboard To Monitor Facebook Marketing Strategy SS V
The following slide outlines key performance indicator KPI dashboard which can be used to evaluate Facebook advertisement performance. The metrics mentioned in slide are total fans, page views, total actions, post likes, audience growth, fans by language, etc. Do you know about Slidesgeeks How To Create Cost Effective KPI Dashboard To Monitor Facebook Marketing Strategy SS V These are perfect for delivering any kind od presentation. Using it, create PowerPoint presentations that communicate your ideas and engage audiences. Save time and effort by using our pre-designed presentation templates that are perfect for a wide range of topic. Our vast selection of designs covers a range of styles, from creative to business, and are all highly customizable and easy to edit. Download as a PowerPoint template or use them as Google Slides themes. The following slide outlines key performance indicator KPI dashboard which can be used to evaluate Facebook advertisement performance. The metrics mentioned in slide are total fans, page views, total actions, post likes, audience growth, fans by language, etc.
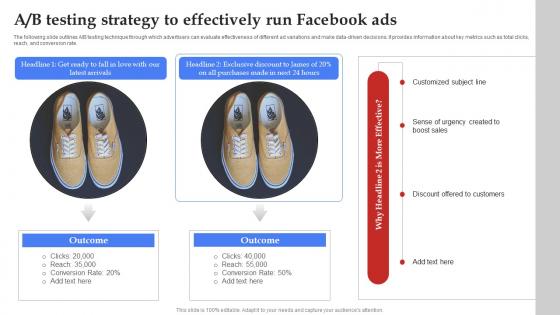
Facebook Marketing Plan A B Testing Strategy To Effectively Run Facebook Ads Strategy SS V

Facebook Marketing Techniques A B Testing Strategy To Effectively Run Facebook Strategy SS V
The following slide outlines A or B testing technique through which advertisers can evaluate effectiveness of different ad variations and make data-driven decisions. It provides information about key metrics such as total clicks, reach, and conversion rate. Do you have to make sure that everyone on your team knows about any specific topic I yes, then you should give Facebook Marketing Techniques A B Testing Strategy To Effectively Run Facebook Strategy SS V a try. Our experts have put a lot of knowledge and effort into creating this impeccable Facebook Marketing Techniques A B Testing Strategy To Effectively Run Facebook Strategy SS V. You can use this template for your upcoming presentations, as the slides are perfect to represent even the tiniest detail. You can download these templates from the Slidegeeks website and these are easy to edit. So grab these today The following slide outlines A or B testing technique through which advertisers can evaluate effectiveness of different ad variations and make data-driven decisions. It provides information about key metrics such as total clicks, reach, and conversion rate.
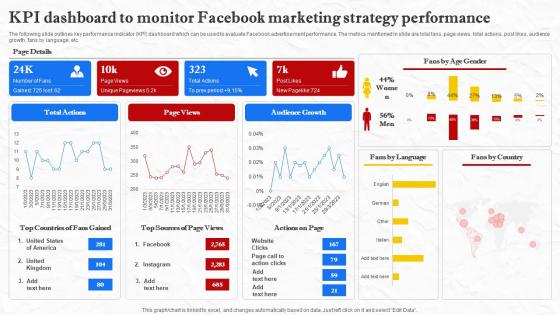
Facebook Marketing Techniques KPI Dashboard To Monitor Facebook Marketing Strategy SS V
The following slide outlines key performance indicator KPI dashboard which can be used to evaluate Facebook advertisement performance. The metrics mentioned in slide are total fans, page views, total actions, post likes, audience growth, fans by language, etc. Do you know about Slidesgeeks Facebook Marketing Techniques KPI Dashboard To Monitor Facebook Marketing Strategy SS V These are perfect for delivering any kind od presentation. Using it, create PowerPoint presentations that communicate your ideas and engage audiences. Save time and effort by using our pre-designed presentation templates that are perfect for a wide range of topic. Our vast selection of designs covers a range of styles, from creative to business, and are all highly customizable and easy to edit. Download as a PowerPoint template or use them as Google Slides themes. The following slide outlines key performance indicator KPI dashboard which can be used to evaluate Facebook advertisement performance. The metrics mentioned in slide are total fans, page views, total actions, post likes, audience growth, fans by language, etc.

Why Businesses Fall Victim To Phishing Man In The Middle Phishing IT
This slide outlines the various reasons responsible for businesses to fall victim to different phishing attacks. These include inadequate employee training, never evaluate the success of the training, careless browsing habits of the employees, etc. Presenting this PowerPoint presentation, titled Why Businesses Fall Victim To Phishing Man In The Middle Phishing IT, with topics curated by our researchers after extensive research. This editable presentation is available for immediate download and provides attractive features when used. Download now and captivate your audience. Presenting this Why Businesses Fall Victim To Phishing Man In The Middle Phishing IT. Our researchers have carefully researched and created these slides with all aspects taken into consideration. This is a completely customizable Why Businesses Fall Victim To Phishing Man In The Middle Phishing IT that is available for immediate downloading. Download now and make an impact on your audience. Highlight the attractive features available with our PPTs. This slide outlines the various reasons responsible for businesses to fall victim to different phishing attacks. These include inadequate employee training, never evaluate the success of the training, careless browsing habits of the employees, etc.
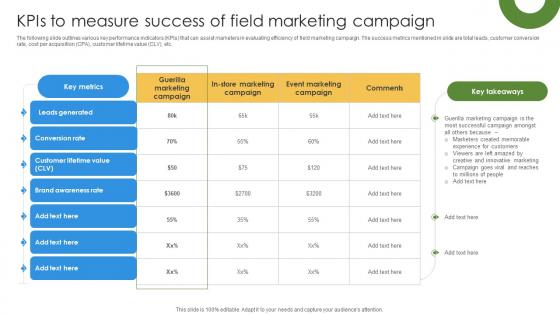
Marketing Growth Strategy Kpis To Measure Success Of Field Marketing Campaign Strategy SS V
The following slide outlines various key performance indicators KPIs that can assist marketers in evaluating efficiency of field marketing campaign. The success metrics mentioned in slide are total leads, customer conversion rate, cost per acquisition CPA, customer lifetime value CLV, etc. Welcome to our selection of the Marketing Growth Strategy Kpis To Measure Success Of Field Marketing Campaign Strategy SS V. These are designed to help you showcase your creativity and bring your sphere to life. Planning and Innovation are essential for any business that is just starting out. This collection contains the designs that you need for your everyday presentations. All of our PowerPoints are 100Percent editable, so you can customize them to suit your needs. This multi-purpose template can be used in various situations. Grab these presentation templates today. The following slide outlines various key performance indicators KPIs that can assist marketers in evaluating efficiency of field marketing campaign. The success metrics mentioned in slide are total leads, customer conversion rate, cost per acquisition CPA, customer lifetime value CLV, etc.

Use Case Of Autonomous Robots In Quality Implementing Scale AI PPT Presentation AI SS V
The following slide outlines use case of autonomous machines in product testing. Information covered in this slide is related to quality inspection such as identifying defects in products, evaluating product dimensions, assembly inspection, and raw material inspection. This Use Case Of Autonomous Robots In Quality Implementing Scale AI PPT Presentation AI SS V from Slidegeeks makes it easy to present information on your topic with precision. It provides customization options, so you can make changes to the colors, design, graphics, or any other component to create a unique layout. It is also available for immediate download, so you can begin using it right away. Slidegeeks has done good research to ensure that you have everything you need to make your presentation stand out. Make a name out there for a brilliant performance. The following slide outlines use case of autonomous machines in product testing. Information covered in this slide is related to quality inspection such as identifying defects in products, evaluating product dimensions, assembly inspection, and raw material inspection.
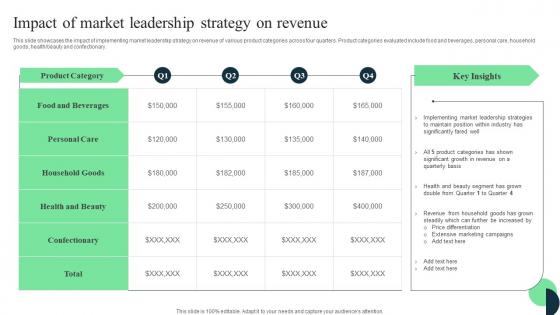
Market Leaders Guide To Influence Impact Of Market Leadership Strategy On Revenue Themes Pdf
This slide showcases the impact of implementing market leadership strategy on revenue of various product categories across four quarters. Product categories evaluated include food and beverages, personal care, household goods, health or beauty and confectionary. Are you in need of a template that can accommodate all of your creative concepts This one is crafted professionally and can be altered to fit any style. Use it with Google Slides or PowerPoint. Include striking photographs, symbols, depictions, and other visuals. Fill, move around, or remove text boxes as desired. Test out color palettes and font mixtures. Edit and save your work, or work with colleagues. Download Market Leaders Guide To Influence Impact Of Market Leadership Strategy On Revenue Themes Pdf and observe how to make your presentation outstanding. Give an impeccable presentation to your group and make your presentation unforgettable. This slide showcases the impact of implementing market leadership strategy on revenue of various product categories across four quarters. Product categories evaluated include food and beverages, personal care, household goods, health or beauty and confectionary.
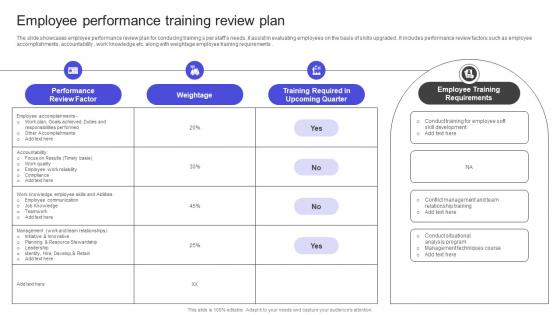
Strategies To Build Meaningful Employee Performance Training Review Plan Portrait PDF
The slide showcases employee performance review plan for conducing training s per staffs needs, it assist in evaluating employees on the basis of skills upgraded . It includes performance review factors such as employee accomplishments, accountability , work knowledge etc. along with weightage employee training requirements . Slidegeeks is here to make your presentations a breeze with Strategies To Build Meaningful Employee Performance Training Review Plan Portrait PDF With our easy-to-use and customizable templates, you can focus on delivering your ideas rather than worrying about formatting. With a variety of designs to choose from, you are sure to find one that suits your needs. And with animations and unique photos, illustrations, and fonts, you can make your presentation pop. So whether you are giving a sales pitch or presenting to the board, make sure to check out Slidegeeks first The slide showcases employee performance review plan for conducing training s per staffs needs, it assist in evaluating employees on the basis of skills upgraded . It includes performance review factors such as employee accomplishments, accountability , work knowledge etc. along with weightage employee training requirements .
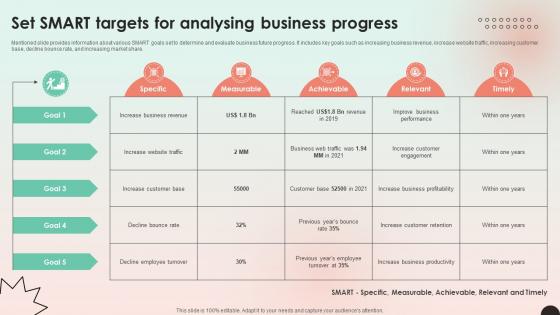
Web Consulting Business Set Smart Targets For Analysing Business Progress
Mentioned slide provides information about various SMART goals set to determine and evaluate business future progress. It includes key goals such as increasing business revenue, increase website traffic, increasing customer base, decline bounce rate, and increasing market share. Are you in need of a template that can accommodate all of your creative concepts This one is crafted professionally and can be altered to fit any style. Use it with Google Slides or PowerPoint. Include striking photographs, symbols, depictions, and other visuals. Fill, move around, or remove text boxes as desired. Test out color palettes and font mixtures. Edit and save your work, or work with colleagues. Download Web Consulting Business Set Smart Targets For Analysing Business Progress and observe how to make your presentation outstanding. Give an impeccable presentation to your group and make your presentation unforgettable. Mentioned slide provides information about various SMART goals set to determine and evaluate business future progress. It includes key goals such as increasing business revenue, increase website traffic, increasing customer base, decline bounce rate, and increasing market share.
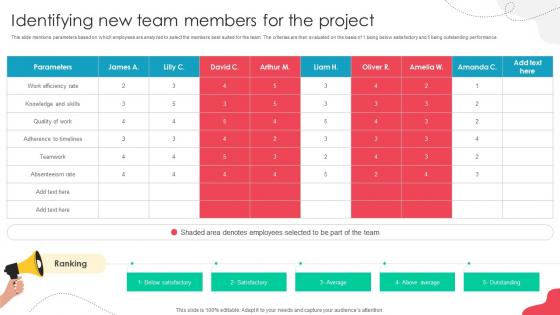
Unlocking Potential Enhancing Identifying New Team Members For The Project
This slide mentions parameters based on which employees are analyzed to select the members best suited for the team. The criterias are then evaluated on the basis of 1 being below satisfactory and 5 being outstanding performance. Are you in need of a template that can accommodate all of your creative concepts This one is crafted professionally and can be altered to fit any style. Use it with Google Slides or PowerPoint. Include striking photographs, symbols, depictions, and other visuals. Fill, move around, or remove text boxes as desired. Test out color palettes and font mixtures. Edit and save your work, or work with colleagues. Download Unlocking Potential Enhancing Identifying New Team Members For The Project and observe how to make your presentation outstanding. Give an impeccable presentation to your group and make your presentation unforgettable. This slide mentions parameters based on which employees are analyzed to select the members best suited for the team. The criterias are then evaluated on the basis of 1 being below satisfactory and 5 being outstanding performance.
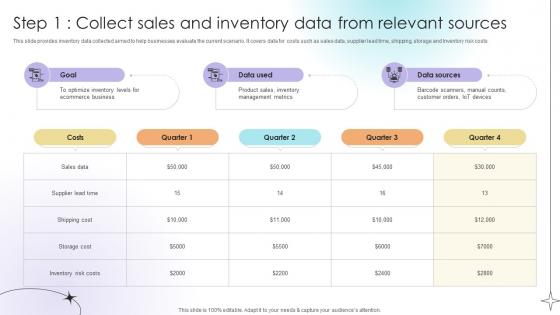
Step 1 Collect Sales And Inventory Data From Relevant Sources Data Analytics SS V
This slide provides inventory data collected aimed to help businesses evaluate the current scenario. It covers data for costs such as sales data, supplier lead time, shipping, storage and Inventory risk costs.Are you in need of a template that can accommodate all of your creative concepts This one is crafted professionally and can be altered to fit any style. Use it with Google Slides or PowerPoint. Include striking photographs, symbols, depictions, and other visuals. Fill, move around, or remove text boxes as desired. Test out color palettes and font mixtures. Edit and save your work, or work with colleagues. Download Step 1 Collect Sales And Inventory Data From Relevant Sources Data Analytics SS V and observe how to make your presentation outstanding. Give an impeccable presentation to your group and make your presentation unforgettable. This slide provides inventory data collected aimed to help businesses evaluate the current scenario. It covers data for costs such as sales data, supplier lead time, shipping, storage and Inventory risk costs.
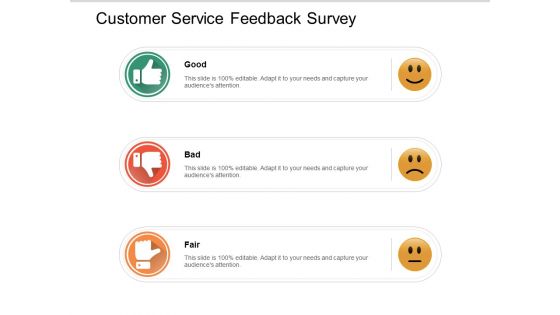
Customer Service Feedback Survey Ppt PowerPoint Presentation Outline Background Image
Presenting this set of slides with name customer service feedback survey ppt powerpoint presentation outline background image. This is a three stage process. The stages in this process are product quality, product improvement, rating scale. This is a completely editable PowerPoint presentation and is available for immediate download. Download now and impress your audience.

Calculating Return On Investment Of Performance Marketing Paid Internet Marketing Strategy Ideas Pdf
This slide showcases calculation of advertisement returns which can help organization to evaluate the results of performance marketing campaign and optimize budget accordingly. Its key elements are cost per click, number of clicks, leads generated, revenue generated etc. Do you have to make sure that everyone on your team knows about any specific topic I yes, then you should give Calculating Return On Investment Of Performance Marketing Paid Internet Marketing Strategy Ideas Pdf a try. Our experts have put a lot of knowledge and effort into creating this impeccable Calculating Return On Investment Of Performance Marketing Paid Internet Marketing Strategy Ideas Pdf. You can use this template for your upcoming presentations, as the slides are perfect to represent even the tiniest detail. You can download these templates from the Slidegeeks website and these are easy to edit. So grab these today. This slide showcases calculation of advertisement returns which can help organization to evaluate the results of performance marketing campaign and optimize budget accordingly. Its key elements are cost per click, number of clicks, leads generated, revenue generated etc.
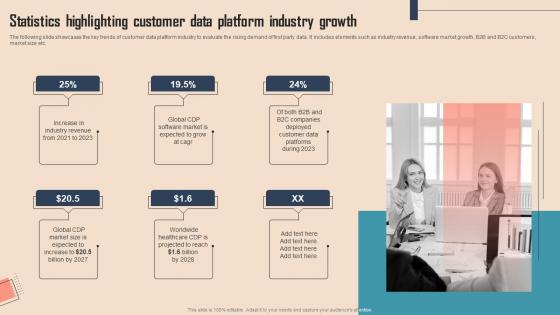
Statistics Highlighting Customer Data Platform Comprehensive CDP Guide For Promoters Topics Pdf
The following slide showcases the key trends of customer data platform industry to evaluate the rising demand of first party data. It includes elements such as industry revenue, software market growth, B2B and B2C customers, market size etc.Presenting this PowerPoint presentation, titled Statistics Highlighting Customer Data Platform Comprehensive CDP Guide For Promoters Topics Pdf, with topics curated by our researchers after extensive research. This editable presentation is available for immediate download and provides attractive features when used. Download now and captivate your audience. Presenting this Statistics Highlighting Customer Data Platform Comprehensive CDP Guide For Promoters Topics Pdf. Our researchers have carefully researched and created these slides with all aspects taken into consideration. This is a completely customizable Statistics Highlighting Customer Data Platform Comprehensive CDP Guide For Promoters Topics Pdf that is available for immediate downloading. Download now and make an impact on your audience. Highlight the attractive features available with our PPTs. The following slide showcases the key trends of customer data platform industry to evaluate the rising demand of first party data. It includes elements such as industry revenue, software market growth, B2B and B2C customers, market size etc.
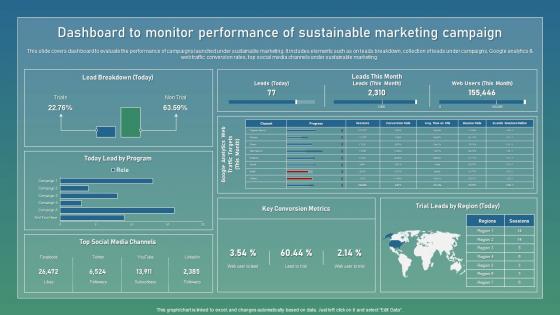
Dashboard To Monitor Performance Strategic Guide For Sustainable Download Pdf
This slide covers dashboard to evaluate the performance of campaigns launched under sustainable marketing. It includes elements such as on leads breakdown, collection of leads under campaigns, Google analytics and web traffic conversion rates, top social media channels under sustainable marketing. Whether you have daily or monthly meetings, a brilliant presentation is necessary. Dashboard To Monitor Performance Strategic Guide For Sustainable Download Pdf can be your best option for delivering a presentation. Represent everything in detail using Dashboard To Monitor Performance Strategic Guide For Sustainable Download Pdf and make yourself stand out in meetings. The template is versatile and follows a structure that will cater to your requirements. All the templates prepared by Slidegeeks are easy to download and edit. Our research experts have taken care of the corporate themes as well. So, give it a try and see the results. This slide covers dashboard to evaluate the performance of campaigns launched under sustainable marketing. It includes elements such as on leads breakdown, collection of leads under campaigns, Google analytics and web traffic conversion rates, top social media channels under sustainable marketing.
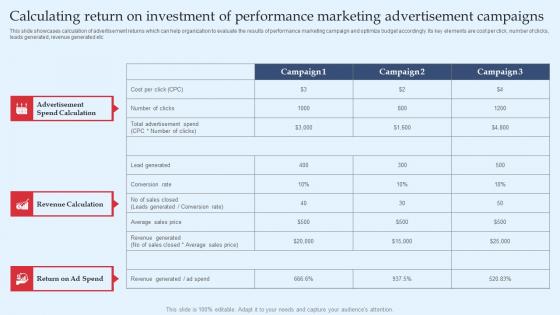
Strategic Performance Marketing Campaign Calculating Return On Investment Download Pdf
This slide showcases calculation of advertisement returns which can help organization to evaluate the results of performance marketing campaign and optimize budget accordingly. Its key elements are cost per click, number of clicks, leads generated, revenue generated etc. Whether you have daily or monthly meetings, a brilliant presentation is necessary. Strategic Performance Marketing Campaign Calculating Return On Investment Download Pdf can be your best option for delivering a presentation. Represent everything in detail using Strategic Performance Marketing Campaign Calculating Return On Investment Download Pdf and make yourself stand out in meetings. The template is versatile and follows a structure that will cater to your requirements. All the templates prepared by Slidegeeks are easy to download and edit. Our research experts have taken care of the corporate themes as well. So, give it a try and see the results. This slide showcases calculation of advertisement returns which can help organization to evaluate the results of performance marketing campaign and optimize budget accordingly. Its key elements are cost per click, number of clicks, leads generated, revenue generated etc.
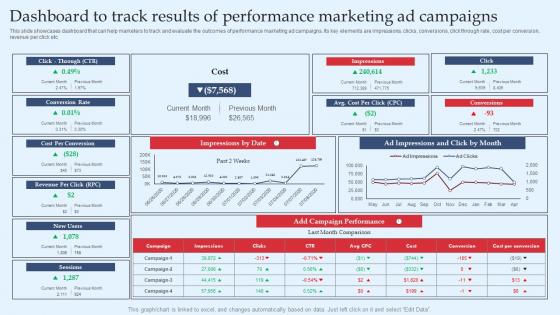
Strategic Performance Marketing Campaign Dashboard To Track Results Of Performance Inspiration Pdf
This slide showcases dashboard that can help marketers to track and evaluate the outcomes of performance marketing ad campaigns. Its key elements are impressions, clicks, conversions, click through rate, cost per conversion, revenue per click etc. Crafting an eye-catching presentation has never been more straightforward. Let your presentation shine with this tasteful yet straightforward Strategic Performance Marketing Campaign Dashboard To Track Results Of Performance Inspiration Pdf template. It offers a minimalistic and classy look that is great for making a statement. The colors have been employed intelligently to add a bit of playfulness while still remaining professional. Construct the ideal Strategic Performance Marketing Campaign Dashboard To Track Results Of Performance Inspiration Pdf that effortlessly grabs the attention of your audience. Begin now and be certain to wow your customers. This slide showcases dashboard that can help marketers to track and evaluate the outcomes of performance marketing ad campaigns. Its key elements are impressions, clicks, conversions, click through rate, cost per conversion, revenue per click etc.
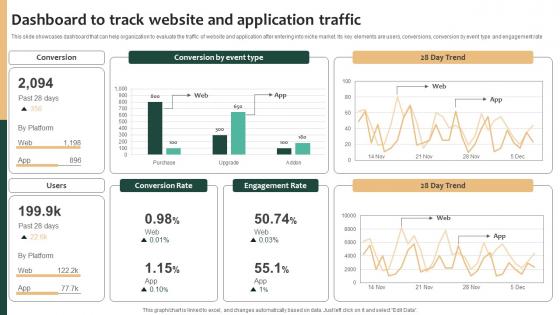
Tailored Product Approach Dashboard To Track Website And Application Traffic Structure Pdf
This slide showcases dashboard that can help organization to evaluate the traffic of website and application after entering into niche market. Its key elements are users, conversions, conversion by event type and engagement rate. Do you have to make sure that everyone on your team knows about any specific topic I yes, then you should give Tailored Product Approach Dashboard To Track Website And Application Traffic Structure Pdf a try. Our experts have put a lot of knowledge and effort into creating this impeccable Tailored Product Approach Dashboard To Track Website And Application Traffic Structure Pdf You can use this template for your upcoming presentations, as the slides are perfect to represent even the tiniest detail. You can download these templates from the Slidegeeks website and these are easy to edit. So grab these today This slide showcases dashboard that can help organization to evaluate the traffic of website and application after entering into niche market. Its key elements are users, conversions, conversion by event type and engagement rate
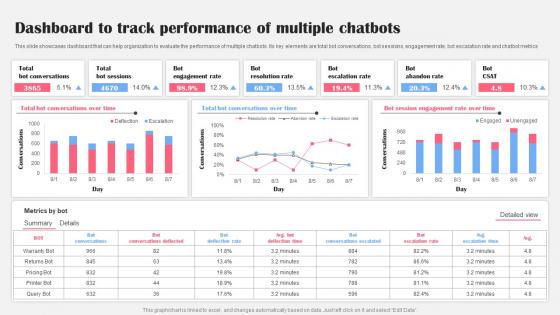
Dashboard To Track Performance Multiple AI Bot Application For Various Industries Demonstration Pdf
This slide showcases dashboard that can help organization to evaluate the performance of multiple chatbots. Its key elements are total bot conversations, bot sessions, engagement rate, bot escalation rate and chatbot metrics Are you searching for a Dashboard To Track Performance Multiple AI Bot Application For Various Industries Demonstration Pdf that is uncluttered, straightforward, and original Its easy to edit, and you can change the colors to suit your personal or business branding. For a presentation that expresses how much effort you have put in, this template is ideal With all of its features, including tables, diagrams, statistics, and lists, its perfect for a business plan presentation. Make your ideas more appealing with these professional slides. Download Dashboard To Track Performance Multiple AI Bot Application For Various Industries Demonstration Pdf from Slidegeeks today. This slide showcases dashboard that can help organization to evaluate the performance of multiple chatbots. Its key elements are total bot conversations, bot sessions, engagement rate, bot escalation rate and chatbot metrics
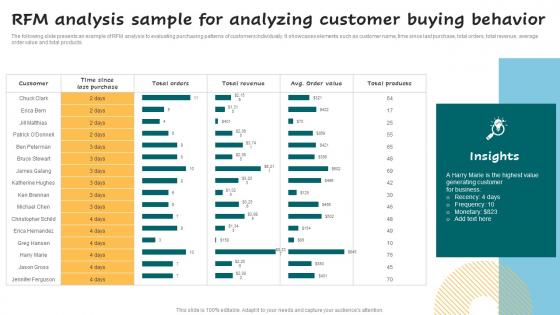
RFM Analysis Sample For Analyzing Customer Buying Successful Guide For Market Segmentation Topics Pdf
The following slide presents an example of RFM analysis to evaluating purchasing patterns of customers individually. It showcases elements such as customer name, time since last purchase, total orders, total revenue, average order value and total products. Whether you have daily or monthly meetings, a brilliant presentation is necessary. RFM Analysis Sample For Analyzing Customer Buying Successful Guide For Market Segmentation Topics Pdf can be your best option for delivering a presentation. Represent everything in detail using RFM Analysis Sample For Analyzing Customer Buying Successful Guide For Market Segmentation Topics Pdf and make yourself stand out in meetings. The template is versatile and follows a structure that will cater to your requirements. All the templates prepared by Slidegeeks are easy to download and edit. Our research experts have taken care of the corporate themes as well. So, give it a try and see the results. The following slide presents an example of RFM analysis to evaluating purchasing patterns of customers individually. It showcases elements such as customer name, time since last purchase, total orders, total revenue, average order value and total products.
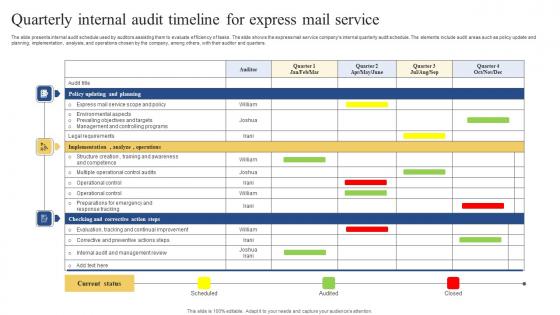
Quarterly Internal Audit Timeline For Express Mail Service Pictures Pdf
The slide presents internal audit schedule used by auditors assisting them to evaluate efficiency of tasks . The slide shows the express mail service companys internal quarterly audit schedule. The elements include audit areas such as policy update and planning, implementation, analysis, and operations chosen by the company, among others, with their auditor and quarters. Pitch your topic with ease and precision using this Quarterly Internal Audit Timeline For Express Mail Service Pictures Pdf. This layout presents information on Policy Updating Planning, Implementation, Analyze, Operations. It is also available for immediate download and adjustment. So, changes can be made in the color, design, graphics or any other component to create a unique layout. The slide presents internal audit schedule used by auditors assisting them to evaluate efficiency of tasks . The slide shows the express mail service companys internal quarterly audit schedule. The elements include audit areas such as policy update and planning, implementation, analysis, and operations chosen by the company, among others, with their auditor and quarters.
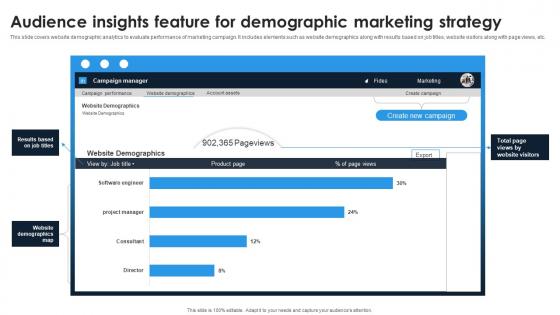
Linkedin Content Strategies Audience Insights Feature For Demographic MKT SS V
This slide covers website demographic analytics to evaluate performance of marketing campaign. It includes elements such as website demographics along with results based on job titles, website visitors along with page views, etc. Do you have to make sure that everyone on your team knows about any specific topic I yes, then you should give Linkedin Content Strategies Audience Insights Feature For Demographic MKT SS V a try. Our experts have put a lot of knowledge and effort into creating this impeccable Linkedin Content Strategies Audience Insights Feature For Demographic MKT SS V. You can use this template for your upcoming presentations, as the slides are perfect to represent even the tiniest detail. You can download these templates from the Slidegeeks website and these are easy to edit. So grab these today This slide covers website demographic analytics to evaluate performance of marketing campaign. It includes elements such as website demographics along with results based on job titles, website visitors along with page views, etc.
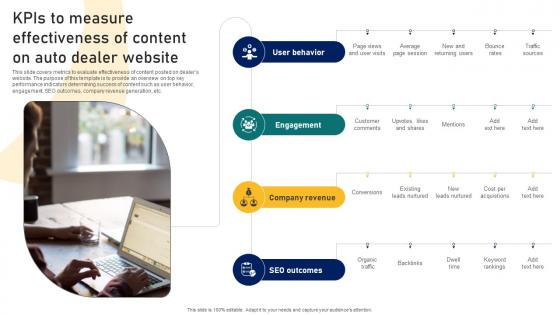
Guide To Building A Successful Kpis To Measure Effectiveness Of Content On Auto Dealer Strategy SS V
This slide covers metrics to evaluate effectiveness of content posted on dealers website. The purpose of this template is to provide an overview on top key performance indicators determining success of content such as user behavior, engagement, SEO outcomes, company revenue generation, etc. The Guide To Building A Successful Kpis To Measure Effectiveness Of Content On Auto Dealer Strategy SS V is a compilation of the most recent design trends as a series of slides. It is suitable for any subject or industry presentation, containing attractive visuals and photo spots for businesses to clearly express their messages. This template contains a variety of slides for the user to input data, such as structures to contrast two elements, bullet points, and slides for written information. Slidegeeks is prepared to create an impression. This slide covers metrics to evaluate effectiveness of content posted on dealers website. The purpose of this template is to provide an overview on top key performance indicators determining success of content such as user behavior, engagement, SEO outcomes, company revenue generation, etc.

Ultimate Guide To Developing Kpis To Measure Effectiveness Of Content On Auto Dealer Strategy SS V
This slide covers metrics to evaluate effectiveness of content posted on dealers website. The purpose of this template is to provide an overview on top key performance indicators determining success of content such as user behavior, engagement, SEO outcomes, company revenue generation, etc. The Ultimate Guide To Developing Kpis To Measure Effectiveness Of Content On Auto Dealer Strategy SS V is a compilation of the most recent design trends as a series of slides. It is suitable for any subject or industry presentation, containing attractive visuals and photo spots for businesses to clearly express their messages. This template contains a variety of slides for the user to input data, such as structures to contrast two elements, bullet points, and slides for written information. Slidegeeks is prepared to create an impression. This slide covers metrics to evaluate effectiveness of content posted on dealers website. The purpose of this template is to provide an overview on top key performance indicators determining success of content such as user behavior, engagement, SEO outcomes, company revenue generation, etc.
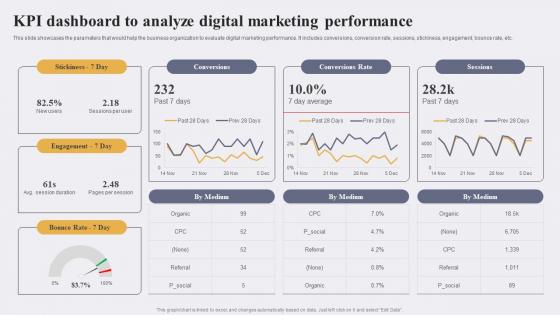
KPI Dashboard To Analyze Digital Marketing Enhancing Conversion Rate By Leveraging Background Pdf
This slide showcases the parameters that would help the business organization to evaluate digital marketing performance. It includes conversions, conversion rate, sessions, stickiness, engagement, bounce rate, etc.If you are looking for a format to display your unique thoughts, then the professionally designed KPI Dashboard To Analyze Digital Marketing Enhancing Conversion Rate By Leveraging Background Pdf is the one for you. You can use it as a Google Slides template or a PowerPoint template. Incorporate impressive visuals, symbols, images, and other charts. Modify or reorganize the text boxes as you desire. Experiment with shade schemes and font pairings. Alter, share or cooperate with other people on your work. Download KPI Dashboard To Analyze Digital Marketing Enhancing Conversion Rate By Leveraging Background Pdf and find out how to give a successful presentation. Present a perfect display to your team and make your presentation unforgettable. This slide showcases the parameters that would help the business organization to evaluate digital marketing performance. It includes conversions, conversion rate, sessions, stickiness, engagement, bounce rate, etc.
Website Traffic Generation For Social Media Referral Tracking Report Word Of Mouth Marketing Icons Pdf
This slide covers tracking sheet to monitor traffic generated on top social media channels such as Facebook, Instagram, twitter and LinkedIn for various company websites to evaluate outcomes of referral program.Formulating a presentation can take up a lot of effort and time, so the content and message should always be the primary focus. The visuals of the PowerPoint can enhance the presenters message, so our Website Traffic Generation For Social Media Referral Tracking Report Word Of Mouth Marketing Icons Pdf was created to help save time. Instead of worrying about the design, the presenter can concentrate on the message while our designers work on creating the ideal templates for whatever situation is needed. Slidegeeks has experts for everything from amazing designs to valuable content, we have put everything into Website Traffic Generation For Social Media Referral Tracking Report Word Of Mouth Marketing Icons Pdf. This slide covers tracking sheet to monitor traffic generated on top social media channels such as Facebook, Instagram, twitter and LinkedIn for various company websites to evaluate outcomes of referral program.
Optimizing Client Lead Handling Inbound Lead Performance Tracking Dashboard Pictures Pdf
This slide covers the KPI dashboard for evaluating inbound lead performance. It includes metrics such as lead to opportunity ratio, opportunity to win ratio, lead conversion ratio, inbound leads, and leads in the sales funnel. If you are looking for a format to display your unique thoughts, then the professionally designed Optimizing Client Lead Handling Inbound Lead Performance Tracking Dashboard Pictures Pdf is the one for you. You can use it as a Google Slides template or a PowerPoint template. Incorporate impressive visuals, symbols, images, and other charts. Modify or reorganize the text boxes as you desire. Experiment with shade schemes and font pairings. Alter, share or cooperate with other people on your work. Download Optimizing Client Lead Handling Inbound Lead Performance Tracking Dashboard Pictures Pdf and find out how to give a successful presentation. Present a perfect display to your team and make your presentation unforgettable. This slide covers the KPI dashboard for evaluating inbound lead performance. It includes metrics such as lead to opportunity ratio, opportunity to win ratio, lead conversion ratio, inbound leads, and leads in the sales funnel.
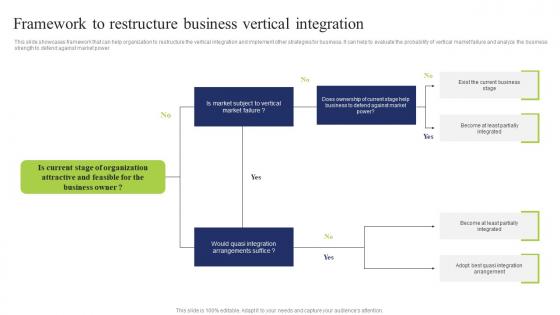
Business Integration Tactics To Eliminate Competitors Framework Restructure Business Infographics Pdf
This slide showcases framework that can help organization to restructure the vertical integration and implement other strategies for business. It can help to evaluate the probability of vertical market failure and analyze the business strength to defend against market power If you are looking for a format to display your unique thoughts, then the professionally designed Business Integration Tactics To Eliminate Competitors Framework Restructure Business Infographics Pdf is the one for you. You can use it as a Google Slides template or a PowerPoint template. Incorporate impressive visuals, symbols, images, and other charts. Modify or reorganize the text boxes as you desire. Experiment with shade schemes and font pairings. Alter, share or cooperate with other people on your work. Download Business Integration Tactics To Eliminate Competitors Framework Restructure Business Infographics Pdf and find out how to give a successful presentation. Present a perfect display to your team and make your presentation unforgettable. This slide showcases framework that can help organization to restructure the vertical integration and implement other strategies for business. It can help to evaluate the probability of vertical market failure and analyze the business strength to defend against market power
Dashboard Tracking Ambassador Implementing Social Media Tactics For Boosting WOM Demonstration Pdf
This slide covers the KPI dashboard for companies to evaluate the performance of ambassador marketing campaigns. It includes metrics such as the number of brand ambassadors, the total number of shares, clicks, CPS, revenue, commissions, etc.Find highly impressive Dashboard Tracking Ambassador Implementing Social Media Tactics For Boosting WOM Demonstration Pdf on Slidegeeks to deliver a meaningful presentation. You can save an ample amount of time using these presentation templates. No need to worry to prepare everything from scratch because Slidegeeks experts have already done a huge research and work for you. You need to download Dashboard Tracking Ambassador Implementing Social Media Tactics For Boosting WOM Demonstration Pdf for your upcoming presentation. All the presentation templates are 100 percent editable and you can change the color and personalize the content accordingly. Download now This slide covers the KPI dashboard for companies to evaluate the performance of ambassador marketing campaigns. It includes metrics such as the number of brand ambassadors, the total number of shares, clicks, CPS, revenue, commissions, etc.
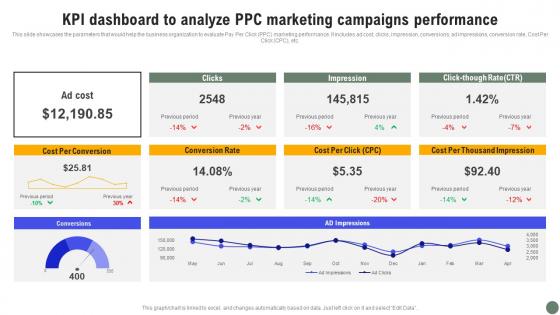
KPI Dashboard To Analyze PPC Exhaustive Guide Of Pay Per Click Advertising Initiatives Inspiration Pdf
This slide showcases the parameters that would help the business organization to evaluate Pay Per Click PPC marketing performance. It includes ad cost, clicks, impression, conversions, ad impressions, conversion rate, Cost Per Click CPC, etc. Formulating a presentation can take up a lot of effort and time, so the content and message should always be the primary focus. The visuals of the PowerPoint can enhance the presenters message, so our KPI Dashboard To Analyze PPC Exhaustive Guide Of Pay Per Click Advertising Initiatives Inspiration Pdf was created to help save time. Instead of worrying about the design, the presenter can concentrate on the message while our designers work on creating the ideal templates for whatever situation is needed. Slidegeeks has experts for everything from amazing designs to valuable content, we have put everything into KPI Dashboard To Analyze PPC Exhaustive Guide Of Pay Per Click Advertising Initiatives Inspiration Pdf This slide showcases the parameters that would help the business organization to evaluate Pay Per Click PPC marketing performance. It includes ad cost, clicks, impression, conversions, ad impressions, conversion rate, Cost Per Click CPC, etc.
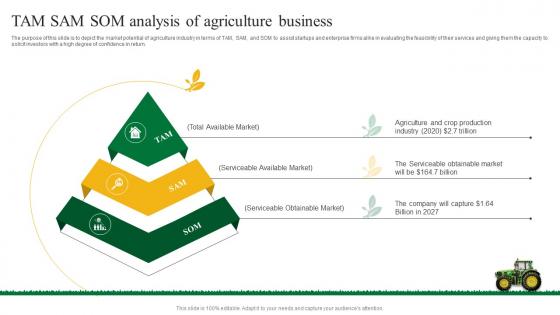
Tam Sam Som Analysis Of Agriculture Business Plan Go To Market Strategy Information Pdf
The purpose of this slide is to depict the market potential of agriculture industry in terms of TAM, SAM, and SOM to assist startups and enterprise firms alike in evaluating the feasibility of their services and giving them the capacity to solicit investors with a high degree of confidence in return. Boost your pitch with our creative Tam Sam Som Analysis Of Agriculture Business Plan Go To Market Strategy Information Pdf. Deliver an awe inspiring pitch that will mesmerize everyone. Using these presentation templates you will surely catch everyones attention. You can browse the ppts collection on our website. We have researchers who are experts at creating the right content for the templates. So you do not have to invest time in any additional work. Just grab the template now and use them. The purpose of this slide is to depict the market potential of agriculture industry in terms of TAM, SAM, and SOM to assist startups and enterprise firms alike in evaluating the feasibility of their services and giving them the capacity to solicit investors with a high degree of confidence in return.

KPI Measuring After Implementing Restaurant Marketing Strategies Create An Effective Restaurant
The following slide showcases various key performance indicators KPIs through which marketers can evaluate the success of traditional marketing performance. The metrics mentioned in slide are customer acquisition cost CAC, cross-sells, referrals, sales per square foot, repeat purchase rate, foot traffic, average order value, etc. Formulating a presentation can take up a lot of effort and time, so the content and message should always be the primary focus. The visuals of the PowerPoint can enhance the presenters message, so our KPI Measuring After Implementing Restaurant Marketing Strategies Create An Effective Restaurant was created to help save time. Instead of worrying about the design, the presenter can concentrate on the message while our designers work on creating the ideal templates for whatever situation is needed. Slidegeeks has experts for everything from amazing designs to valuable content, we have put everything into KPI Measuring After Implementing Restaurant Marketing Strategies Create An Effective Restaurant. The following slide showcases various key performance indicators KPIs through which marketers can evaluate the success of traditional marketing performance. The metrics mentioned in slide are customer acquisition cost CAC, cross-sells, referrals, sales per square foot, repeat purchase rate, foot traffic, average order value, etc.
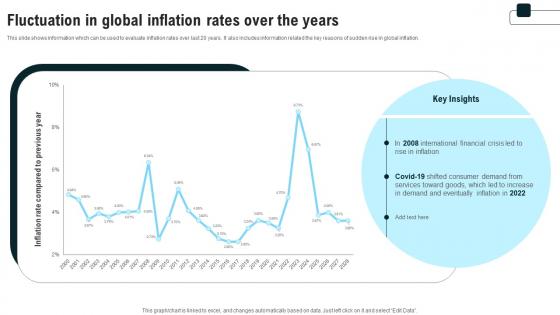
Fluctuation In Global Inflation Rates Over The Years Strategies For Inflation A Tactical Guide Fin SS V
This slide shows information which can be used to evaluate inflation rates over last 20 years. It also includes information related the key reasons of sudden rise in global inflation. If you are looking for a format to display your unique thoughts, then the professionally designed Fluctuation In Global Inflation Rates Over The Years Strategies For Inflation A Tactical Guide Fin SS V is the one for you. You can use it as a Google Slides template or a PowerPoint template. Incorporate impressive visuals, symbols, images, and other charts. Modify or reorganize the text boxes as you desire. Experiment with shade schemes and font pairings. Alter, share or cooperate with other people on your work. Download Fluctuation In Global Inflation Rates Over The Years Strategies For Inflation A Tactical Guide Fin SS V and find out how to give a successful presentation. Present a perfect display to your team and make your presentation unforgettable. This slide shows information which can be used to evaluate inflation rates over last 20 years. It also includes information related the key reasons of sudden rise in global inflation.


 Continue with Email

 Home
Home


