Procurement Planning
Dashboard Tracking Essential Kpis For Ecommerce Performance Slides PDF
This slide provides information regarding essential KPIs for ecommerce performance dashboard tracking average bounce rate, new vs. old customers, channel revenue vs. channel acquisitions costs, channel revenue vs. sales, average conversion rate, etc. Deliver an awe inspiring pitch with this creative Dashboard Tracking Essential Kpis For Ecommerce Performance Slides PDF bundle. Topics like Average Bounce Rate, Channel Acquisition Costs, Channel Revenue can be discussed with this completely editable template. It is available for immediate download depending on the needs and requirements of the user.
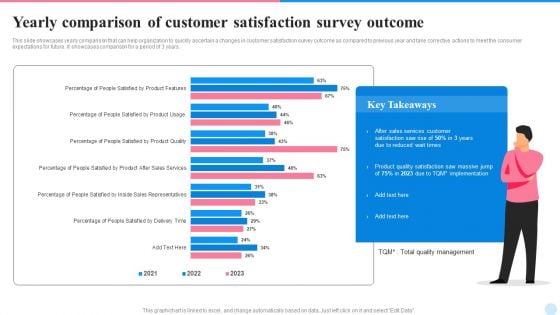
Yearly Comparison Of Customer Satisfaction Survey Outcome Demonstration PDF
This slide showcases yearly comparison that can help organization to quickly ascertain a changes in customer satisfaction survey outcome as compared to previous year and take corrective actions to meet the consumer expectations for future. It showcases comparison for a period of 3 years. Showcasing this set of slides titled Yearly Comparison Of Customer Satisfaction Survey Outcome Demonstration PDF. The topics addressed in these templates are Sales Services Customer, Implementation, Product Quality Satisfaction. All the content presented in this PPT design is completely editable. Download it and make adjustments in color, background, font etc. as per your unique business setting.
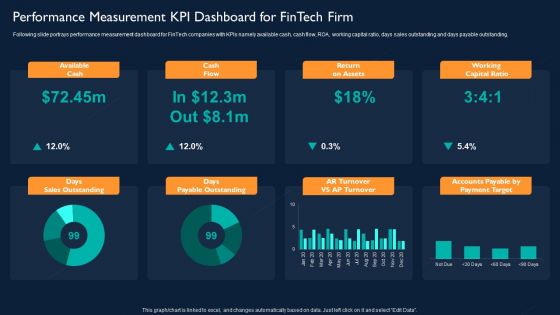
Technology Investment To Enhance Business Growth Performance Measurement KPI Dashboard For Fintech Firm Slides PDF
Following slide portrays performance measurement dashboard for FinTech companies with KPIs namely available cash, cash flow, ROA, working capital ratio, days sales outstanding and days payable outstanding. Deliver an awe inspiring pitch with this creative Technology Investment To Enhance Business Growth Performance Measurement KPI Dashboard For Fintech Firm Slides PDF bundle. Topics like Available Cash, Cash Flow, Return On Assets, Working Capital Ratio can be discussed with this completely editable template. It is available for immediate download depending on the needs and requirements of the user.
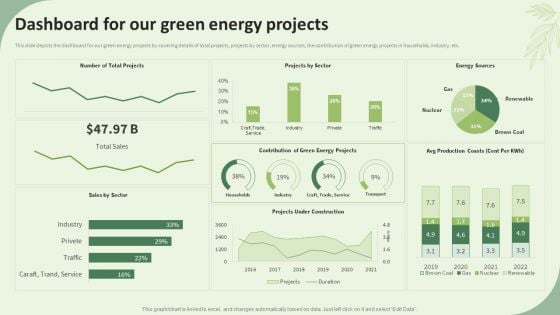
Sustainable Energy Resources Dashboard For Our Green Energy Projects Mockup PDF
This slide depicts the dashboard for our green energy projects by covering details of total projects, projects by sector, energy sources, the contribution of green energy projects in households, industry, etc. Deliver and pitch your topic in the best possible manner with this Sustainable Energy Resources Dashboard For Our Green Energy Projects Mockup PDF. Use them to share invaluable insights on Projects Sector, Energy Sources, Sales Sector and impress your audience. This template can be altered and modified as per your expectations. So, grab it now.
Tracking Channel Campaign Metrics To Measure Web Traffic Sample PDF
This slide covers measuring campaign key performance indicators through tracking channel web traffic which includes total visit, cost per click, engagement rate and total impressions. Pitch your topic with ease and precision using this Tracking Channel Campaign Metrics To Measure Web Traffic Sample PDF. This layout presents information on Revenue By Channel, Website Demographics, Product Sales Trend. It is also available for immediate download and adjustment. So, changes can be made in the color, design, graphics or any other component to create a unique layout.
Precooked Food Industry Analysis KPI Dashboard For Tracking Supply Chain Costs Diagrams PDF
This slide represents the KPI dashboard to track the multiple cost associated with supply chain in food manufacturing industry. It includes information regarding cash to cash cycle in days, carry cost of inventory along with details of net sales.Deliver an awe inspiring pitch with this creative Precooked Food Industry Analysis KPI Dashboard For Tracking Supply Chain Costs Diagrams PDF bundle. Topics like Processing Industry, Food Processing, Manufacturing Industry can be discussed with this completely editable template. It is available for immediate download depending on the needs and requirements of the user.
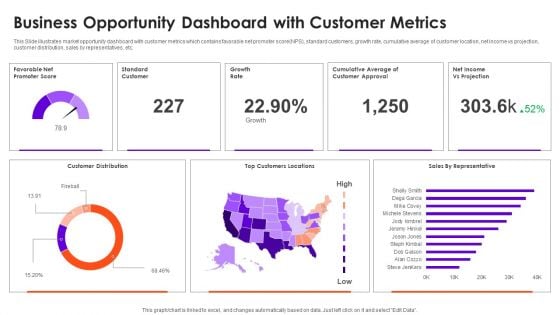
Business Opportunity Dashboard With Customer Metrics Information PDF
This Slide illustrates market opportunity dashboard with customer metrics which contains favorable net promoter score NPS, standard customers, growth rate, cumulative average of customer location, net income vs projection, customer distribution, sales by representatives, etc. Pitch your topic with ease and precision using this Business Opportunity Dashboard With Customer Metrics Information PDF. This layout presents information on Customer Distribution, Growth Rate, Top Customers Locations. It is also available for immediate download and adjustment. So, changes can be made in the color, design, graphics or any other component to create a unique layout.
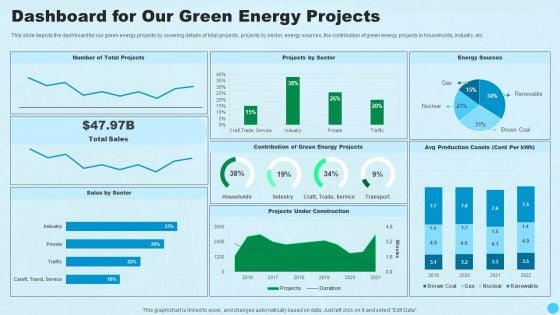
Dashboard For Our Green Energy Projects Clean And Renewable Energy Ppt PowerPoint Presentation Styles Designs Download PDF
This slide depicts the dashboard for our green energy projects by covering details of total projects, projects by sector, energy sources, the contribution of green energy projects in households, industry, etc.Deliver an awe inspiring pitch with this creative Dashboard For Our Green Energy Projects Clean And Renewable Energy Ppt PowerPoint Presentation Styles Designs Download PDF bundle. Topics like Energy Sources, Production Coasts, Total Sales can be discussed with this completely editable template. It is available for immediate download depending on the needs and requirements of the user.
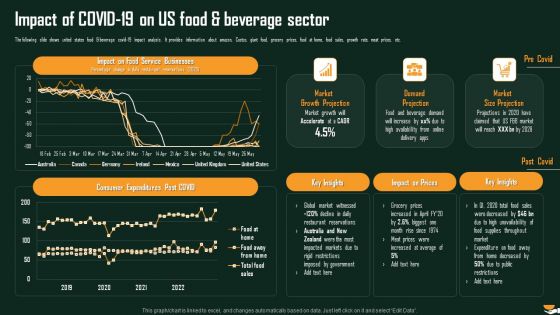
Impact Of COVID 19 On Us Food And Beverage Sector International Food And Beverages Sector Analysis Structure PDF
The following slide shows united states food and beverage covid19 impact analysis. It provides information about amazon, Costco, giant food, grocery prices, food at home, food sales, growth rate, meat prices, etc.Deliver and pitch your topic in the best possible manner with this Impact Of COVID 19 On Us Food And Beverage Sector International Food And Beverages Sector Analysis Structure PDF. Use them to share invaluable insights on Service Businesses, Consumer Expenditures, Impact Prices and impress your audience. This template can be altered and modified as per your expectations. So, grab it now.
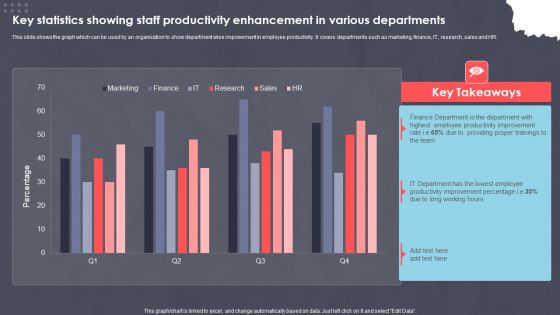
Key Statistics Showing Staff Productivity Enhancement In Various Departments Ppt PowerPoint Presentation Slides Portrait PDF
This slide shows the graph which can be used by an organization to show department wise improvement in employee productivity. It covers departments such as marketing, finance, IT, research, sales and HR. Pitch your topic with ease and precision using this Key Statistics Showing Staff Productivity Enhancement In Various Departments Ppt PowerPoint Presentation Slides Portrait PDF. This layout presents information on XXXXXXXXXXXXXXXXXXXXXXXXX. It is also available for immediate download and adjustment. So, changes can be made in the color, design, graphics or any other component to create a unique layout.
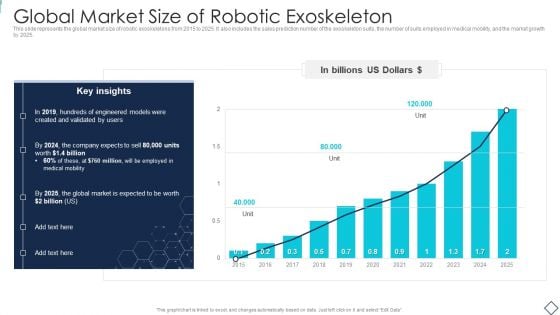
Robotic Armor IT Global Market Size Of Robotic Exoskeleton Brochure PDF
This slide represents the global market size of robotic exoskeletons from 2015 to 2025. It also includes the sales prediction number of the exoskeleton suits, the number of suits employed in medical mobility, and the market growth by 2025. Deliver an awe inspiring pitch with this creative Robotic Armor IT Global Market Size Of Robotic Exoskeleton Brochure PDF bundle. Topics like Billions US Dollars, Global Market, 2015 To 2025 can be discussed with this completely editable template. It is available for immediate download depending on the needs and requirements of the user.
Developing Significant Business Product And Customer Performance Tracking Clipart PDF
This slide provides information regarding dashboard utilized by firm to monitor performance of products offered and customer associated. The performance is tracked through revenues generated, new customer acquired, customer satisfaction, sales comparison, etc. Deliver and pitch your topic in the best possible manner with this Developing Significant Business Product And Customer Performance Tracking Clipart PDF. Use them to share invaluable insights on Revenue, New Customer, Revenue and impress your audience. This template can be altered and modified as per your expectations. So, grab it now.
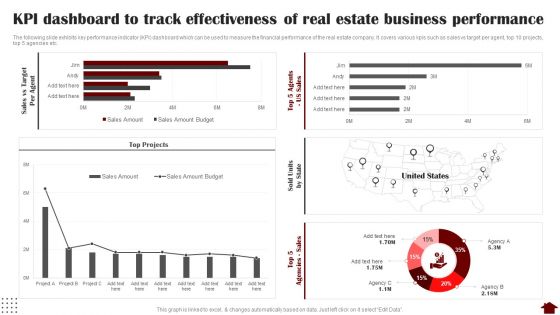
KPI Dashboard To Track Effectiveness Of Real Estate Business Performance Slides PDF
The following slide exhibits key performance indicator KPI dashboard which can be used to measure the financial performance of the real estate company. It covers various kpis such as sales vs target per agent, top 10 projects, top 5 agencies etc. Deliver an awe inspiring pitch with this creative KPI Dashboard To Track Effectiveness Of Real Estate Business Performance Slides PDF bundle. Topics like KPI Dashboard, Track Effectiveness, Real Estate Business Performance can be discussed with this completely editable template. It is available for immediate download depending on the needs and requirements of the user.
Monthly Project Investment Expense Tracking KPI Dashboard Themes PDF
This slide showcases KPI dashboard for analysing the variance between billed and budgeted expenses. It also include metrics such as project budget, potential, billed, cost, margin billed vs. budget labour cost, hours details by resources, etc. Pitch your topic with ease and precision using this Monthly Project Investment Expense Tracking KPI Dashboard Themes PDF. This layout presents information on Project Summary, Sales Potential. It is also available for immediate download and adjustment. So, changes can be made in the color, design, graphics or any other component to create a unique layout.
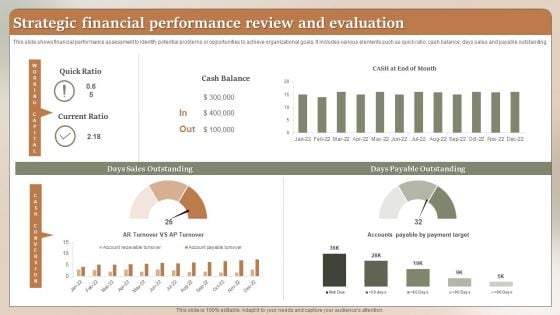
Strategic Financial Performance Review And Evaluation Ppt Layouts Styles PDF
This slide shows financial performance assessment to identify potential problems or opportunities to achieve organizational goals. It includes various elements such as quick ratio, cash balance, days sales and payable outstanding. Showcasing this set of slides titled Strategic Financial Performance Review And Evaluation Ppt Layouts Styles PDF. The topics addressed in these templates are Cash Balance, Quick Ratio, Current Ratio. All the content presented in this PPT design is completely editable. Download it and make adjustments in color, background, font etc. as per your unique business setting.
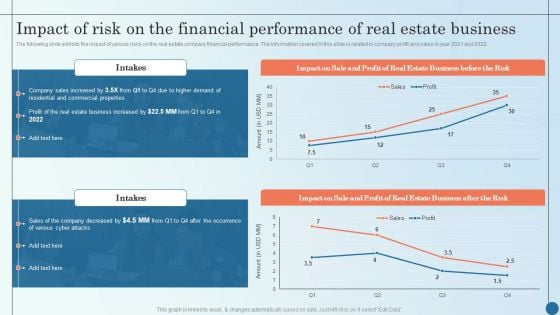
Impact Of Risk On The Financial Performance Of Real Managing Commercial Property Risks Sample PDF
The following slide exhibits the impact of various risks on the real estate company financial performance. The information covered in this slide is related to company profit and sales in year 2021 and 2022. Deliver and pitch your topic in the best possible manner with this Impact Of Risk On The Financial Performance Of Real Managing Commercial Property Risks Sample PDF. Use them to share invaluable insights on Estate Business, Business Increased, Company Decreased and impress your audience. This template can be altered and modified as per your expectations. So, grab it now.
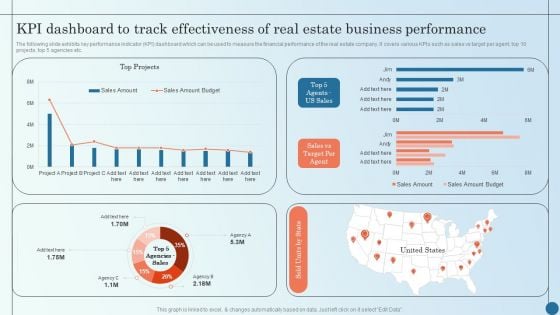
KPI Dashboard To Track Effectiveness Of Real Estate Business Managing Commercial Property Risks Demonstration PDF
The following slide exhibits key performance indicator KPI dashboard which can be used to measure the financial performance of the real estate company. It covers various KPIs such as sales vs target per agent, top 10 projects, top 5 agencies etc.Deliver an awe inspiring pitch with this creative KPI Dashboard To Track Effectiveness Of Real Estate Business Managing Commercial Property Risks Demonstration PDF bundle. Topics like Kpi Dashboard, Track Effectiveness, Estate Business can be discussed with this completely editable template. It is available for immediate download depending on the needs and requirements of the user.
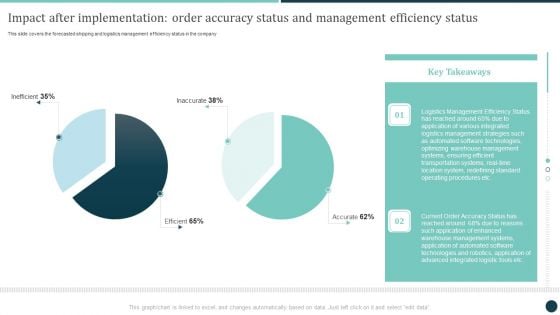
Impact After Implementation Order Accuracy Status And Management Efficiency Status Demonstration PDF
Slidegeeks is here to make your presentations a breeze with Impact After Implementation Order Accuracy Status And Management Efficiency Status Demonstration PDF With our easytouse and customizable templates, you can focus on delivering your ideas rather than worrying about formatting. With a variety of designs to choose from, youre sure to find one that suits your needs. And with animations and unique photos, illustrations, and fonts, you can make your presentation pop. So whether youre giving a sales pitch or presenting to the board, make sure to check out Slidegeeks first.
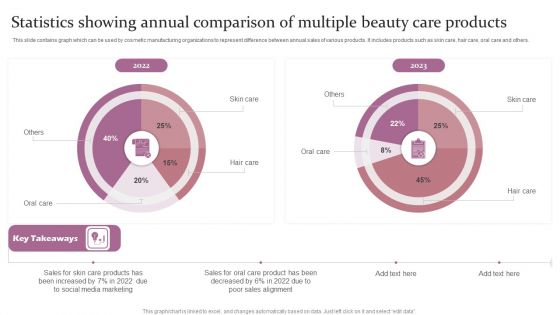
Statistics Showing Annual Comparison Of Multiple Beauty Care Products Ppt Infographics Objects PDF
This slide contains graph which can be used by cosmetic manufacturing organizations to represent difference between annual sales of various products. It includes products such as skin care, hair care, oral care and others. Showcasing this set of slides titled Statistics Showing Annual Comparison Of Multiple Beauty Care Products Ppt Infographics Objects PDF. The topics addressed in these templates are Skin Care, Hair Care, 2022 To 2023. All the content presented in this PPT design is completely editable. Download it and make adjustments in color, background, font etc. as per your unique business setting.
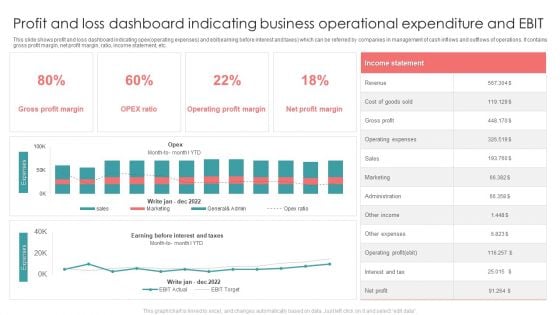
Profit And Loss Dashboard Indicating Business Operational Expenditure And EBIT Formats PDF
This slide shows profit and loss dashboard indicating opex operating expenses and ebit earning before interest and taxes which can be referred by companies in management of cash inflows and outflows of operations. It contains gross profit margin, net profit margin, ratio, income statement, etc. Showcasing this set of slides titled Profit And Loss Dashboard Indicating Business Operational Expenditure And EBIT Formats PDF. The topics addressed in these templates are Revenue, Gross Profit, Sales. All the content presented in this PPT design is completely editable. Download it and make adjustments in color, background, font etc. as per your unique business setting.
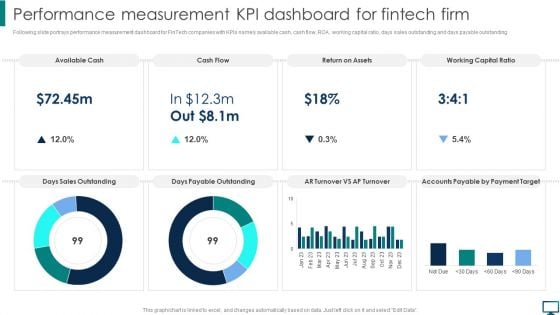
Performance Measurement KPI Dashboard For Fintech Firm Topics PDF
Following slide portrays performance measurement dashboard for FinTech companies with KPIs namely available cash, cash flow, ROA, working capital ratio, days sales outstanding and days payable outstanding. Create an editable Performance Measurement KPI Dashboard For Fintech Firm Topics PDF that communicates your idea and engages your audience. Whether you are presenting a business or an educational presentation, pre designed presentation templates help save time. Performance Measurement KPI Dashboard For Fintech Firm Topics PDF is highly customizable and very easy to edit, covering many different styles from creative to business presentations. Slidegeeks has creative team members who have crafted amazing templates. So, go and get them without any delay.
KPI Dashboard For Tracking Supply Chain Costs Industry Analysis Of Food Formats PDF
This slide represents the KPI dashboard to track the multiple cost associated with supply chain in food manufacturing industry. It includes information regarding cash to cash cycle in days, carry cost of inventory along with details of net sales.Find a pre-designed and impeccable KPI Dashboard For Tracking Supply Chain Costs Industry Analysis Of Food Formats PDF. The templates can ace your presentation without additional effort. You can download these easy-to-edit presentation templates to make your presentation stand out from others. So, what are you waiting for Download the template from Slidegeeks today and give a unique touch to your presentation.
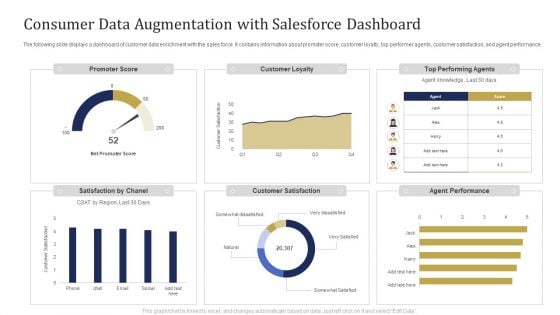
Consumer Data Augmentation With Salesforce Dashboard Ppt Pictures Portrait PDF
The following slide displays a dashboard of customer data enrichment with the sales force. It contains information about promoter score, customer loyalty, top performer agents, customer satisfaction, and agent performance. Showcasing this set of slides titled Consumer Data Augmentation With Salesforce Dashboard Ppt Pictures Portrait PDF. The topics addressed in these templates are Promoter Score, Customer Loyalty, Top Performing Agents. All the content presented in this PPT design is completely editable. Download it and make adjustments in color, background, font etc. as per your unique business setting.
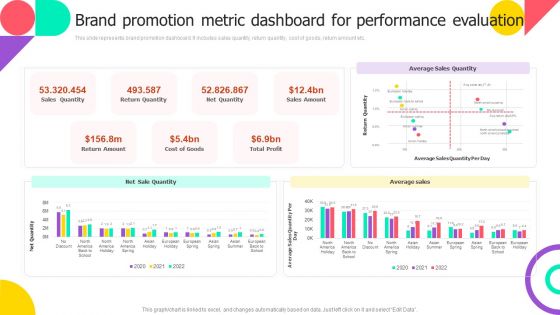
Brand Promotion Metric Dashboard For Performance Evaluation Sample PDF
This slide represents brand promotion dashboard. It includes sales quantity, return quantity, cost of goods, return amount etc. Slidegeeks is one of the best resources for PowerPoint templates. You can download easily and regulate Brand Promotion Metric Dashboard For Performance Evaluation Sample PDF for your personal presentations from our wonderful collection. A few clicks is all it takes to discover and get the most relevant and appropriate templates. Use our Templates to add a unique zing and appeal to your presentation and meetings. All the slides are easy to edit and you can use them even for advertisement purposes.
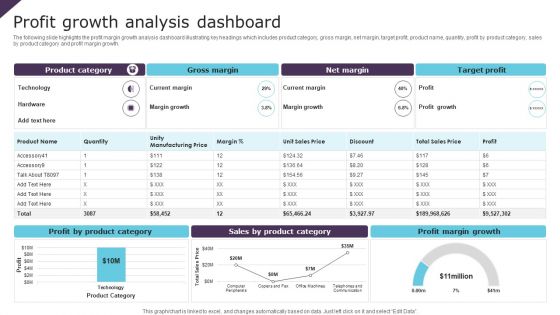
Profit Growth Analysis Dashboard Ppt PowerPoint Presentation File Design Templates PDF
The following slide highlights the profit margin growth analysis dashboard illustrating key headings which includes product category, gross margin, net margin, target profit, product name, quantity, profit by product category, sales by product category and profit margin growth. Showcasing this set of slides titled Profit Growth Analysis Dashboard Ppt PowerPoint Presentation File Design Templates PDF. The topics addressed in these templates are Gross Margin, Net Margin, Target Profit. All the content presented in this PPT design is completely editable. Download it and make adjustments in color, background, font etc. as per your unique business setting.
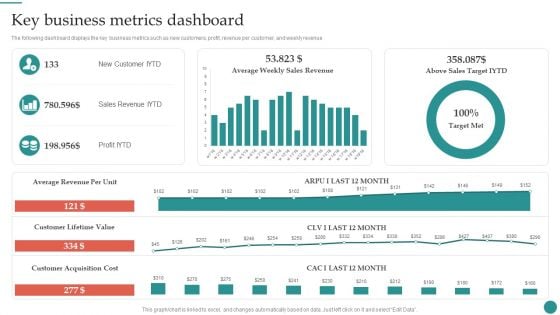
Key Business Metrics Dashboard Company Process Administration And Optimization Playbook Infographics PDF
The following dashboard displays the key business metrics such as new customers, profit, revenue per customer, and weekly revenue. Slidegeeks is here to make your presentations a breeze with Key Business Metrics Dashboard Company Process Administration And Optimization Playbook Infographics PDF With our easy-to-use and customizable templates, you can focus on delivering your ideas rather than worrying about formatting. With a variety of designs to choose from, you are sure to find one that suits your needs. And with animations and unique photos, illustrations, and fonts, you can make your presentation pop. So whether you are giving a sales pitch or presenting to the board, make sure to check out Slidegeeks first.
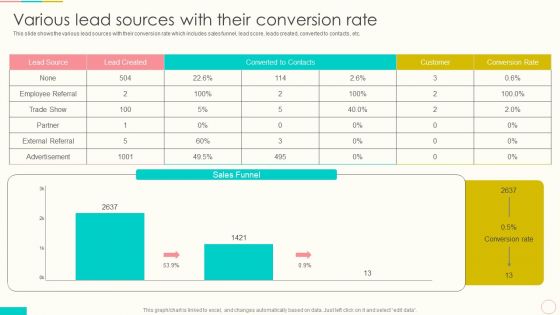
Lead Management To Engage Potential Customers Various Lead Sources With Their Conversion Rate Template PDF
This slide shows the various lead sources with their conversion rate which includes sales funnel, lead score, leads created, converted to contacts, etc. Take your projects to the next level with our ultimate collection of Lead Management To Engage Potential Customers Various Lead Sources With Their Conversion Rate Template PDF. Slidegeeks has designed a range of layouts that are perfect for representing task or activity duration, keeping track of all your deadlines at a glance. Tailor these designs to your exact needs and give them a truly corporate look with your own brand colors they will make your projects stand out from the rest.
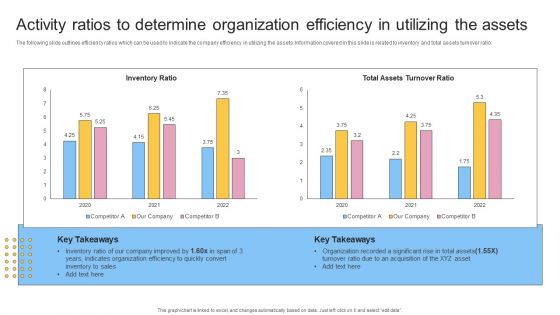
Activity Ratios To Determine Organization Efficiency In Utilizing The Assets Slides PDF
Slidegeeks is here to make your presentations a breeze with Activity Ratios To Determine Organization Efficiency In Utilizing The Assets Slides PDF With our easy to use and customizable templates, you can focus on delivering your ideas rather than worrying about formatting. With a variety of designs to choose from, you are sure to find one that suits your needs. And with animations and unique photos, illustrations, and fonts, you can make your presentation pop. So whether you are giving a sales pitch or presenting to the board, make sure to check out Slidegeeks first.
CRM Pipeline Administration Determine Conversion Rates At Different Stages Ppt Icon Deck PDF
This slide provides information regarding the addressing conversion rates at different stages and estimating opportunities with value associated to them. Slidegeeks is here to make your presentations a breeze with CRM Pipeline Administration Determine Conversion Rates At Different Stages Ppt Icon Deck PDF With our easy-to-use and customizable templates, you can focus on delivering your ideas rather than worrying about formatting. With a variety of designs to choose from, youre sure to find one that suits your needs. And with animations and unique photos, illustrations, and fonts, you can make your presentation pop. So whether youre giving a sales pitch or presenting to the board, make sure to check out Slidegeeks first.
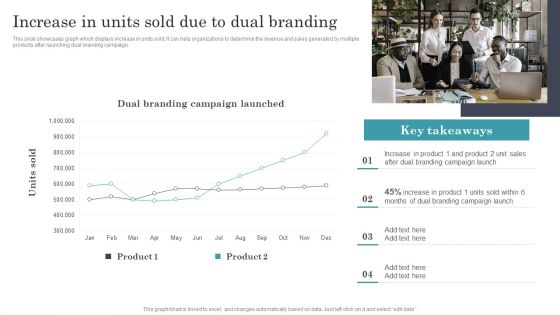
Developing Dual Branding Campaign For Brand Marketing Increase In Units Sold Due To Dual Branding Sample PDF
This slide showcases graph which displays increase in units sold. It can help organizations to determine the revenue and sales generated by multiple products after launching dual branding campaign. Want to ace your presentation in front of a live audience Our Developing Dual Branding Campaign For Brand Marketing Increase In Units Sold Due To Dual Branding Sample PDF can help you do that by engaging all the users towards you. Slidegeeks experts have put their efforts and expertise into creating these impeccable powerpoint presentations so that you can communicate your ideas clearly. Moreover, all the templates are customizable, and easy to edit and downloadable. Use these for both personal and commercial use.
Survey Report On Global Voluntary Attrition Tracking By Function Background PDF
This slide depicts survey outcomes on turnover rates based on different functions. It includes survey based on multiple functions such as IT, legal, R and D, public sector, customer support, marketing, HR, sales and finance. along with overall global rates. Showcasing this set of slides titled Survey Report On Global Voluntary Attrition Tracking By Function Background PDF. The topics addressed in these templates are Finance Function, Global Turnover Rates. All the content presented in this PPT design is completely editable. Download it and make adjustments in color, background, font etc. as per your unique business setting.
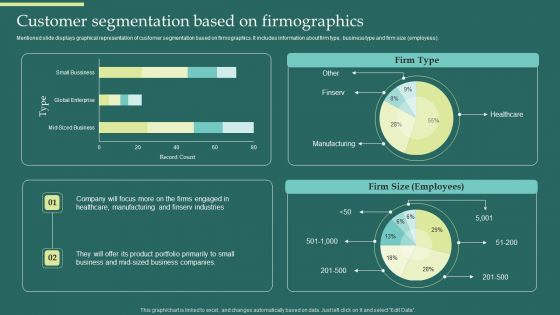
Product Portfolios And Strategic Customer Segmentation Based On Firmographics Brochure PDF
Mentioned slide displays graphical representation of customer segmentation based on firmographics. It includes information about firm type, business type and firm size employees. Slidegeeks is here to make your presentations a breeze with Product Portfolios And Strategic Customer Segmentation Based On Firmographics Brochure PDF With our easy-to-use and customizable templates, you can focus on delivering your ideas rather than worrying about formatting. With a variety of designs to choose from, youre sure to find one that suits your needs. And with animations and unique photos, illustrations, and fonts, you can make your presentation pop. So whether youre giving a sales pitch or presenting to the board, make sure to check out Slidegeeks first.
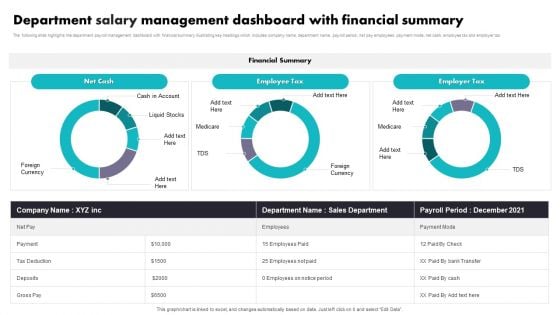
Department Salary Management Dashboard With Financial Summary Portrait PDF
The following slide highlights the department payroll management dashboard with financial summary illustrating key headings which includes company name, department name, payroll period, net pay employees, payment mode, net cash, employee tax and employer tax. Showcasing this set of slides titled Department Salary Management Dashboard With Financial Summary Portrait PDF. The topics addressed in these templates are Sales Department, Employee Tax, Financial Summary. All the content presented in this PPT design is completely editable. Download it and make adjustments in color, background, font etc. as per your unique business setting.
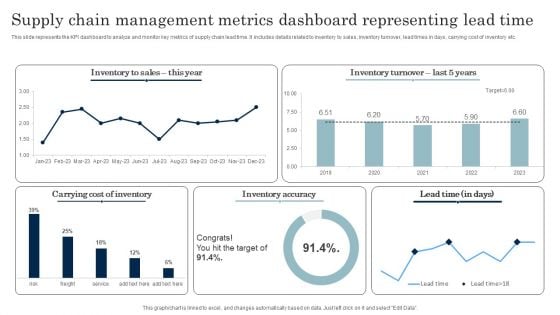
Supply Chain Management Metrics Dashboard Representing Lead Time Download PDF
This slide represents the KPI dashboard to analyze and monitor key metrics of supply chain lead time. It includes details related to inventory to sales, inventory turnover, lead times in days, carrying cost of inventory etc. Pitch your topic with ease and precision using this Supply Chain Management Metrics Dashboard Representing Lead Time Download PDF. This layout presents information on Inventory Accuracy, Carrying Cost Of Inventory. It is also available for immediate download and adjustment. So, changes can be made in the color, design, graphics or any other component to create a unique layout.
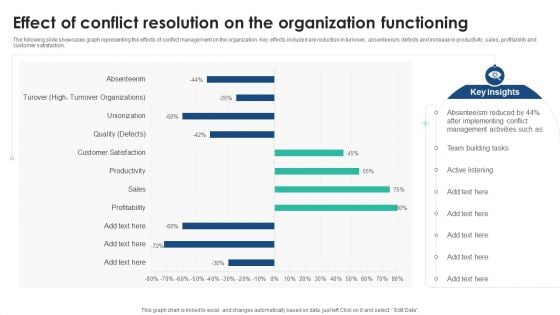
Effect Of Conflict Resolution On The Organization Functioning Pictures PDF
The following slide showcases graph representing the effects of conflict management on the organization. Key effects included are reduction in turnover, absenteeism, defects and increase in productivity, sales, profitability and customer satisfaction. Showcasing this set of slides titled Effect Of Conflict Resolution On The Organization Functioning Topics PDF. The topics addressed in these templates areEffect Of Conflict Resolution On The Organization Functioning Pictures PDF. All the content presented in this PPT design is completely editable. Download it and make adjustments in color, background, font etc. as per your unique business setting.
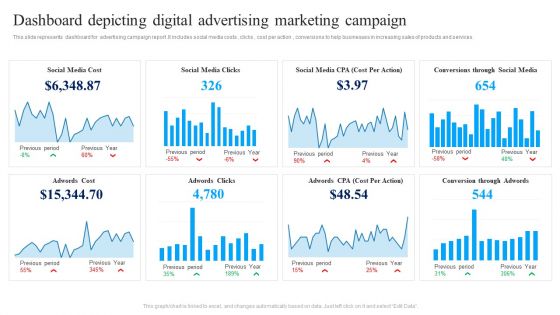
Dashboard Depicting Digital Advertising Marketing Campaign Ppt Summary Elements PDF
This slide represents dashboard for advertising campaign report .It includes social media costs , clicks , cost per action , conversions to help businesses in increasing sales of products and services. Showcasing this set of slides titled Dashboard Depicting Digital Advertising Marketing Campaign Ppt Summary Elements PDF. The topics addressed in these templates are Social Media Cost, Social Media Clicks, Adwords Clicks, Adwords Cost . All the content presented in this PPT design is completely editable. Download it and make adjustments in color, background, font etc. as per your unique business setting.
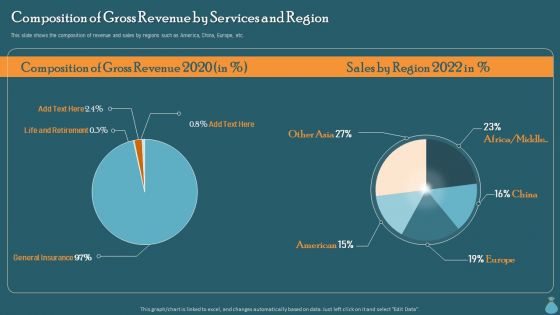
Financial Data Revelation To Varied Stakeholders Composition Of Gross Revenue By Services And Region Slides PDF
This slide shows the composition of revenue and sales by regions such as America, China, Europe, etc. Create an editable Financial Data Revelation To Varied Stakeholders Composition Of Gross Revenue By Services And Region Slides PDF that communicates your idea and engages your audience. Whether you are presenting a business or an educational presentation, pre designed presentation templates help save time. Financial Data Revelation To Varied Stakeholders Composition Of Gross Revenue By Services And Region Slides PDF is highly customizable and very easy to edit, covering many different styles from creative to business presentations. Slidegeeks has creative team members who have crafted amazing templates. So, go and get them without any delay.
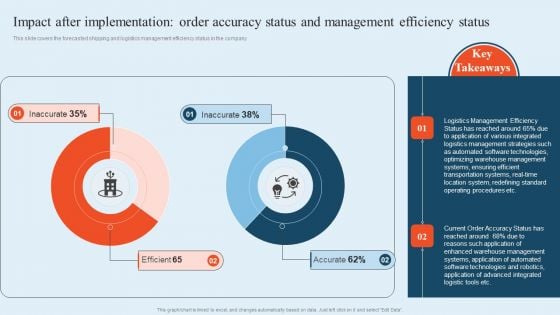
Integrating Logistics Automation Solution Impact After Implementation Order Accuracy Status And Management Ppt Styles File Formats PDF
This slide covers the forecasted shipping and logistics management efficiency status in the company. Slidegeeks is here to make your presentations a breeze with Integrating Logistics Automation Solution Impact After Implementation Order Accuracy Status And Management Ppt Styles File Formats PDF With our easy-to-use and customizable templates, you can focus on delivering your ideas rather than worrying about formatting. With a variety of designs to choose from, you are sure to find one that suits your needs. And with animations and unique photos, illustrations, and fonts, you can make your presentation pop. So whether you are giving a sales pitch or presenting to the board, make sure to check out Slidegeeks first.

Inventory Management Summary By Production Team Summary Designs PDF
This slide shows the dashboard representing the analysis of the inventory management report prepared by the production team manager. It includes information related to total no. of sales, inventory, suppliers, accounts payable etc. Pitch your topic with ease and precision using this Inventory Management Summary By Production Team Summary Designs PDF. This layout presents information on Days Inventory Outstanding, Inventory Value By Item. It is also available for immediate download and adjustment. So, changes can be made in the color, design, graphics or any other component to create a unique layout.
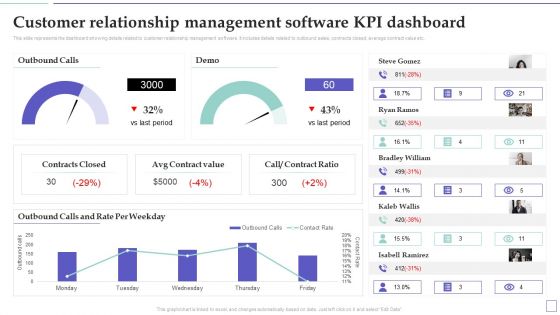
System Deployment Project Customer Relationship Management Software Kpi Dashboard Rules PDF
This slide represents the dashboard showing details related to customer relationship management software. It includes details related to outbound sales, contracts closed, average contract value etc. Present like a pro with System Deployment Project Customer Relationship Management Software Kpi Dashboard Rules PDF Create beautiful presentations together with your team, using our easy-to-use presentation slides. Share your ideas in real-time and make changes on the fly by downloading our templates. So whether youre in the office, on the go, or in a remote location, you can stay in sync with your team and present your ideas with confidence. With Slidegeeks presentation got a whole lot easier. Grab these presentations today.
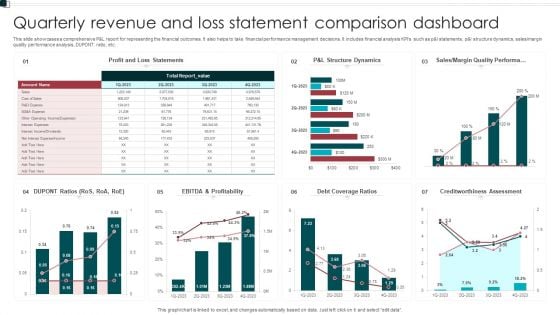
Quarterly Revenue And Loss Statement Comparison Dashboard Portrait PDF
This slide showcases a comprehensive P and L report for representing the financial outcomes. It also helps to take financial performance management decisions. It includes financial analysis KPIs such as p and l statements, p and l structure dynamics, sales or margin quality performance analysis, DUPONT ratio, etc. Showcasing this set of slides titled Quarterly Revenue And Loss Statement Comparison Dashboard Portrait PDF. The topics addressed in these templates are Profitability, Debt Coverage Ratios, Margin Quality Performa. All the content presented in this PPT design is completely editable. Download it and make adjustments in color, background, font etc. as per your unique business setting.
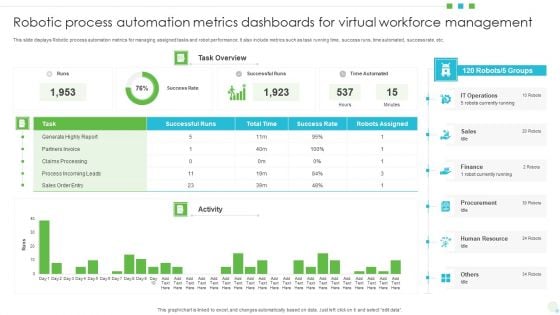
Robotic Process Automation Metrics Dashboards For Virtual Workforce Management Background PDF
This slide displays Robotic process automation metrics for managing assigned tasks and robot performance. It also include metrics such as task running time, success runs, time automated, success rate, etc. Showcasing this set of slides titled Robotic Process Automation Metrics Dashboards For Virtual Workforce Management Background PDF. The topics addressed in these templates are Finance, Sales, Human Resource. All the content presented in this PPT design is completely editable. Download it and make adjustments in color, background, font etc. as per your unique business setting.
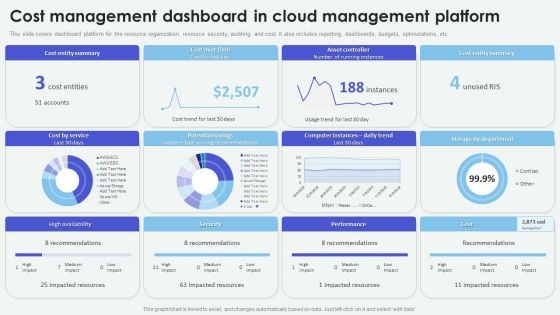
Cloud Based Computing Analysis Cost Management Dashboard In Cloud Management Formats PDF
Slidegeeks is here to make your presentations a breeze with Cloud Based Computing Analysis Cost Management Dashboard In Cloud Management Formats PDF With our easy-to-use and customizable templates, you can focus on delivering your ideas rather than worrying about formatting. With a variety of designs to choose from, youre sure to find one that suits your needs. And with animations and unique photos, illustrations, and fonts, you can make your presentation pop. So whether youre giving a sales pitch or presenting to the board, make sure to check out Slidegeeks first
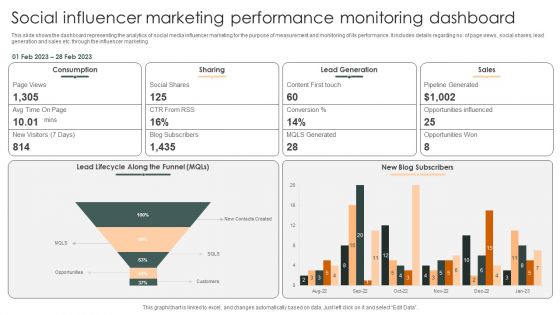
Social Influencer Marketing Performance Monitoring Dashboard Slides PDF
This slide shows the dashboard representing the analytics of social media influencer marketing for the purpose of measurement and monitoring of its performance. It includes details regarding no. of page views, social shares, lead generation and sales etc. through the influencer marketing.Pitch your topic with ease and precision using this Social Influencer Marketing Performance Monitoring Dashboard Slides PDF. This layout presents information on Lead Generation, Pipeline Generated, Opportunities Influenced. It is also available for immediate download and adjustment. So, changes can be made in the color, design, graphics or any other component to create a unique layout.
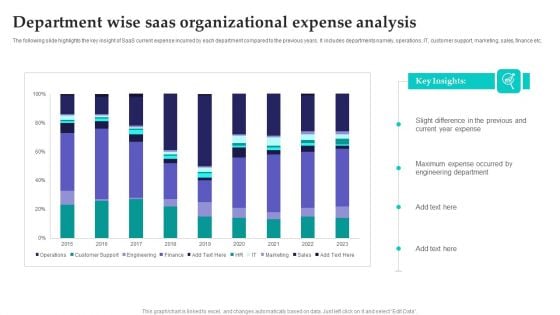
Department Wise Saas Organizational Expense Analysis Rules PDF
The following slide highlights the key insight of SaaS current expense incurred by each department compared to the previous years. It includes departments namely, operations, IT, customer support, marketing, sales, finance etc. Pitch your topic with ease and precision using this Department Wise Saas Organizational Expense Analysis Rules PDF. This layout presents information on Department Wise Saas Organizational, Expense Analysis. It is also available for immediate download and adjustment. So, changes can be made in the color, design, graphics or any other component to create a unique layout.
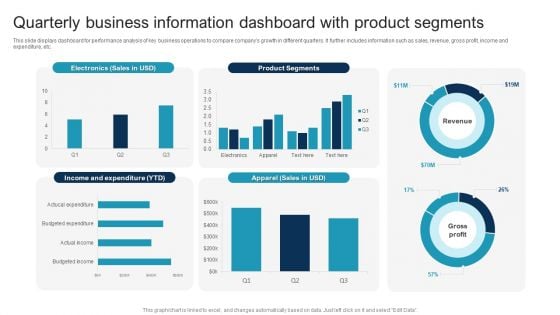
Quarterly Business Information Dashboard With Product Segments Slides PDF
This slide displays dashboard for performance analysis of key business operations to compare companys growth in different quarters. It further includes information such as sales, revenue, gross profit, income and expenditure, etc. Showcasing this set of slides titled Quarterly Business Information Dashboard With Product Segments Slides PDF. The topics addressed in these templates are Quarterly Business Information, Dashboard With Product Segments. All the content presented in this PPT design is completely editable. Download it and make adjustments in color, background, font etc. as per your unique business setting.

Quarterly Financial Report With Profit And Loss Statement Themes PDF
This slide shows quarter on quarter revenue and profit status to analyze companys efficiency at generating sales. It further include key financials such as depreciation and amortization expenses, profit before tax and attributable to shareholders, etc. Pitch your topic with ease and precision using this Quarterly Financial Report With Profit And Loss Statement Themes PDF. This layout presents information on Quarterly Financial Report, Profit And Loss Statement. It is also available for immediate download and adjustment. So, changes can be made in the color, design, graphics or any other component to create a unique layout.
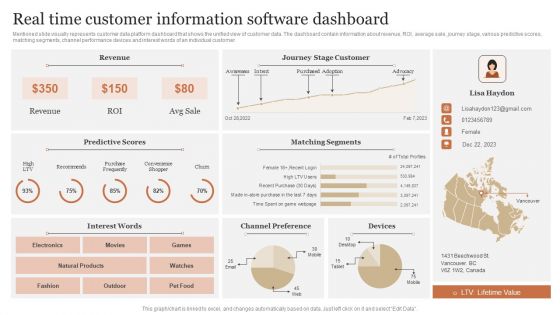
Real Time Customer Information Software Dashboard Portrait PDF
Mentioned slide visually represents customer data platform dashboard that shows the unified view of customer data. The dashboard contain information about revenue, ROI, average sale, journey stage, various predictive scores, matching segments, channel performance devices and interest words of an individual customer. Showcasing this set of slides titled Real Time Customer Information Software Dashboard Portrait PDF. The topics addressed in these templates are Predictive Scores, Matching Segments, Channel Preference. All the content presented in this PPT design is completely editable. Download it and make adjustments in color, background, font etc. as per your unique business setting.

Engineering Services Company Report Top Products And Services Ppt File Graphics Pictures PDF
The slide highlights the top product and services by sales volume in 2022. It showcases mechanical tools, industrial sensors, safety valves, line expansion, security consulting and manufacturing automation. Want to ace your presentation in front of a live audience Our Engineering Services Company Report Top Products And Services Ppt File Graphics Pictures PDF can help you do that by engaging all the users towards you. Slidegeeks experts have put their efforts and expertise into creating these impeccable powerpoint presentations so that you can communicate your ideas clearly. Moreover, all the templates are customizable, and easy-to-edit and downloadable. Use these for both personal and commercial use.
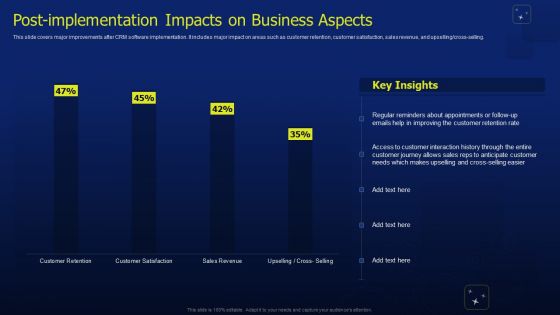
CRM Software Deployment Journey Post Implementation Impacts On Business Aspects Guidelines PDF
This slide covers major improvements after CRM software implementation. It includes major impact on areas such as customer retention, customer satisfaction, sales revenue, and upselling or cross-selling. Slidegeeks is one of the best resources for PowerPoint templates. You can download easily and regulate CRM Software Deployment Journey Post Implementation Impacts On Business Aspects Guidelines PDF for your personal presentations from our wonderful collection. A few clicks is all it takes to discover and get the most relevant and appropriate templates. Use our Templates to add a unique zing and appeal to your presentation and meetings. All the slides are easy to edit and you can use them even for advertisement purposes.
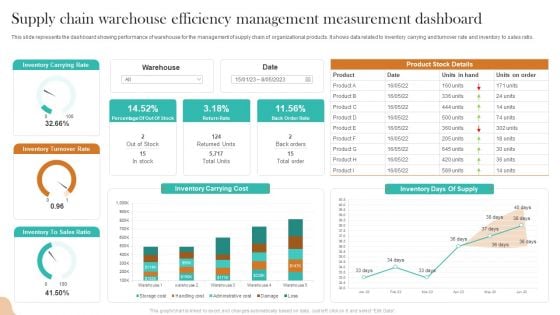
Supply Chain Warehouse Efficiency Management Measurement Dashboard Inspiration PDF
This slide represents the dashboard showing performance of warehouse for the management of supply chain of organizational products. It shows data related to inventory carrying and turnover rate and inventory to sales ratio. Pitch your topic with ease and precision using this Supply Chain Warehouse Efficiency Management Measurement Dashboard Inspiration PDF. This layout presents information on Inventory Carrying Rate, Inventory Turnover Rate, Inventory Carrying Cost. It is also available for immediate download and adjustment. So, changes can be made in the color, design, graphics or any other component to create a unique layout.
Data Structure IT Data Structure Performance Tracking Dashboard Diagrams PDF
Slidegeeks is here to make your presentations a breeze with Data Structure IT Data Structure Performance Tracking Dashboard Diagrams PDF With our easy-to-use and customizable templates, you can focus on delivering your ideas rather than worrying about formatting. With a variety of designs to choose from, youre sure to find one that suits your needs. And with animations and unique photos, illustrations, and fonts, you can make your presentation pop. So whether youre giving a sales pitch or presenting to the board, make sure to check out Slidegeeks first.
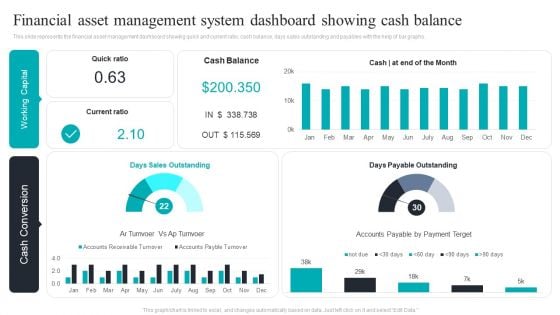
Financial Asset Management System Dashboard Showing Cash Balance Download PDF
This slide represents the financial asset management dashboard showing quick and current ratio, cash balance, days sales outstanding and payables with the help of bar graphs. Pitch your topic with ease and precision using this Financial Asset Management System Dashboard Showing Cash Balance Download PDF. This layout presents information on Financial Asset, Management System, Dashboard Showing, Cash Balance. It is also available for immediate download and adjustment. So, changes can be made in the color, design, graphics or any other component to create a unique layout.

Customer Support Services Survey Results Depicting Importance Of Customer Support Professional PDF
This slide provides an overview of survey results that exhibits the importance of support service. The results gathered are more people trust word of mouth, customers repurchase after good experience and monitoring CVL increases sales, etc. Want to ace your presentation in front of a live audience Our Customer Support Services Survey Results Depicting Importance Of Customer Support Professional PDF can help you do that by engaging all the users towards you. Slidegeeks experts have put their efforts and expertise into creating these impeccable powerpoint presentations so that you can communicate your ideas clearly. Moreover, all the templates are customizable, and easy-to-edit and downloadable. Use these for both personal and commercial use.

B2b Ecommerce Dashboard To Track Website Performance Comprehensive Guide For Developing Sample PDF
This slide represents metric dashboard to track and analyze b2b ecommerce website performance. It covers total user visits, sales, average return per user etc.Find a pre-designed and impeccable B2b Ecommerce Dashboard To Track Website Performance Comprehensive Guide For Developing Sample PDF. The templates can ace your presentation without additional effort. You can download these easy-to-edit presentation templates to make your presentation stand out from others. So, what are you waiting for Download the template from Slidegeeks today and give a unique touch to your presentation.
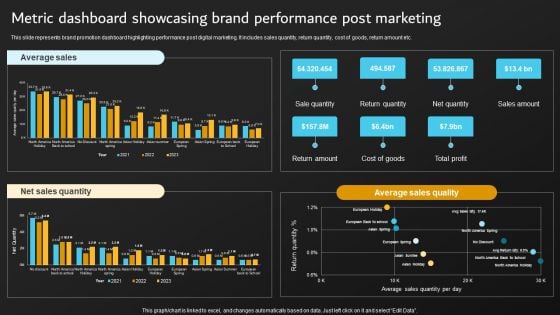
Implementation Of Digital Marketing Metric Dashboard Showcasing Brand Performance Diagrams PDF
This slide represents brand promotion dashboard highlighting performance post digital marketing. It includes sales quantity, return quantity, cost of goods, return amount etc. Slidegeeks has constructed Implementation Of Digital Marketing Metric Dashboard Showcasing Brand Performance Diagrams PDF after conducting extensive research and examination. These presentation templates are constantly being generated and modified based on user preferences and critiques from editors. Here, you will find the most attractive templates for a range of purposes while taking into account ratings and remarks from users regarding the content. This is an excellent jumping-off point to explore our content and will give new users an insight into our top-notch PowerPoint Templates.
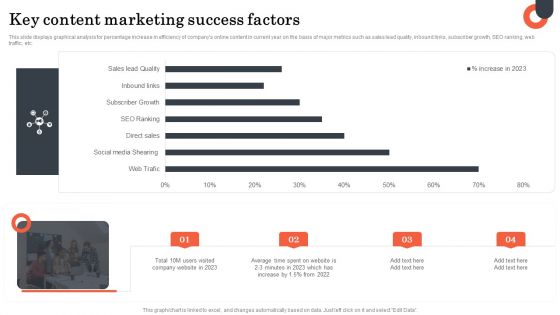
Key Content Marketing Success Factors Microsoft PDF
This slide displays graphical analysis for percentage increase in efficiency of companys online content in current year on the basis of major metrics such as sales lead quality, inbound links, subscriber growth, SEO ranking, web traffic, etc. Pitch your topic with ease and precision using this Key Content Marketing Success Factors Microsoft PDF. This layout presents information on Key Content, Marketing Success Factors. It is also available for immediate download and adjustment. So, changes can be made in the color, design, graphics or any other component to create a unique layout.
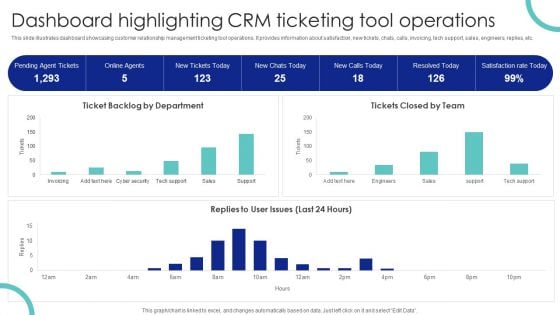
Dashboard Highlighting CRM Ticketing Tool Operations Ppt PowerPoint Presentation File Professional PDF
This slide illustrates dashboard showcasing customer relationship management ticketing tool operations. It provides information about satisfaction, new tickets, chats, calls, invoicing, tech support, sales, engineers, replies, etc. Want to ace your presentation in front of a live audience Our Dashboard Highlighting CRM Ticketing Tool Operations Ppt PowerPoint Presentation File Professional PDF can help you do that by engaging all the users towards you. Slidegeeks experts have put their efforts and expertise into creating these impeccable powerpoint presentations so that you can communicate your ideas clearly. Moreover, all the templates are customizable, and easy to edit and downloadable. Use these for both personal and commercial use.
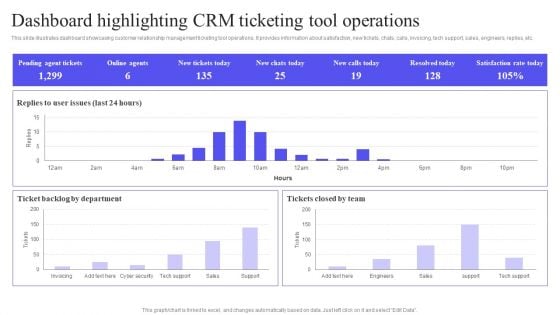
Dashboard Highlighting CRM Ticketing Tool Operations Diagrams PDF
This slide illustrates dashboard showcasing customer relationship management ticketing tool operations. It provides information about satisfaction, new tickets, chats, calls, invoicing, tech support, sales, engineers, replies, etc. Want to ace your presentation in front of a live audience Our Dashboard Highlighting CRM Ticketing Tool Operations Diagrams PDF can help you do that by engaging all the users towards you. Slidegeeks experts have put their efforts and expertise into creating these impeccable powerpoint presentations so that you can communicate your ideas clearly. Moreover, all the templates are customizable, and easy to edit and downloadable. Use these for both personal and commercial use.
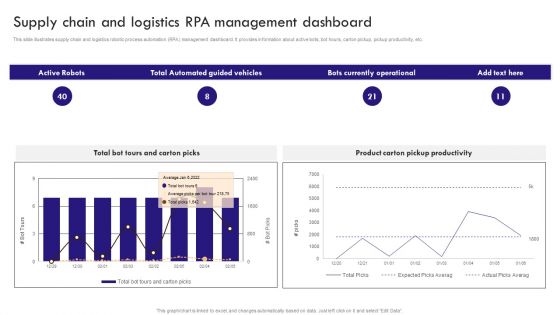
Implementing Robotic Process Supply Chain And Logistics RPA Management Microsoft PDF
Slidegeeks is here to make your presentations a breeze with Implementing Robotic Process Supply Chain And Logistics RPA Management Microsoft PDF With our easy-to-use and customizable templates, you can focus on delivering your ideas rather than worrying about formatting. With a variety of designs to choose from, youre sure to find one that suits your needs. And with animations and unique photos, illustrations, and fonts, you can make your presentation pop. So whether youre giving a sales pitch or presenting to the board, make sure to check out Slidegeeks first.


 Continue with Email

 Home
Home


