Product Concept
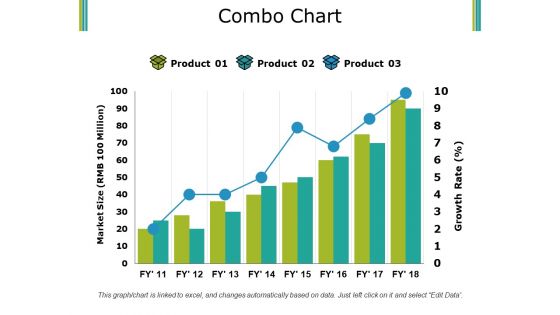
Combo Chart Ppt PowerPoint Presentation Pictures Summary
This is a combo chart ppt powerpoint presentation pictures summary. This is a three stage process. The stages in this process are product, market size, growth rate, bar graph, success.
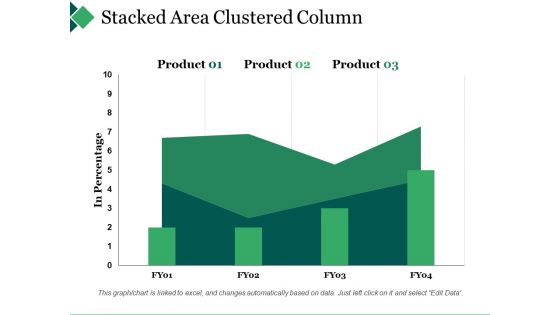
Stacked Area Clustered Column Ppt PowerPoint Presentation Gallery Gridlines
This is a stacked area clustered column ppt powerpoint presentation gallery gridlines. This is a three stage process. The stages in this process are bar graph, product, in percentage.
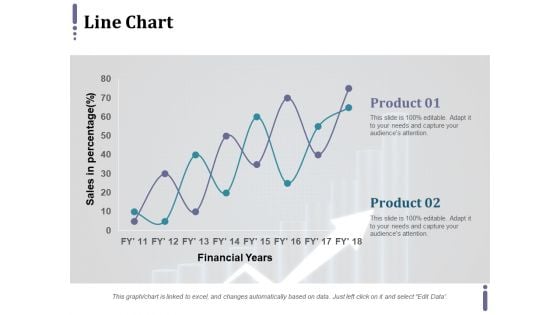
Line Chart Ppt PowerPoint Presentation Infographic Template Master Slide
This is a line chart ppt powerpoint presentation infographic template master slide. This is a two stage process. The stages in this process are product, financial years, sales in percentage.
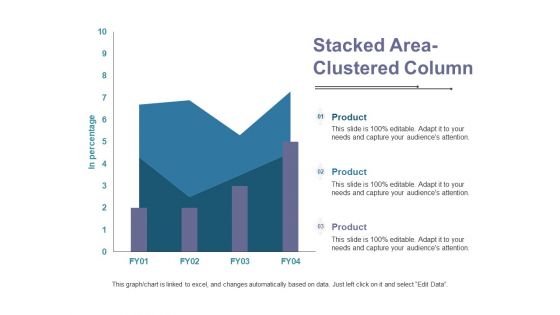
Stacked Area Clustered Column Ppt PowerPoint Presentation Outline Diagrams
This is a stacked area clustered column ppt powerpoint presentation outline diagrams. This is a three stage process. The stages in this process are product, in percentage, area chart.
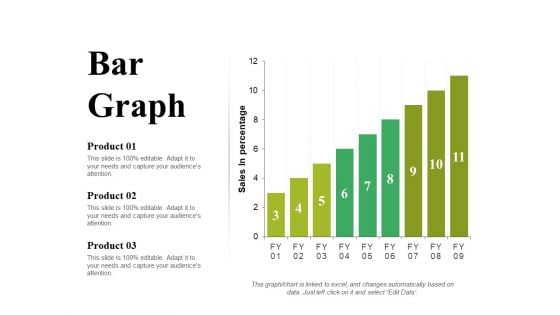
Bar Graph Ppt PowerPoint Presentation Portfolio Slide Portrait
This is a bar graph ppt powerpoint presentation portfolio slide portrait. This is a three stage process. The stages in this process are product, sales in percentage, bar graph, growth, success.
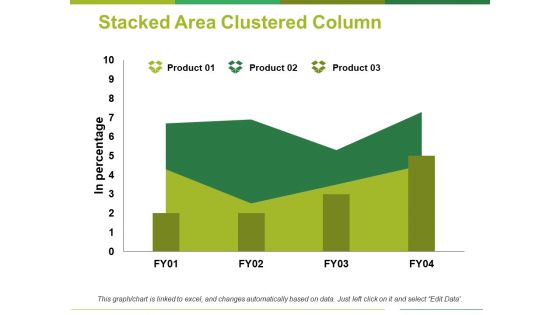
Stacked Area Clustered Column Ppt PowerPoint Presentation Professional Clipart
This is a stacked area clustered column ppt powerpoint presentation professional clipart. This is a three stage process. The stages in this process are product, in percentage, area chart.

Clustered Column Ppt PowerPoint Presentation Infographic Template Backgrounds
This is a clustered column ppt powerpoint presentation infographic template backgrounds. This is a two stage process. The stages in this process are sales in percentage, financial year, product.
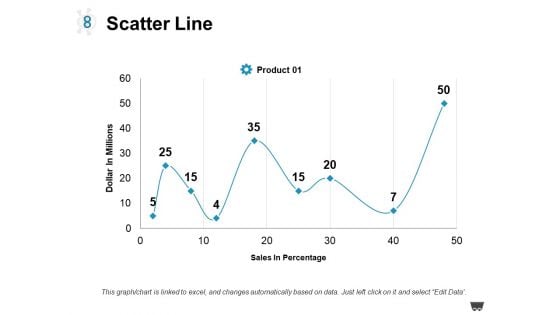
Scatter Line Ppt PowerPoint Presentation Styles Graphics Pictures
This is a scatter line ppt powerpoint presentation styles graphics pictures. This is a one stage process. The stages in this process are product, dollar in millions, sales in percentage.
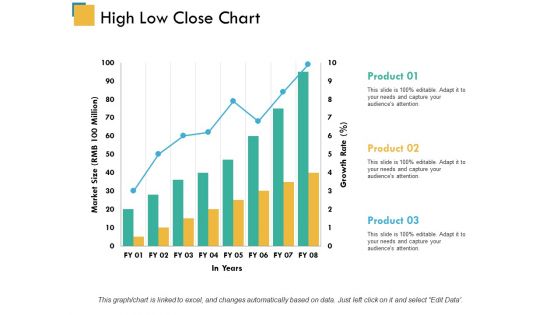
High Low Close Chart Ppt PowerPoint Presentation Model Inspiration
This is a high low close chart ppt powerpoint presentation model inspiration. This is a three stage process. The stages in this process are product, market size, in years.
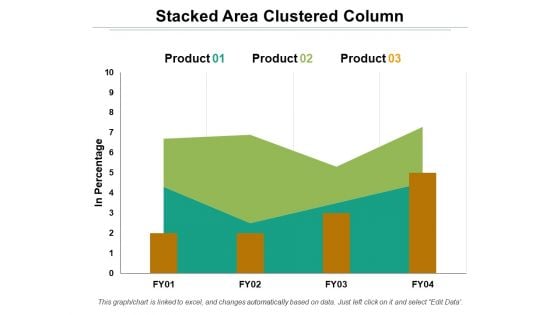
Stacked Area Clustered Column Ppt PowerPoint Presentation Layouts Templates
This is a stacked area clustered column ppt powerpoint presentation layouts templates. This is a three stage process. The stages in this process are product, in percentage, area chart.
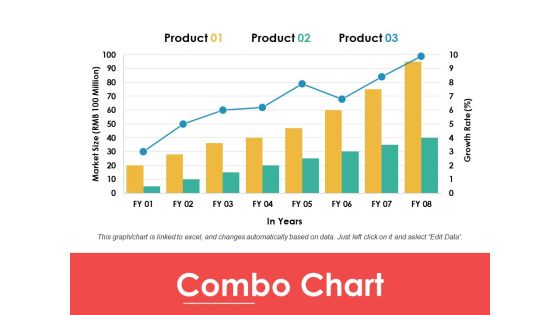
Combo Chart Ppt PowerPoint Presentation Pictures Objects
This is a combo chart ppt powerpoint presentation pictures objects. This is a three stage process. The stages in this process are product, combo chart, in years, market size.
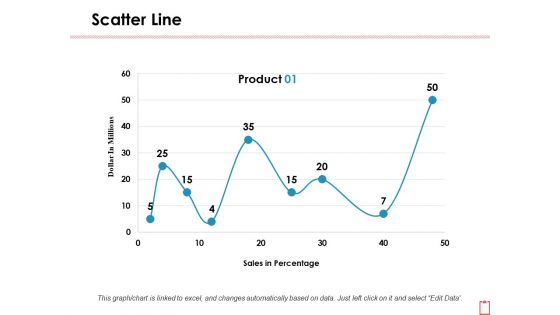
Scatter Line Ppt PowerPoint Presentation Infographics Background Images
This is a scatter line ppt powerpoint presentation infographics background images. This is a one stage process. The stages in this process are dollar in millions, product, sales in percentage.
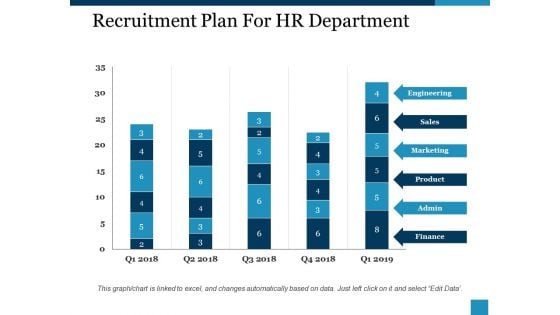
Recruitment Plan For Hr Department Ppt PowerPoint Presentation Show
This is a recruitment plan for hr department ppt powerpoint presentation show. This is a five stage process. The stages in this process are engineering, sales, marketing, product, finance.
Area Chart Ppt PowerPoint Presentation Icon Summary
This is a area chart ppt powerpoint presentation icon summary. This is a two stage process. The stages in this process are financial year, area chart, in percentage, product.
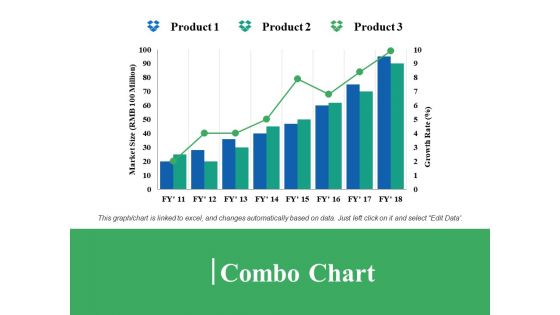
Combo Chart Ppt PowerPoint Presentation Model Microsoft
This is a combo chart ppt powerpoint presentation model microsoft. This is a three stage process. The stages in this process are combo chart, product, market size, growth rate.
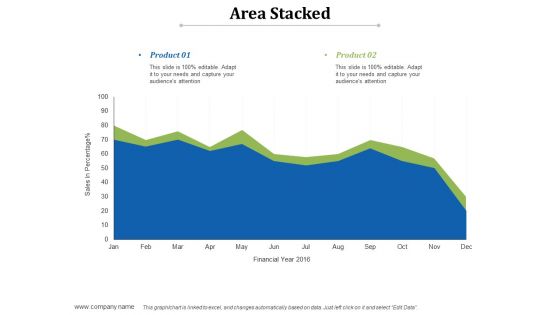
Area Stacked Ppt PowerPoint Presentation Infographics Shapes
This is a area stacked ppt powerpoint presentation infographics shapes. This is a two stage process. The stages in this process are product, area stacked, sales in percentage, financial year.
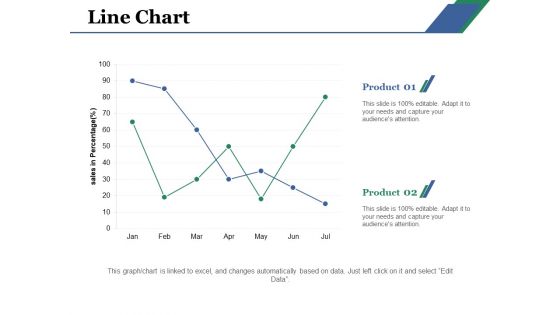
Line Chart Ppt PowerPoint Presentation Layouts Example File
This is a line chart ppt powerpoint presentation layouts example file. This is a two stage process. The stages in this process are line chart, product, business, sales, analysis.
Clustered Column Ppt PowerPoint Presentation Icon Objects
This is a clustered column ppt powerpoint presentation icon objects. This is a two stage process. The stages in this process are clustered column, product, growth, finance, bar graph.
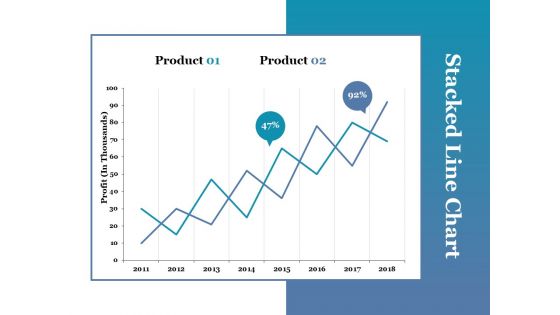
Stacked Line Chart Ppt PowerPoint Presentation Portfolio Picture
This is a stacked line chart ppt powerpoint presentation portfolio picture. This is a two stage process. The stages in this process are stacked line chart, product, profit, growth.
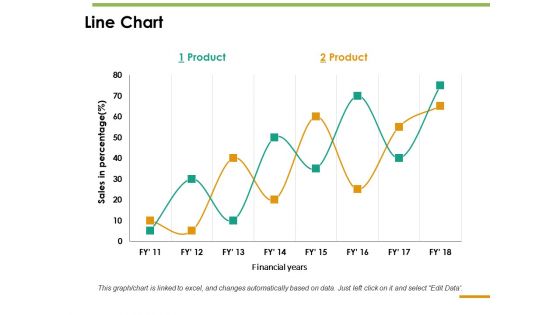
Line Chart Ppt PowerPoint Presentation Inspiration Guide
This is a line chart ppt powerpoint presentation inspiration guide. This is a two stage process. The stages in this process are line chart, sales in percentage, product, financial years.
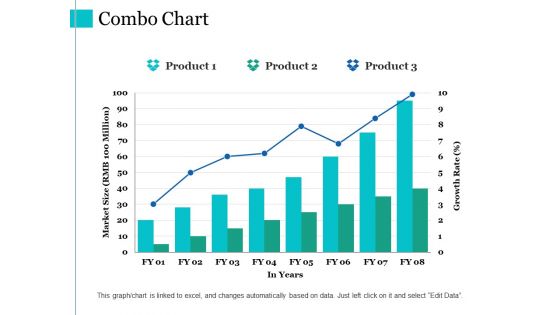
Combo Chart Ppt PowerPoint Presentation Gallery Diagrams
This is a combo chart ppt powerpoint presentation gallery diagrams. This is a three stage process. The stages in this process are combo chart, market size, product, in years, growth rate.
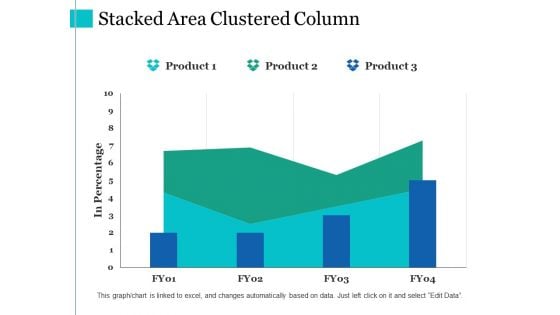
Stacked Area Clustered Column Ppt PowerPoint Presentation Summary Slides
This is a stacked area clustered column ppt powerpoint presentation summary slides. This is a three stage process. The stages in this process are product, in percentage, financial year, bar graph.
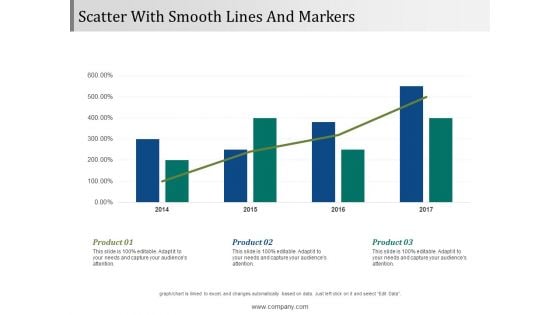
Scatter With Smooth Lines And Markers Ppt PowerPoint Presentation Pictures Deck
This is a scatter with smooth lines and markers ppt powerpoint presentation pictures deck. This is a three stage process. The stages in this process are product, finance, management, business, growth.
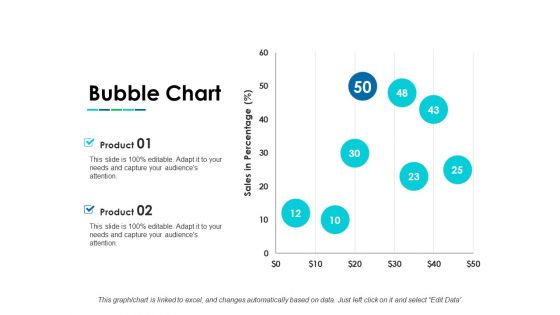
Bubble Chart Ppt PowerPoint Presentation Infographic Template Layouts
This is a bubble chart ppt powerpoint presentation infographic template layouts. This is a two stage process. The stages in this process are bubble chart, product, sales in percentage, growth.

Column Chart Ppt PowerPoint Presentation Gallery Background Images
This is a column chart ppt powerpoint presentation gallery background images. This is a two stage process. The stages in this process are column chart, product, year, growth, expenditure.
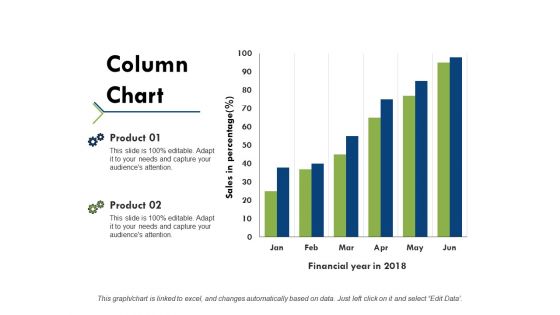
Column Chart Ppt PowerPoint Presentation Portfolio Example Topics
This is a column chart ppt powerpoint presentation portfolio example topics. This is a two stage process. The stages in this process are product, financial year, sales in percentage, column chart.
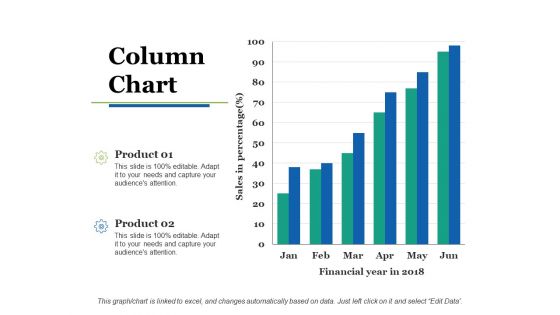
Column Chart Ppt PowerPoint Presentation Slides Show
This is a column chart ppt powerpoint presentation slides show. This is a two stage process. The stages in this process are column chart, product, sales in percentage, financial year, growth.
Combo Chart Ppt PowerPoint Presentation Icon Introduction
This is a combo chart ppt powerpoint presentation icon introduction. This is a three stage process. The stages in this process are combo chart, product, growth rate, market size, growth.
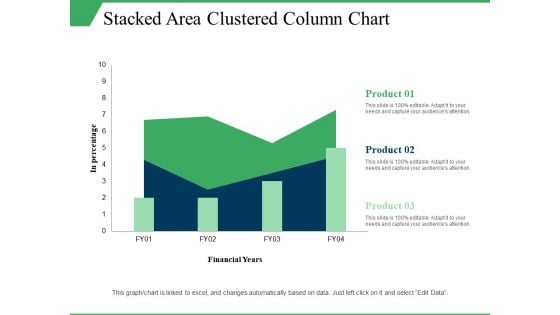
Stacked Area Clustered Column Chart Ppt PowerPoint Presentation Visual Aids Model
This is a stacked area clustered column chart ppt powerpoint presentation visual aids model. This is a three stage process. The stages in this process are in percentage, product, financial years, growth, column chart.
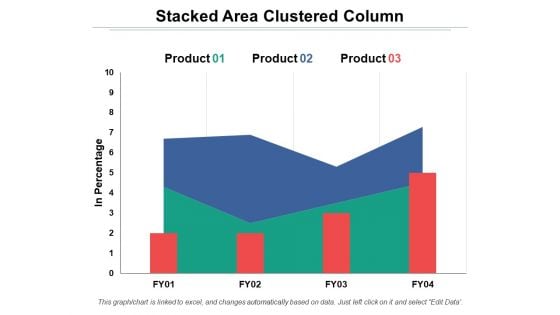
Stacked Area Clustered Column Ppt PowerPoint Presentation Professional Influencers
This is a stacked area clustered column ppt powerpoint presentation professional influencers. This is a three stage process. The stages in this process are stacked area clustered column, percentage, product, year.
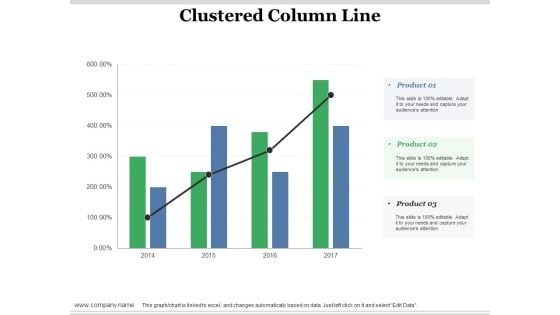
Clustered Column Line Ppt PowerPoint Presentation Professional
This is a clustered column line ppt powerpoint presentation professional. This is a three stage process. The stages in this process are clustered column line, product, bar graph, marketing, finance.
Area Chart Ppt PowerPoint Presentation Inspiration Icons Ppt PowerPoint Presentation Professional File Formats
This is a area chart ppt powerpoint presentation inspiration icons ppt powerpoint presentation professional file formats. This is a two stage process. The stages in this process are area chart, product, percentage, business, growth.
Stacked Column Ppt PowerPoint Presentation Icon Deck Ppt PowerPoint Presentation Pictures Infographic Template
This is a stacked column ppt powerpoint presentation icon deck ppt powerpoint presentation pictures infographic template. This is a two stage process. The stages in this process are stacked column, sales, percentage, product, growth.
Column Chart Ppt PowerPoint Presentation Icon Show
This is a column chart ppt powerpoint presentation icon show. This is a two stage process. The stages in this process are column chart, product, years, bar graph, growth.
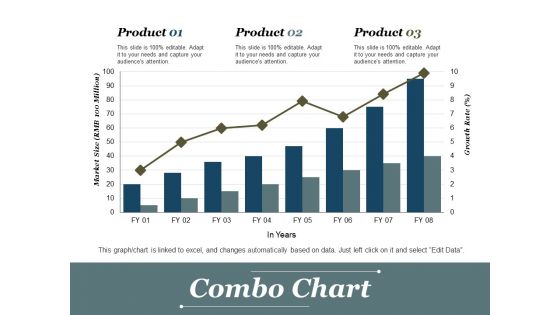
Combo Chart Ppt PowerPoint Presentation Slides Outline
This is a combo chart ppt powerpoint presentation slides outline. This is a three stage process. The stages in this process are combo chart, growth, product, financial year, business.
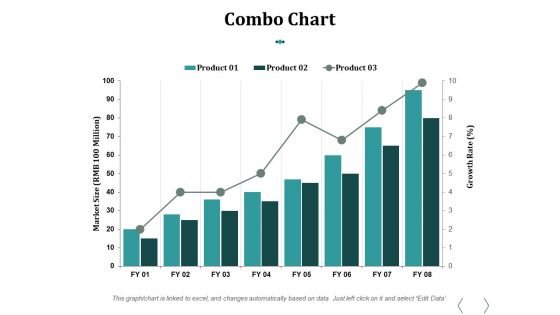
Combo Chart Ppt PowerPoint Presentation Summary Graphic Images
This is a combo chart ppt powerpoint presentation summary graphic images. This is a three stage process. The stages in this process are combo chart, product, growth, marketing, business.
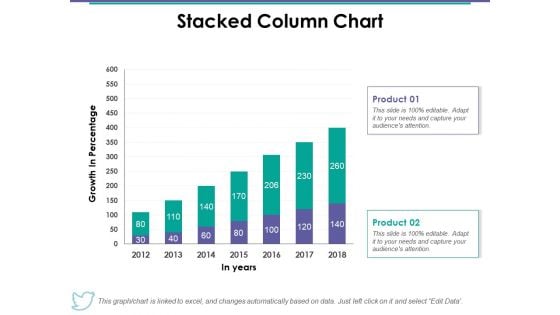
Stacked Column Chart Ppt PowerPoint Presentation Summary Gallery
This is a stacked column chart ppt powerpoint presentation summary gallery. This is a two stage process. The stages in this process are stacked column chart, product, in years, growth, percentage.
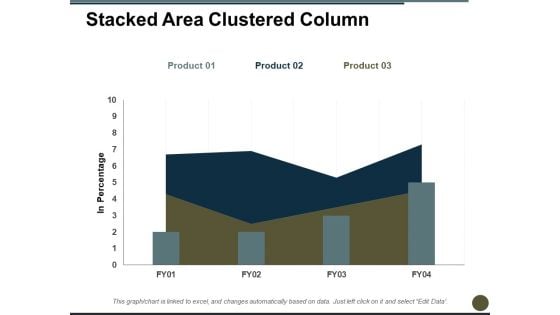
Stacked Area Clustered Column Ppt PowerPoint Presentation Professional Graphics
This is a stacked area clustered column ppt powerpoint presentation professional graphics. This is a three stage process. The stages in this process are in percentage, bar chart, product, growth, year.
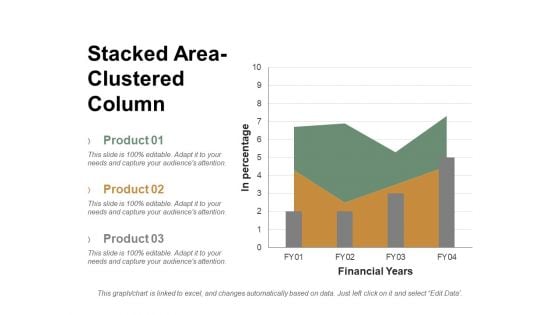
Stacked Area Clustered Column Ppt PowerPoint Presentation Inspiration Slide Portrait
This is a stacked area clustered column ppt powerpoint presentation inspiration slide portrait. This is a three stage process. The stages in this process are product, finance, business, management.
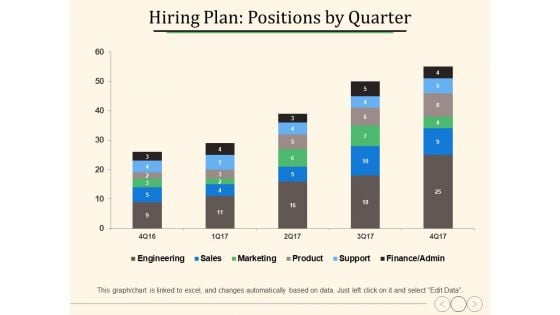
Hiring Plan Positions By Quarter Ppt PowerPoint Presentation Slides Deck
This is a hiring plan positions by quarter ppt powerpoint presentation slides deck. This is a five stage process. The stages in this process are percentage, product, business, management.
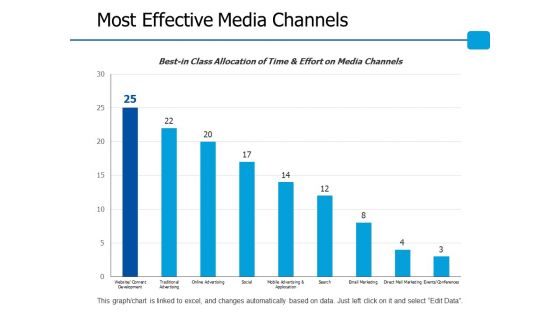
Most Effective Media Channels Ppt PowerPoint Presentation Model Graphic Images
This is a most effective media channels ppt powerpoint presentation model graphic images. This is a nine stage process. The stages in this process are business, management, marketing, percentage, product.
Application Development Gear In Human Hand Ppt PowerPoint Presentation Model Smartart
This is a application development gear in human hand ppt powerpoint presentation model smartart. This is a four stage process. The stages in this process are tool development, tool production, tool management.
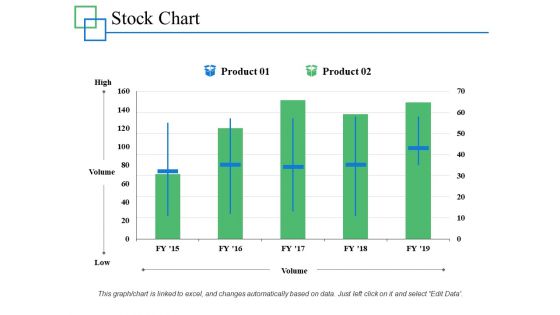
Stock Chart Management Investment Ppt PowerPoint Presentation Infographics Professional
This is a stock chart management investment ppt powerpoint presentation infographics professional. This is a two stage process. The stages in this process are marketing, business, management, percentage, product.
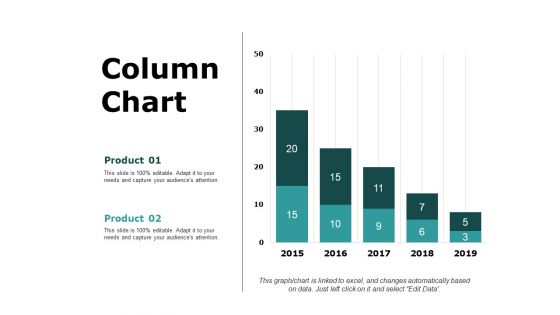
Column Chart Finance Marketing Ppt PowerPoint Presentation Model Example Introduction
This is a column chart finance marketing ppt powerpoint presentation model example introduction. This is a two stage process. The stages in this process are business, management, marketing, percentage, product.
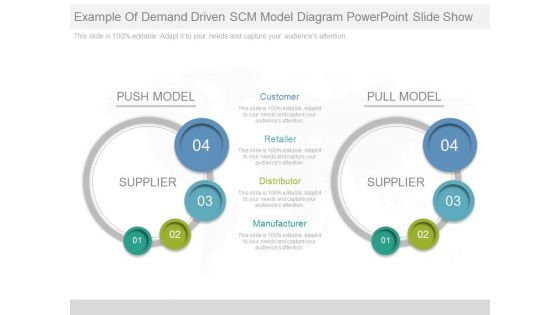
Example Of Demand Driven Scm Model Diagram Powerpoint Slide Show
This is a example of demand driven scm model diagram powerpoint slide show. This is a four stage process. The stages in this process are push model, supplier, pull model, customer, retailer, distributor, manufacturer.
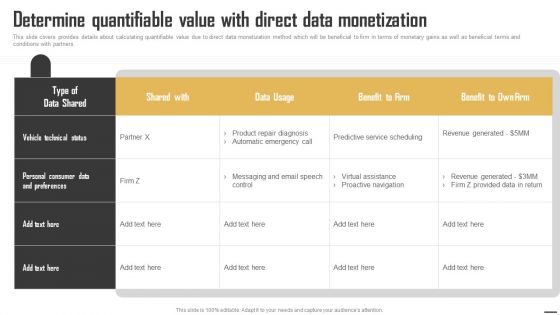
Data Monetization And Management Determine Quantifiable Value With Direct Data Ideas PDF
This slide covers provides details about calculating quantifiable value due to direct data monetization method which will be beneficial to firm in terms of monetary gains as well as beneficial terms and conditions with partners. Are you in need of a template that can accommodate all of your creative concepts This one is crafted professionally and can be altered to fit any style. Use it with Google Slides or PowerPoint. Include striking photographs, symbols, depictions, and other visuals. Fill, move around, or remove text boxes as desired. Test out color palettes and font mixtures. Edit and save your work, or work with colleagues. Download Data Monetization And Management Determine Quantifiable Value With Direct Data Ideas PDF and observe how to make your presentation outstanding. Give an impeccable presentation to your group and make your presentation unforgettable.
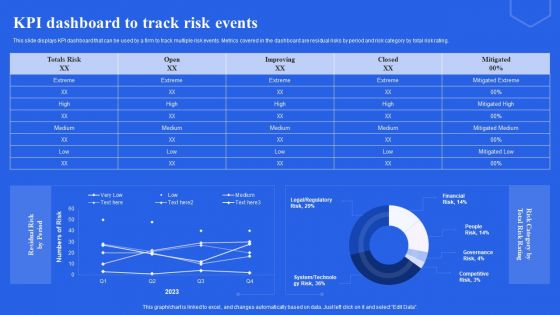
KPI Dashboard To Track Risk Events Ppt Infographic Template Layout Ideas PDF
This slide displays KPI dashboard that can be used by a firm to track multiple risk events. Metrics covered in the dashboard are residual risks by period and risk category by total risk rating. Are you in need of a template that can accommodate all of your creative concepts This one is crafted professionally and can be altered to fit any style. Use it with Google Slides or PowerPoint. Include striking photographs, symbols, depictions, and other visuals. Fill, move around, or remove text boxes as desired. Test out color palettes and font mixtures. Edit and save your work, or work with colleagues. Download KPI Dashboard To Track Risk Events Ppt Infographic Template Layout Ideas PDF and observe how to make your presentation outstanding. Give an impeccable presentation to your group and make your presentation unforgettable.
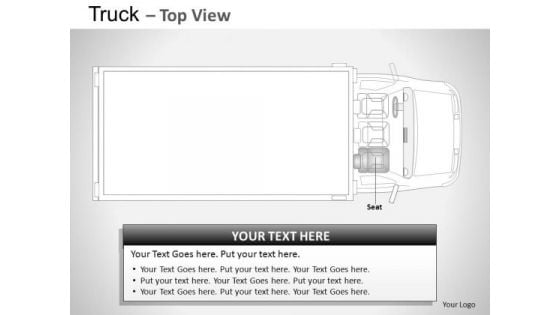
Facilities Red Truck Top View PowerPoint Slides And Ppt Diagram Templates
Facilities Red Truck Top View PowerPoint Slides And PPT Diagram Templates-These high quality, editable pre-designed powerpoint slides have been carefully created by our professional team to help you impress your audience. Each graphic in every slide is vector based and is 100% editable in powerpoint. Each and every property of any slide - color, size, shading etc can be modified to build an effective powerpoint presentation. Use these slides to convey complex business concepts in a simplified manner. Any text can be entered at any point in the powerpoint slide. Simply DOWNLOAD, TYPE and PRESENT! Illustrate goals with our Facilities Red Truck Top View PowerPoint Slides And Ppt Diagram Templates. Download without worries with our money back guaranteee.
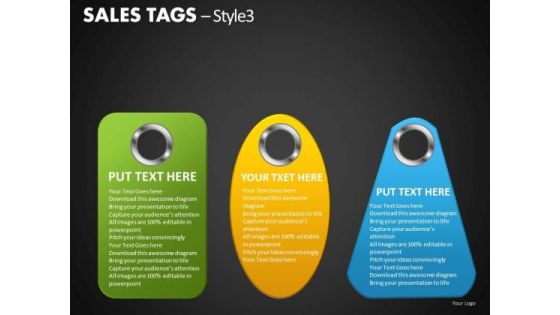
Sales And Marketing Tags PowerPoint Slides And Ppt Diagram Templates
Sales and Marketing Tags PowerPoint Slides And PPT Diagram Templates-These high quality, editable pre-designed powerpoint slides have been carefully created by our professional team to help you impress your audience. Each graphic in every slide is vector based and is 100% editable in powerpoint. Each and every property of any slide - color, size, shading etc can be modified to build an effective powerpoint presentation. Use these slides to convey complex business concepts in a simplified manner. Any text can be entered at any point in the powerpoint slide. Simply DOWNLOAD, TYPE and PRESENT! Classify goals with our Sales And Marketing Tags PowerPoint Slides And Ppt Diagram Templates. Download without worries with our money back guaranteee.
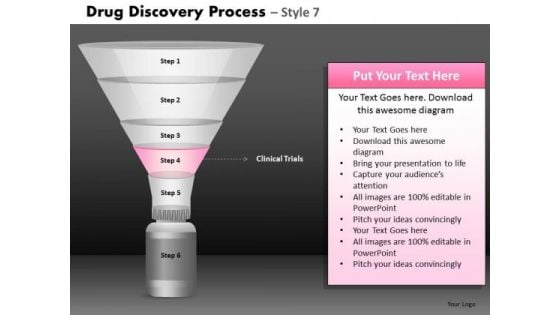
Editable Stages Sales Marketing Funnel PowerPoint Slides Ppt Templates
Editable Stages Sales Marketing Funnel PowerPoint Slides PPT Templates-These high quality, editable pre-designed powerpoint slides have been carefully created by our professional team to help you impress your audience. Each graphic in every slide is vector based and is 100% editable in powerpoint. Each and every property of any slide - color, size, shading etc can be modified to build an effective powerpoint presentation. Use these slides to convey complex business concepts in a simplified manner. Any text can be entered at any point in the powerpoint slide. Simply DOWNLOAD, TYPE and PRESENT! Design goals with our Editable Stages Sales Marketing Funnel PowerPoint Slides Ppt Templates. Download without worries with our money back guaranteee.
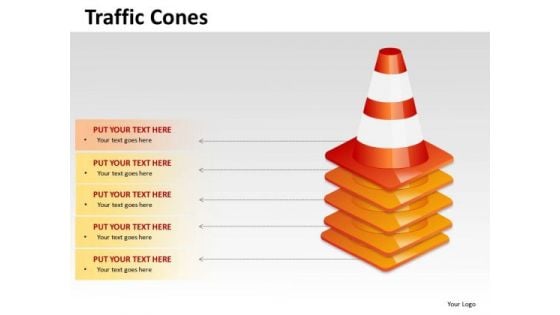
Ppt Graphics Stacked Traffic Cones PowerPoint Slides And Ppt Diagram Templates
PPT Graphics Stacked Traffic cones PowerPoint Slides And PPT Diagram Templates These high quality, editable pre-designed powerpoint slides have been carefully created by our professional team to help you impress your audience. Each graphic in every slide is vector based and is 100% editable in powerpoint. Each and every property of any slide - color, size, shading etc can be modified to build an effective powerpoint presentation. Use these slides to convey complex business concepts in a simplified manner. Any text can be entered at any point in the powerpoint slide. Simply DOWNLOAD, TYPE and PRESENT! Ascertain goals with our Ppt Graphics Stacked Traffic Cones PowerPoint Slides And Ppt Diagram Templates. Download without worries with our money back guaranteee.

Comprehensive Strategic Plan For Strengthening Shareholder Relations Complete Deck With Slides
Using this ready-made PowerPoint slide, you can incorporate your own data to make an impact with your business innovation and clarity of goals. Use this brilliantly designed Comprehensive Strategic Plan For Strengthening Shareholder Relations Complete Deck With Slides to showcase how ultimately all business concepts are related. This presentation template can also be used to record resource allocation in a visual form. The fifty six-Slide Comprehensive Strategic Plan For Strengthening Shareholder Relations Complete Deck With Slides is suitable for all your business needs, where you need to make sure that all bases are covered. Download this PPT template now to start a journey on your chosen business, with customer satisfaction the key aim. Our Comprehensive Strategic Plan For Strengthening Shareholder Relations Complete Deck With Slides are topically designed to provide an attractive backdrop to any subject. Use them to look like a presentation pro.

Workforce Competency Enhancement Through Web Based Learning DTE CD V
Silicon Photonics SiPH IT Ppt Sample

Types Of Electric Vehicles A Complete Guide Ppt Powerpoint

Nanotechnology Transformation Revamping Modern Business Landscape Ppt Slide

Workforce Planning And Hiring Strategy By Developing Employee Value Proposition Complete Deck
Using this ready-made PowerPoint slide, you can incorporate your own data to make an impact with your business innovation and clarity of goals. Use this brilliantly designed Workforce Planning And Hiring Strategy By Developing Employee Value Proposition Complete Deck to showcase how ultimately all business concepts are related. This presentation template can also be used to record resource allocation in a visual form. The sixty nine Slide Workforce Planning And Hiring Strategy By Developing Employee Value Proposition Complete Deck is suitable for all your business needs, where you need to make sure that all bases are covered. Download this PPT template now to start a journey on your chosen business, with customer satisfaction the key aim.
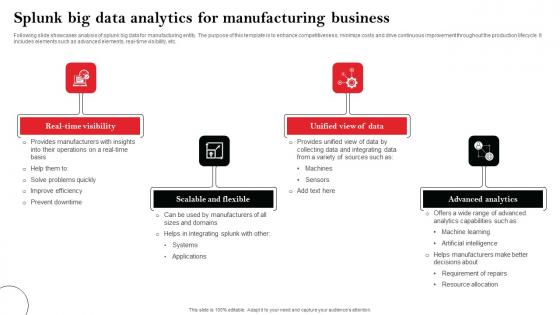
Splunk Big Data Analytics For Manufacturing Business Ideas Pdf
Following slide showcases analysis of splunk big data for manufacturing entity. The purpose of this template is to enhance competitiveness, minimize costs and drive continuous improvement throughout the production lifecycle. It includes elements such as advanced elements, real-time visibility, etc. Pitch your topic with ease and precision using this Splunk Big Data Analytics For Manufacturing Business Ideas Pdf This layout presents information on Real-Time Visibility, Scalable And Flexible, Advanced Analytics It is also available for immediate download and adjustment. So, changes can be made in the color, design, graphics or any other component to create a unique layout. Following slide showcases analysis of splunk big data for manufacturing entity. The purpose of this template is to enhance competitiveness, minimize costs and drive continuous improvement throughout the production lifecycle. It includes elements such as advanced elements, real-time visibility, etc.
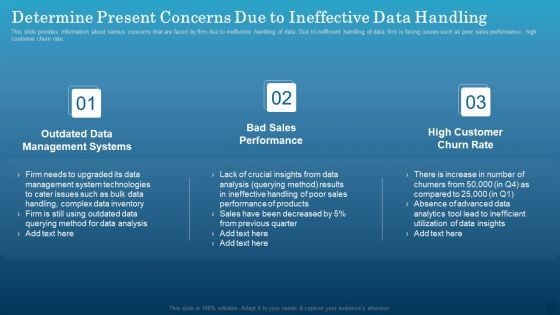
Data Monetization Approach To Drive Business Growth Determine Present Concerns Due To Ineffective Data Handling Rules PDF
This slide provides information about various concerns that are faced by firm due to ineffective handling of data. Due to inefficient handling of data, firm is facing issues such as poor sales performance, high customer churn rate. Are you in need of a template that can accommodate all of your creative concepts This one is crafted professionally and can be altered to fit any style. Use it with Google Slides or PowerPoint. Include striking photographs, symbols, depictions, and other visuals. Fill, move around, or remove text boxes as desired. Test out color palettes and font mixtures. Edit and save your work, or work with colleagues. Download Data Monetization Approach To Drive Business Growth Determine Present Concerns Due To Ineffective Data Handling Rules PDF and observe how to make your presentation outstanding. Give an impeccable presentation to your group and make your presentation unforgettable.
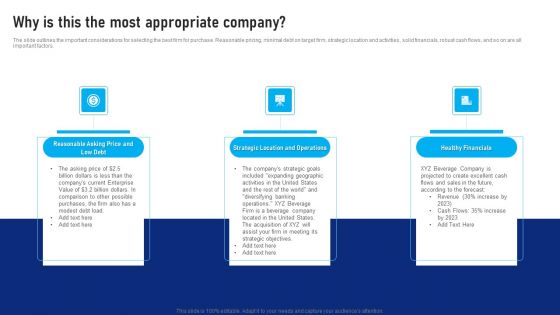
Buy Side Advisory Services In M And A Why Is This The Most Appropriate Company Inspiration PDF
The slide outlines the important considerations for selecting the best firm for purchase. Reasonable pricing, minimal debt on target firm, strategic location and activities, solid financials, robust cash flows, and so on are all important factors.Are you in need of a template that can accommodate all of your creative concepts This one is crafted professionally and can be altered to fit any style. Use it with Google Slides or PowerPoint. Include striking photographs, symbols, depictions, and other visuals. Fill, move around, or remove text boxes as desired. Test out color palettes and font mixtures. Edit and save your work, or work with colleagues. Download Buy Side Advisory Services In M And A Why Is This The Most Appropriate Company Inspiration PDF and observe how to make your presentation outstanding. Give an impeccable presentation to your group and make your presentation unforgettable.


 Continue with Email

 Home
Home


