Profit Icon
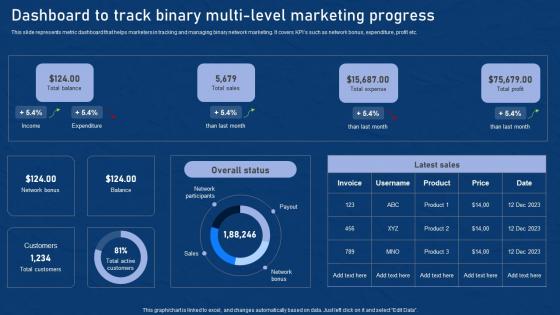
Dashboard To Track Binary Multi Level Effective Network Marketing Promotion Tactics Infographics Pdf
This slide represents metric dashboard that helps marketers in tracking and managing binary network marketing. It covers KPIs such as network bonus, expenditure, profit etc. Here you can discover an assortment of the finest PowerPoint and Google Slides templates. With these templates, you can create presentations for a variety of purposes while simultaneously providing your audience with an eye catching visual experience. Download Dashboard To Track Binary Multi Level Effective Network Marketing Promotion Tactics Infographics Pdf to deliver an impeccable presentation. These templates will make your job of preparing presentations much quicker, yet still, maintain a high level of quality. Slidegeeks has experienced researchers who prepare these templates and write high quality content for you. Later on, you can personalize the content by editing the Dashboard To Track Binary Multi Level Effective Network Marketing Promotion Tactics Infographics Pdf. This slide represents metric dashboard that helps marketers in tracking and managing binary network marketing. It covers KPIs such as network bonus, expenditure, profit etc.
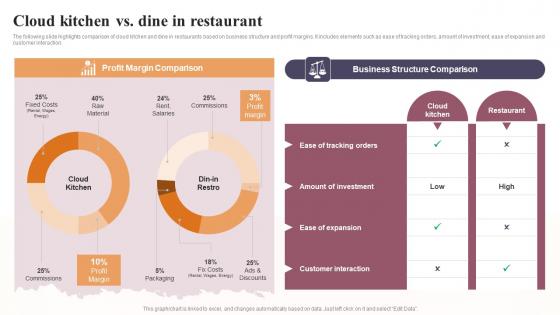
Cloud Kitchen Vs Dine In Restaurant Global Virtual Restaurant Designs Pdf
The following slide highlights comparison of cloud kitchen and dine in restaurants based on business structure and profit margins. It includes elements such as ease of tracking orders, amount of investment, ease of expansion and customer interaction. The best PPT templates are a great way to save time, energy, and resources. Slidegeeks have 100 percent editable powerpoint slides making them incredibly versatile. With these quality presentation templates, you can create a captivating and memorable presentation by combining visually appealing slides and effectively communicating your message. Download Cloud Kitchen Vs Dine In Restaurant Global Virtual Restaurant Designs Pdf from Slidegeeks and deliver a wonderful presentation. The following slide highlights comparison of cloud kitchen and dine in restaurants based on business structure and profit margins. It includes elements such as ease of tracking orders, amount of investment, ease of expansion and customer interaction.

KPI Dashboard For Estimating Monthly Cash Flow Infographics Pdf
Following slide demonstrates KPI dashboard to forecast monthly business money flow for cash flow management planning. It includes components such as projected profit before tax, net operating cash flow, net financial cash flow, net investing cash flow, etc. Showcasing this set of slides titled KPI Dashboard For Estimating Monthly Cash Flow Infographics Pdf. The topics addressed in these templates are KPI Dashboard, Estimating Monthly Cash Flow, Net Financial Cash Flow. All the content presented in this PPT design is completely editable. Download it and make adjustments in color, background, font etc. as per your unique business setting. Following slide demonstrates KPI dashboard to forecast monthly business money flow for cash flow management planning. It includes components such as projected profit before tax, net operating cash flow, net financial cash flow, net investing cash flow, etc.
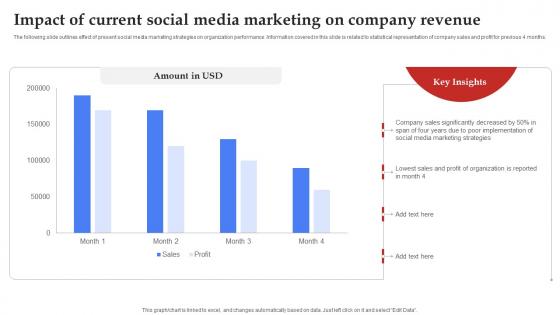
Facebook Marketing Plan Impact Of Current Social Media Marketing Strategy SS V
Cryptocurrency Portfolio Tracking Dashboard Summary Cryptocurrency Management With Blockchain
This slide represents the cryptocurrency performance indicators for the individual. The key components include invested money, profit and loss, rate of investment ROI, current valuation of money, etc.Formulating a presentation can take up a lot of effort and time, so the content and message should always be the primary focus. The visuals of the PowerPoint can enhance the presenters message, so our Cryptocurrency Portfolio Tracking Dashboard Summary Cryptocurrency Management With Blockchain was created to help save time. Instead of worrying about the design, the presenter can concentrate on the message while our designers work on creating the ideal templates for whatever situation is needed. Slidegeeks has experts for everything from amazing designs to valuable content, we have put everything into Cryptocurrency Portfolio Tracking Dashboard Summary Cryptocurrency Management With Blockchain. This slide represents the cryptocurrency performance indicators for the individual. The key components include invested money, profit and loss, rate of investment ROI, current valuation of money, etc.
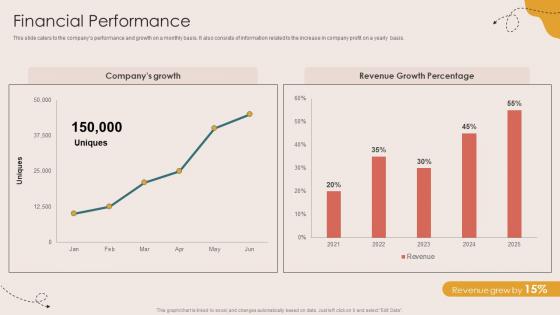
Financial Performance Children Events Listing Investor Funding Elevator Pitch Deck
This slide caters to the companys performance and growth on a monthly basis. It also consists of information related to the increase in company profit on a yearly basis. Present like a pro with Financial Performance Children Events Listing Investor Funding Elevator Pitch Deck. Create beautiful presentations together with your team, using our easy-to-use presentation slides. Share your ideas in real-time and make changes on the fly by downloading our templates. So whether you are in the office, on the go, or in a remote location, you can stay in sync with your team and present your ideas with confidence. With Slidegeeks presentation got a whole lot easier. Grab these presentations today. This slide caters to the companys performance and growth on a monthly basis. It also consists of information related to the increase in company profit on a yearly basis.
Financial Performance Virtual Learning Environments VLE Investor Funding Elevator Pitch Deck
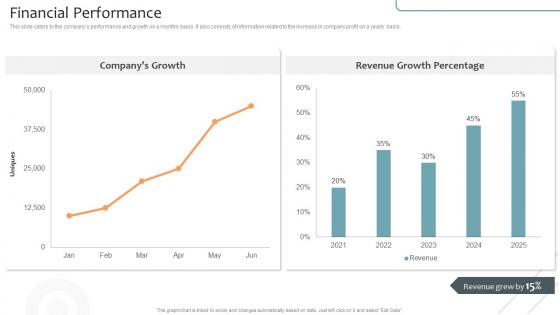
This slide caters to the companys performance and growth on a monthly basis. It also consists of information related to the increase in company profit on a yearly basis. Present like a pro with Financial Performance Virtual Learning Environments VLE Investor Funding Elevator Pitch Deck. Create beautiful presentations together with your team, using our easy-to-use presentation slides. Share your ideas in real-time and make changes on the fly by downloading our templates. So whether you are in the office, on the go, or in a remote location, you can stay in sync with your team and present your ideas with confidence. With Slidegeeks presentation got a whole lot easier. Grab these presentations today. This slide caters to the companys performance and growth on a monthly basis. It also consists of information related to the increase in company profit on a yearly basis.
Key Ratios Vehicle Manufacturer Company Profile PPT Template CP SS V
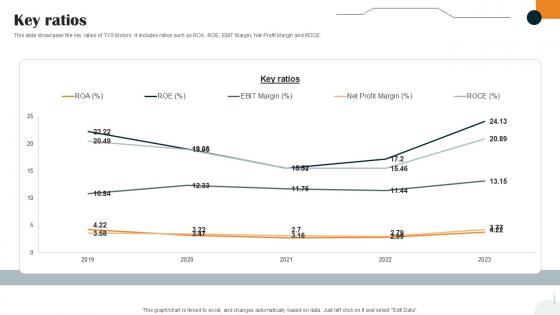
This slide showcases the key ratios of TVS Motors. It includes ratios such as ROA, ROE, EBIT Margin, Net Profit Margin and ROCE. Crafting an eye-catching presentation has never been more straightforward. Let your presentation shine with this tasteful yet straightforward Key Ratios Vehicle Manufacturer Company Profile PPT Template CP SS V template. It offers a minimalistic and classy look that is great for making a statement. The colors have been employed intelligently to add a bit of playfulness while still remaining professional. Construct the ideal Key Ratios Vehicle Manufacturer Company Profile PPT Template CP SS V that effortlessly grabs the attention of your audience Begin now and be certain to wow your customers This slide showcases the key ratios of TVS Motors. It includes ratios such as ROA, ROE, EBIT Margin, Net Profit Margin and ROCE.
Cost Analysis With Overall Budget Schedule Management Techniques PPT PowerPoint
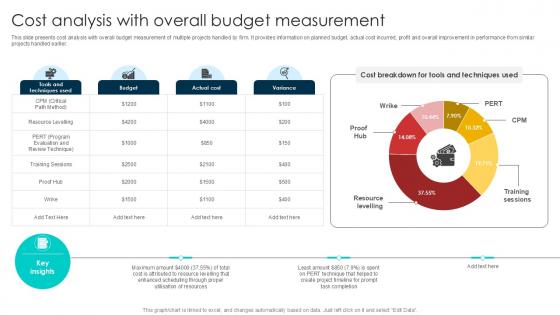
This slide presents cost analysis with overall budget measurement of multiple projects handled by firm. It provides information on planned budget, actual cost incurred, profit and overall improvement in performance from similar projects handled earlier. From laying roadmaps to briefing everything in detail, our templates are perfect for you. You can set the stage with your presentation slides. All you have to do is download these easy-to-edit and customizable templates. Cost Analysis With Overall Budget Schedule Management Techniques PPT PowerPoint will help you deliver an outstanding performance that everyone would remember and praise you for. Do download this presentation today. This slide presents cost analysis with overall budget measurement of multiple projects handled by firm. It provides information on planned budget, actual cost incurred, profit and overall improvement in performance from similar projects handled earlier.
Income Statement Highlighting Companys Financial Performance Pictures PDF
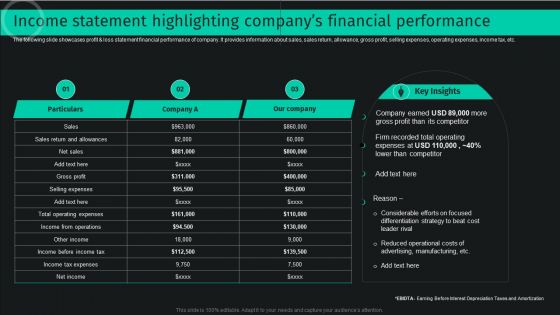
The following slide showcases profit and loss statement financial performance of company. It provides information about sales, sales return, allowance, gross profit, selling expenses, operating expenses, income tax, etc. Do you know about Slidesgeeks Income Statement Highlighting Companys Financial Performance Pictures PDF These are perfect for delivering any kind od presentation. Using it, create PowerPoint presentations that communicate your ideas and engage audiences. Save time and effort by using our pre designed presentation templates that are perfect for a wide range of topic. Our vast selection of designs covers a range of styles, from creative to business, and are all highly customizable and easy to edit. Download as a PowerPoint template or use them as Google Slides themes.
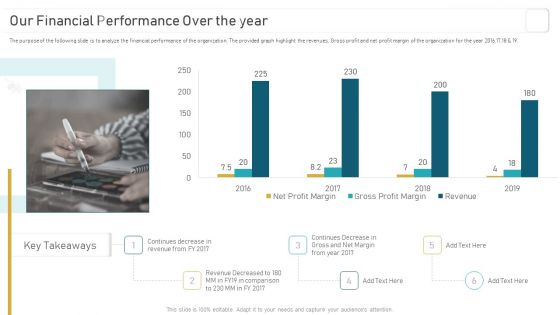
Deploying And Managing Recurring Our Financial Performance Over The Year Infographics PDF
The purpose of the following slide is to analyze the financial performance of the organization. The provided graph highlight the revenues, Gross profit and net profit margin of the organization for the year 2016,17,18 and 19. If you are looking for a format to display your unique thoughts, then the professionally designed Deploying And Managing Recurring Our Financial Performance Over The Year Infographics PDF is the one for you. You can use it as a Google Slides template or a PowerPoint template. Incorporate impressive visuals, symbols, images, and other charts. Modify or reorganize the text boxes as you desire. Experiment with shade schemes and font pairings. Alter, share or cooperate with other people on your work. Download Deploying And Managing Recurring Our Financial Performance Over The Year Infographics PDF and find out how to give a successful presentation. Present a perfect display to your team and make your presentation unforgettable.
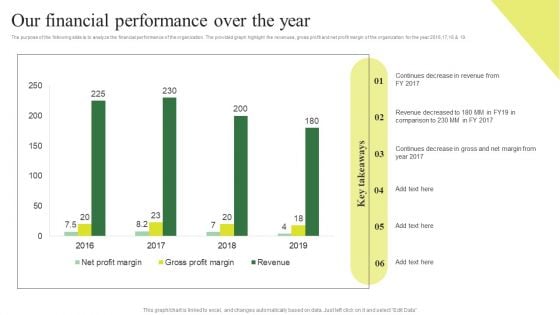
Consumption Based Pricing Model Our Financial Performance Over The Year Elements PDF
The purpose of the following slide is to analyze the financial performance of the organization. The provided graph highlight the revenues, gross profit and net profit margin of the organization for the year 2016,17,18 and 19. This Consumption Based Pricing Model Key Metrices For Forecasting In Recurring Revenue Model Clipart PDF is perfect for any presentation, be it in front of clients or colleagues. It is a versatile and stylish solution for organizing your meetings. The Consumption Based Pricing Model Key Metrices For Forecasting In Recurring Revenue Model Clipart PDF features a modern design for your presentation meetings. The adjustable and customizable slides provide unlimited possibilities for acing up your presentation. Slidegeeks has done all the homework before launching the product for you. So, do not wait, grab the presentation templates today
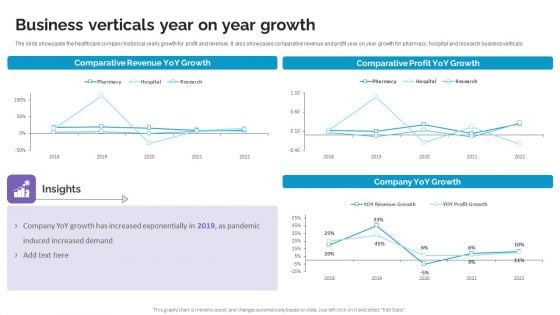
Business Verticals Year On Year Growth Life Science And Healthcare Solutions Company Profile Brochure PDF
The slide showcases the healthcare company historical yearly growth for profit and revenue. It also showcases comparative revenue and profit year on year growth for pharmacy, hospital and research business verticals. Formulating a presentation can take up a lot of effort and time, so the content and message should always be the primary focus. The visuals of the PowerPoint can enhance the presenters message, so our Business Verticals Year On Year Growth Life Science And Healthcare Solutions Company Profile Brochure PDF was created to help save time. Instead of worrying about the design, the presenter can concentrate on the message while our designers work on creating the ideal templates for whatever situation is needed. Slidegeeks has experts for everything from amazing designs to valuable content, we have put everything into Business Verticals Year On Year Growth Life Science And Healthcare Solutions Company Profile Brochure PDF
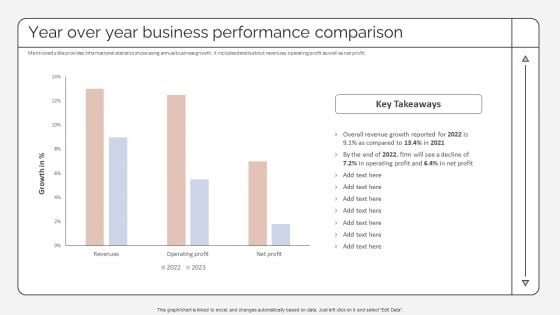
Year Over Year Business Performance Comparison Strategic Promotion Plan Pictures PDF
Mentioned slide provides informational statistics showcasing annual business growth. It includes details about revenues, operating profit as well as net profit. Are you in need of a template that can accommodate all of your creative concepts This one is crafted professionally and can be altered to fit any style. Use it with Google Slides or PowerPoint. Include striking photographs, symbols, depictions, and other visuals. Fill, move around, or remove text boxes as desired. Test out color palettes and font mixtures. Edit and save your work, or work with colleagues. Download Year Over Year Business Performance Comparison Strategic Promotion Plan Pictures PDF and observe how to make your presentation outstanding. Give an impeccable presentation to your group and make your presentation unforgettable.
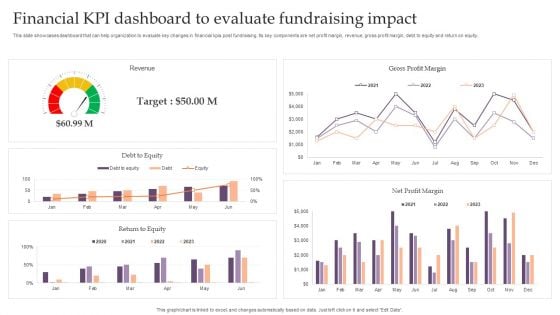
Assessing Debt And Equity Fundraising Alternatives For Business Growth Financial KPI Dashboard To Evaluate Infographics PDF
This slide showcases dashboard that can help organization to evaluate key changes in financial kpis post fundraising. Its key components are net profit margin, revenue, gross profit margin, debt to equity and return on equity. This Assessing Debt And Equity Fundraising Alternatives For Business Growth Financial KPI Dashboard To Evaluate Infographics PDF is perfect for any presentation, be it in front of clients or colleagues. It is a versatile and stylish solution for organizing your meetings. TheAssessing Debt And Equity Fundraising Alternatives For Business Growth Financial KPI Dashboard To Evaluate Infographics PDF features a modern design for your presentation meetings. The adjustable and customizable slides provide unlimited possibilities for acing up your presentation. Slidegeeks has done all the homework before launching the product for you. So, do not wait, grab the presentation templates today
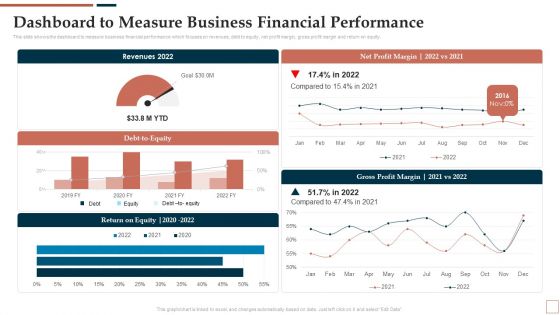
BPR To Develop Operational Effectiveness Dashboard To Measure Business Financial Performance Elements PDF
This slide shows the dashboard to measure business financial performance which focuses on revenues, debt to equity, net profit margin, gross profit margin and return on equity. Coming up with a presentation necessitates that the majority of the effort goes into the content and the message you intend to convey. The visuals of a PowerPoint presentation can only be effective if it supplements and supports the story that is being told. Keeping this in mind our experts created BPR To Develop Operational Effectiveness Dashboard To Measure Business Financial Performance Elements PDF to reduce the time that goes into designing the presentation. This way, you can concentrate on the message while our designers take care of providing you with the right template for the situation.

Deployment Of Business Process Dashboard To Measure Business Financial Performance Microsoft PDF
This slide shows the dashboard to measure business financial performance which focuses on revenues, debt to equity, net profit margin, gross profit margin and return on equity. Do you have to make sure that everyone on your team knows about any specific topic I yes, then you should give Deployment Of Business Process Dashboard To Measure Business Financial Performance Microsoft PDF a try. Our experts have put a lot of knowledge and effort into creating this impeccable Deployment Of Business Process Dashboard To Measure Business Financial Performance Microsoft PDF. You can use this template for your upcoming presentations, as the slides are perfect to represent even the tiniest detail. You can download these templates from the Slidegeeks website and these are easy to edit. So grab these today.
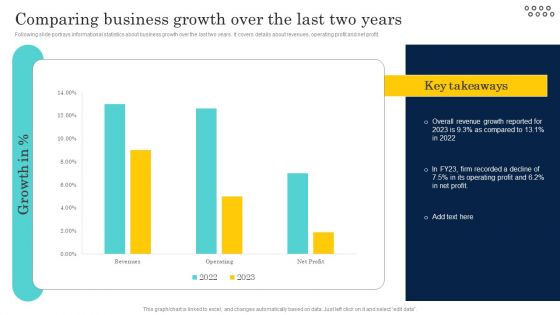
Optimizing And Managing Retail Comparing Business Growth Over The Last Two Pictures PDF
Following slide portrays informational statistics about business growth over the last two years. It covers details about revenues, operating profit and net profit. Do you have to make sure that everyone on your team knows about any specific topic I yes, then you should give Optimizing And Managing Retail Comparing Business Growth Over The Last Two Pictures PDF a try. Our experts have put a lot of knowledge and effort into creating this impeccable Optimizing And Managing Retail Comparing Business Growth Over The Last Two Pictures PDF. You can use this template for your upcoming presentations, as the slides are perfect to represent even the tiniest detail. You can download these templates from the Slidegeeks website and these are easy to edit. So grab these today.
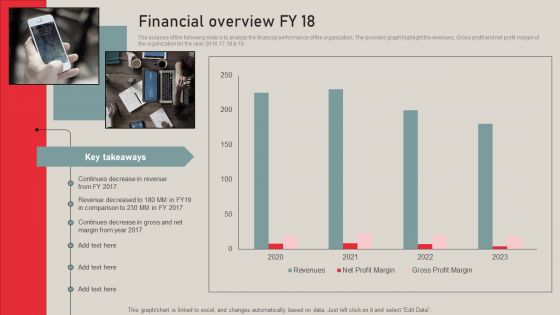
Individualized Pricing Approach For Managed Services Financial Overview FY 18 Structure PDF
The purpose of the following slide is to analyze the financial performance of the organization. The provided graph highlight the revenues, Gross profit and net profit margin of the organization for the year 2016,17,18 and 19. Create an editable Individualized Pricing Approach For Managed Services Financial Overview FY 18 Structure PDF that communicates your idea and engages your audience. Whether you are presenting a business or an educational presentation, pre designed presentation templates help save time. Individualized Pricing Approach For Managed Services Financial Overview FY 18 Structure PDF is highly customizable and very easy to edit, covering many different styles from creative to business presentations. Slidegeeks has creative team members who have crafted amazing templates. So, go and get them without any delay.
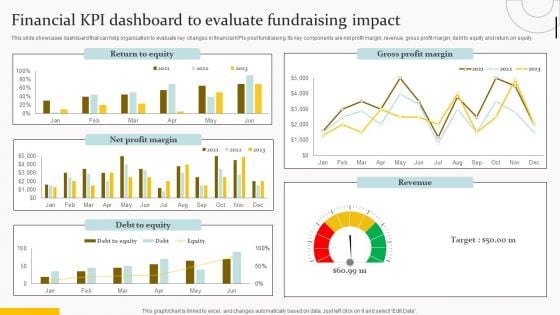
Financial Kpi Dashboard To Evaluate Fundraising Impact Topics PDF
This slide showcases dashboard that can help organization to evaluate key changes in financial KPIs post fundraising. Its key components are net profit margin, revenue, gross profit margin, debt to equity and return on equity. Do you have to make sure that everyone on your team knows about any specific topic I yes, then you should give Financial Kpi Dashboard To Evaluate Fundraising Impact Topics PDF a try. Our experts have put a lot of knowledge and effort into creating this impeccable Financial Kpi Dashboard To Evaluate Fundraising Impact Topics PDF. You can use this template for your upcoming presentations, as the slides are perfect to represent even the tiniest detail. You can download these templates from the Slidegeeks website and these are easy to edit. So grab these today.
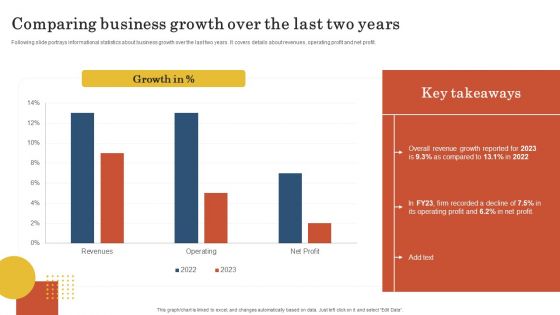
Retail Business Operation Management To Optimize Customer Experience Comparing Business Growth Over Brochure PDF
Following slide portrays informational statistics about business growth over the last two years. It covers details about revenues, operating profit and net profit. Get a simple yet stunning designed Retail Business Operation Management To Optimize Customer Experience Comparing Business Growth Over Brochure PDF. It is the best one to establish the tone in your meetings. It is an excellent way to make your presentations highly effective. So, download this PPT today from Slidegeeks and see the positive impacts. Our easy to edit Retail Business Operation Management To Optimize Customer Experience Comparing Business Growth Over Brochure PDF can be your go to option for all upcoming conferences and meetings. So, what are you waiting for Grab this template today.
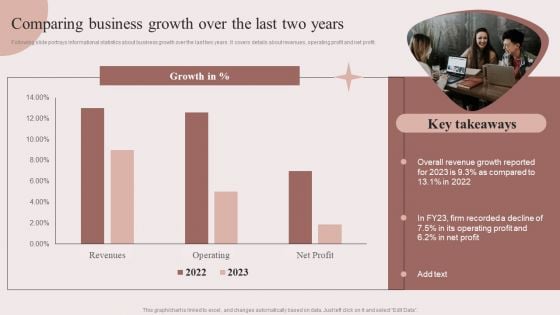
Enhancing Retail Process By Effective Inventory Management Comparing Business Growth Over The Last Two Years Rules PDF
Following slide portrays informational statistics about business growth over the last two years. It covers details about revenues, operating profit and net profit.Do you have to make sure that everyone on your team knows about any specific topic I yes, then you should give Enhancing Retail Process By Effective Inventory Management Comparing Business Growth Over The Last Two Years Rules PDF a try. Our experts have put a lot of knowledge and effort into creating this impeccable Enhancing Retail Process By Effective Inventory Management Comparing Business Growth Over The Last Two Years Rules PDF. You can use this template for your upcoming presentations, as the slides are perfect to represent even the tiniest detail. You can download these templates from the Slidegeeks website and these are easy to edit. So grab these today.
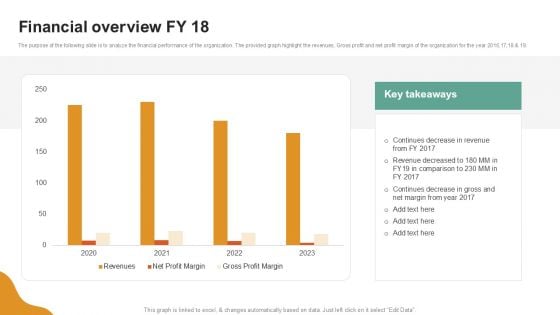
A LA Carte Business Strategy Financial Overview FY 18 Topics PDF
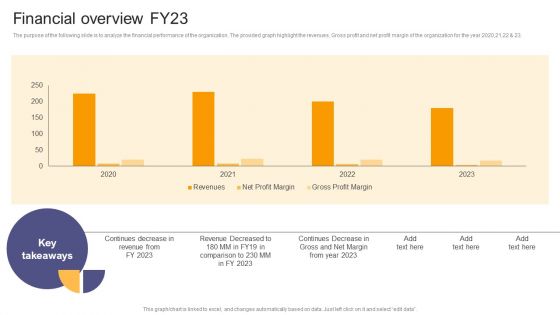
Per Device Pricing Strategy For Managed Solutions Financial Overview FY23 Ideas PDF
The purpose of the following slide is to analyze the financial performance of the organization. The provided graph highlight the revenues, Gross profit and net profit margin of the organization for the year 2020,21,22 and 23. Find highly impressive Per Device Pricing Strategy For Managed Solutions Financial Overview FY23 Ideas PDF on Slidegeeks to deliver a meaningful presentation. You can save an ample amount of time using these presentation templates. No need to worry to prepare everything from scratch because Slidegeeks experts have already done a huge research and work for you. You need to download Per Device Pricing Strategy For Managed Solutions Financial Overview FY23 Ideas PDF for your upcoming presentation. All the presentation templates are 100 percent editable and you can change the color and personalize the content accordingly. Download now.
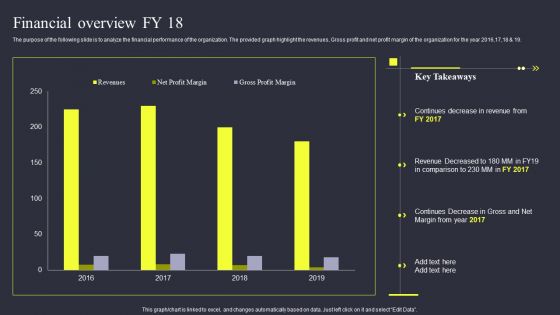
Strategies To Enhance Managed Service Business Financial Overview Fy 18 Information PDF
The purpose of the following slide is to analyze the financial performance of the organization. The provided graph highlight the revenues, Gross profit and net profit margin of the organization for the year 2016,17,18 and 19. Coming up with a presentation necessitates that the majority of the effort goes into the content and the message you intend to convey. The visuals of a PowerPoint presentation can only be effective if it supplements and supports the story that is being told. Keeping this in mind our experts created Strategies To Enhance Managed Service Business Financial Overview Fy 18 Information PDF to reduce the time that goes into designing the presentation. This way, you can concentrate on the message while our designers take care of providing you with the right template for the situation.
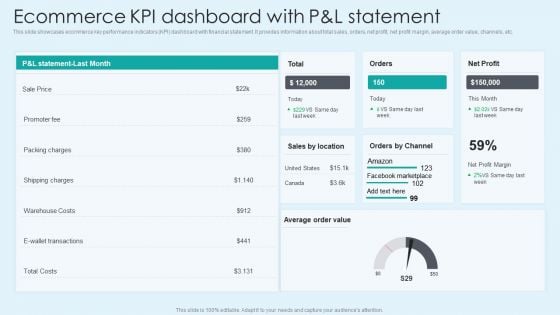
Ecommerce KPI Dashboard With Pand L Statement Download PDF
This slide showcases ecommerce key performance indicators KPI dashboard with financial statement. It provides information about total sales, orders, net profit, net profit margin, average order value, channels, etc. This Ecommerce KPI Dashboard With Pand L Statement Download PDF from Slidegeeks makes it easy to present information on your topic with precision. It provides customization options, so you can make changes to the colors, design, graphics, or any other component to create a unique layout. It is also available for immediate download, so you can begin using it right away. Slidegeeks has done good research to ensure that you have everything you need to make your presentation stand out. Make a name out there for a brilliant performance.
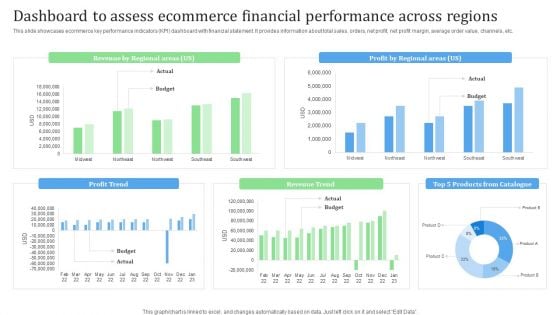
Dashboard To Assess Ecommerce Financial Performance Across Regions Financial Management Strategies Clipart PDF
This slide showcases ecommerce key performance indicators KPI dashboard with financial statement. It provides information about total sales, orders, net profit, net profit margin, average order value, channels, etc.Present like a pro with Dashboard To Assess Ecommerce Financial Performance Across Regions Financial Management Strategies Clipart PDF Create beautiful presentations together with your team, using our easy-to-use presentation slides. Share your ideas in real-time and make changes on the fly by downloading our templates. So whether you are in the office, on the go, or in a remote location, you can stay in sync with your team and present your ideas with confidence. With Slidegeeks presentation got a whole lot easier. Grab these presentations today.
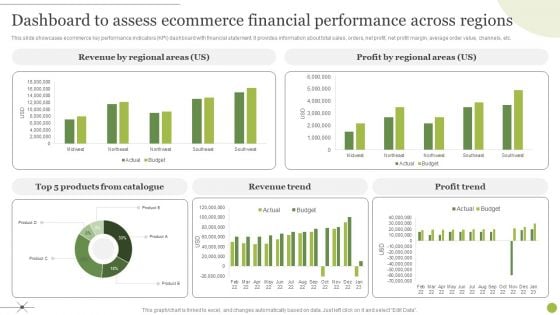
Managing E Commerce Business Accounting Dashboard To Assess Ecommerce Financial Performance Across Regions Graphics PDF
This slide showcases ecommerce key performance indicators KPI dashboard with financial statement. It provides information about total sales, orders, net profit, net profit margin, average order value, channels, etc. Do you have to make sure that everyone on your team knows about any specific topic I yes, then you should give Managing E Commerce Business Accounting Dashboard To Assess Ecommerce Financial Performance Across Regions Graphics PDF a try. Our experts have put a lot of knowledge and effort into creating this impeccable Managing E Commerce Business Accounting Dashboard To Assess Ecommerce Financial Performance Across Regions Graphics PDF. You can use this template for your upcoming presentations, as the slides are perfect to represent even the tiniest detail. You can download these templates from the Slidegeeks website and these are easy to edit. So grab these today.
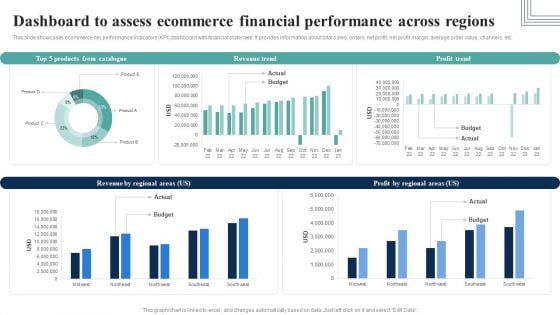
Dashboard To Assess Ecommerce Financial Performance Across Regions Infographics PDF
This slide showcases ecommerce key performance indicators KPI dashboard with financial statement. It provides information about total sales, orders, net profit, net profit margin, average order value, channels, etc.Here you can discover an assortment of the finest PowerPoint and Google Slides templates. With these templates, you can create presentations for a variety of purposes while simultaneously providing your audience with an eye-catching visual experience. Download Dashboard To Assess Ecommerce Financial Performance Across Regions Infographics PDF to deliver an impeccable presentation. These templates will make your job of preparing presentations much quicker, yet still, maintain a high level of quality. Slidegeeks has experienced researchers who prepare these templates and write high-quality content for you. Later on, you can personalize the content by editing the Dashboard To Assess Ecommerce Financial Performance Across Regions Infographics PDF.
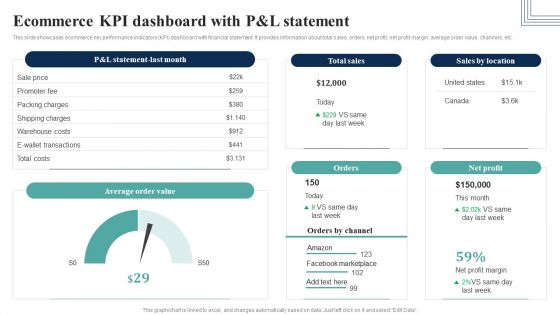
How Electronic Commerce Financial Procedure Can Be Enhanced Ecommerce Kpi Dashboard Slides PDF
This slide showcases ecommerce key performance indicators KPI dashboard with financial statement. It provides information about total sales, orders, net profit, net profit margin, average order value, channels, etc.Create an editable How Electronic Commerce Financial Procedure Can Be Enhanced Ecommerce Kpi Dashboard Slides PDF that communicates your idea and engages your audience. Whether you are presenting a business or an educational presentation, pre-designed presentation templates help save time. How Electronic Commerce Financial Procedure Can Be Enhanced Ecommerce Kpi Dashboard Slides PDF is highly customizable and very easy to edit, covering many different styles from creative to business presentations. Slidegeeks has creative team members who have crafted amazing templates. So, go and get them without any delay.
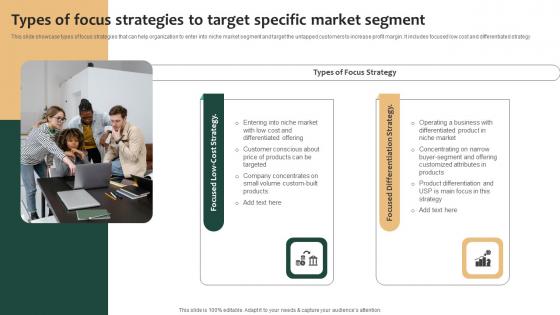
Tailored Product Approach Types Of Focus Strategies To Target Specific Market Segment Diagrams Pdf
This slide showcase types of focus strategies that can help organization to enter into niche market segment and target the untapped customers to increase profit margin. It includes focused low cost and differentiated strategy. This Tailored Product Approach Types Of Focus Strategies To Target Specific Market Segment Diagrams Pdf from Slidegeeks makes it easy to present information on your topic with precision. It provides customization options, so you can make changes to the colors, design, graphics, or any other component to create a unique layout. It is also available for immediate download, so you can begin using it right away. Slidegeeks has done good research to ensure that you have everything you need to make your presentation stand out. Make a name out there for a brilliant performance. This slide showcase types of focus strategies that can help organization to enter into niche market segment and target the untapped customers to increase profit margin. It includes focused low cost and differentiated strategy
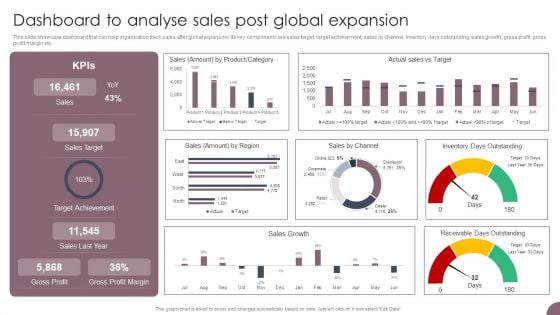
International Business Extension Dashboard To Analyse Sales Post Global Expansion Guidelines PDF
This slide showcase dashboard that can help organization track sales after global expansion. Its key components are sales target, target achievement, sales by channel, inventory days outstanding, sales growth, gross profit, gross profit margin etc. Are you in need of a template that can accommodate all of your creative concepts This one is crafted professionally and can be altered to fit any style. Use it with Google Slides or PowerPoint. Include striking photographs, symbols, depictions, and other visuals. Fill, move around, or remove text boxes as desired. Test out color palettes and font mixtures. Edit and save your work, or work with colleagues. Download International Business Extension Dashboard To Analyse Sales Post Global Expansion Guidelines PDF and observe how to make your presentation outstanding. Give an impeccable presentation to your group and make your presentation unforgettable.
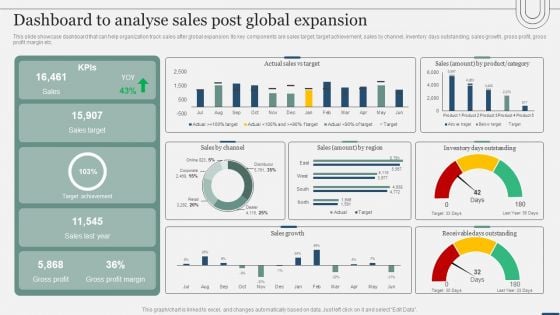
Assessing International Market Dashboard To Analyse Sales Post Global Expansion Elements PDF
This slide showcase dashboard that can help organization track sales after global expansion. Its key components are sales target, target achievement, sales by channel, inventory days outstanding, sales growth, gross profit, gross profit margin etc. Are you in need of a template that can accommodate all of your creative concepts This one is crafted professionally and can be altered to fit any style. Use it with Google Slides or PowerPoint. Include striking photographs, symbols, depictions, and other visuals. Fill, move around, or remove text boxes as desired. Test out color palettes and font mixtures. Edit and save your work, or work with colleagues. Download Assessing International Market Dashboard To Analyse Sales Post Global Expansion Elements PDF and observe how to make your presentation outstanding. Give an impeccable presentation to your group and make your presentation unforgettable.
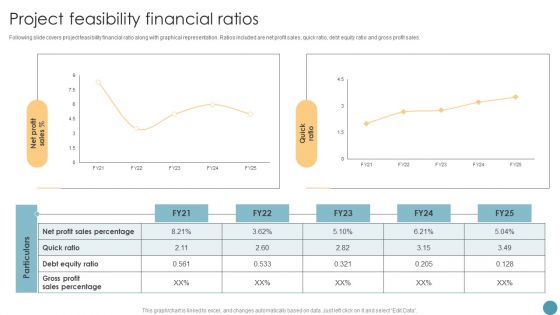
Project Feasibility Financial Ratios Feasibility Analysis Report For Construction Project Structure PDF
Following slide covers project feasibility financial ratio along with graphical representation. Ratios included are net profit sales, quick ratio, debt equity ratio and gross profit sales. Here you can discover an assortment of the finest PowerPoint and Google Slides templates. With these templates, you can create presentations for a variety of purposes while simultaneously providing your audience with an eye catching visual experience. Download Project Feasibility Financial Ratios Feasibility Analysis Report For Construction Project Structure PDF to deliver an impeccable presentation. These templates will make your job of preparing presentations much quicker, yet still, maintain a high level of quality. Slidegeeks has experienced researchers who prepare these templates and write high quality content for you. Later on, you can personalize the content by editing the Project Feasibility Financial Ratios Feasibility Analysis Report For Construction Project Structure PDF.
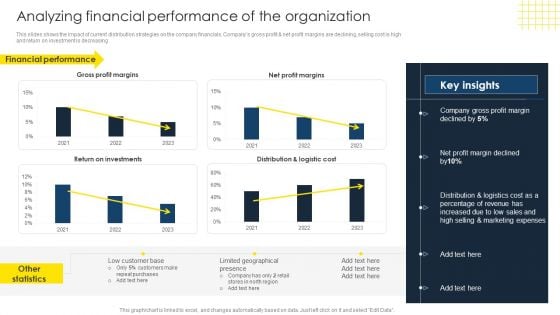
Optimize Business Sales Analyzing Financial Performance Of The Organization Structure PDF
This slides shows the impact of current distribution strategies on the company financials. Companys gross profit and net profit margins are declining, selling cost is high and return on investment is decreasing. Crafting an eye-catching presentation has never been more straightforward. Let your presentation shine with this tasteful yet straightforward Optimize Business Sales Analyzing Financial Performance Of The Organization Structure PDF template. It offers a minimalistic and classy look that is great for making a statement. The colors have been employed intelligently to add a bit of playfulness while still remaining professional. Construct the ideal Optimize Business Sales Analyzing Financial Performance Of The Organization Structure PDF that effortlessly grabs the attention of your audience Begin now and be certain to wow your customers.
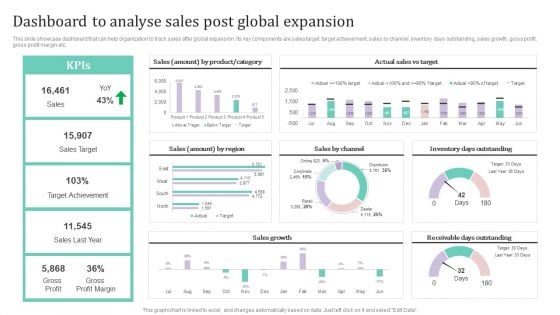
Dashboard To Analyse Sales Post Global Expansion Ppt PowerPoint Presentation File Styles PDF
This slide showcase dashboard that can help organization to track sales after global expansion. Its key components are sales target, target achievement, sales by channel, inventory days outstanding, sales growth, gross profit, gross profit margin etc.This Dashboard To Analyse Sales Post Global Expansion Ppt PowerPoint Presentation File Styles PDF from Slidegeeks makes it easy to present information on your topic with precision. It provides customization options, so you can make changes to the colors, design, graphics, or any other component to create a unique layout. It is also available for immediate download, so you can begin using it right away. Slidegeeks has done good research to ensure that you have everything you need to make your presentation stand out. Make a name out there for a brilliant performance.
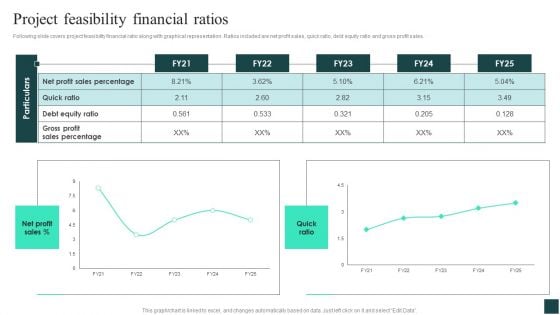
Project Feasibility Financial Ratios Credibility Assessment Summary For Construction Project Rules PDF
Following slide covers project feasibility financial ratio along with graphical representation. Ratios included are net profit sales, quick ratio, debt equity ratio and gross profit sales. Coming up with a presentation necessitates that the majority of the effort goes into the content and the message you intend to convey. The visuals of a PowerPoint presentation can only be effective if it supplements and supports the story that is being told. Keeping this in mind our experts created Project Feasibility Financial Ratios Credibility Assessment Summary For Construction Project Rules PDF to reduce the time that goes into designing the presentation. This way, you can concentrate on the message while our designers take care of providing you with the right template for the situation.

Financial Evaluation Report Project Feasibility Financial Ratios Mockup PDF
Following slide covers project feasibility financial ratio along with graphical representation. Ratios included are net profit sales, quick ratio, debt equity ratio and gross profit sales. Formulating a presentation can take up a lot of effort and time, so the content and message should always be the primary focus. The visuals of the PowerPoint can enhance the presenters message, so our Financial Evaluation Report Project Feasibility Financial Ratios Mockup PDF was created to help save time. Instead of worrying about the design, the presenter can concentrate on the message while our designers work on creating the ideal templates for whatever situation is needed. Slidegeeks has experts for everything from amazing designs to valuable content, we have put everything into Financial Evaluation Report Project Feasibility Financial Ratios Mockup PDF.
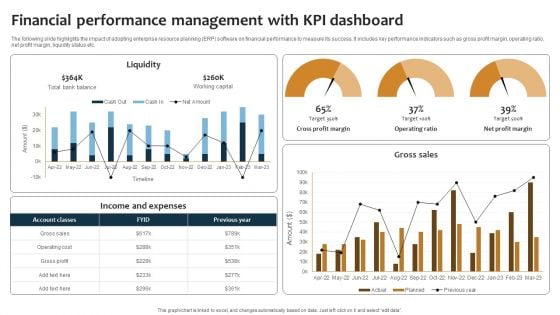
Improving Business Procedures Enterprise Resource Planning System Financial Performance Management Summary PDF
The following slide highlights the impact of adopting enterprise resource planning ERP software on financial performance to measure its success. It includes key performance indicators such as gross profit margin, operating ratio, net profit margin, liquidity status etc. Welcome to our selection of the Improving Business Procedures Enterprise Resource Planning System Financial Performance Management Summary PDF. These are designed to help you showcase your creativity and bring your sphere to life. Planning and Innovation are essential for any business that is just starting out. This collection contains the designs that you need for your everyday presentations. All of our PowerPoints are 100 percent editable, so you can customize them to suit your needs. This multi purpose template can be used in various situations. Grab these presentation templates today.
Planning Transnational Technique To Improve International Scope Dashboard For Tracking Post Expansion Sales Introduction PDF
This slide covers the dashboard for analyzing fast food business sales by region. It includes KPIs such as sales, sales target, target achievement, gross profit, gross profit margin, sales by channels, sales growth, etc. Find highly impressive Planning Transnational Technique To Improve International Scope Dashboard For Tracking Post Expansion Sales Introduction PDF on Slidegeeks to deliver a meaningful presentation. You can save an ample amount of time using these presentation templates. No need to worry to prepare everything from scratch because Slidegeeks experts have already done a huge research and work for you. You need to download Planning Transnational Technique To Improve International Scope Dashboard For Tracking Post Expansion Sales Introduction PDF for your upcoming presentation. All the presentation templates are 100 percent editable and you can change the color and personalize the content accordingly. Download now.
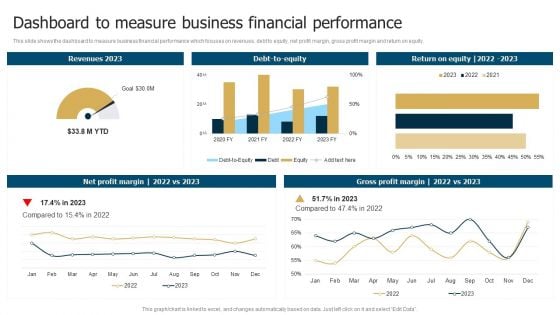
Business Restructuring Process Dashboard To Measure Business Financial Performance Rules PDF
This slide shows the dashboard to measure business financial performance which focuses on revenues, debt to equity, net profit margin, gross profit margin and return on equity. If you are looking for a format to display your unique thoughts, then the professionally designed Business Restructuring Process Dashboard To Measure Business Financial Performance Rules PDF is the one for you. You can use it as a Google Slides template or a PowerPoint template. Incorporate impressive visuals, symbols, images, and other charts. Modify or reorganize the text boxes as you desire. Experiment with shade schemes and font pairings. Alter, share or cooperate with other people on your work. Download Business Restructuring Process Dashboard To Measure Business Financial Performance Rules PDF and find out how to give a successful presentation. Present a perfect display to your team and make your presentation unforgettable.
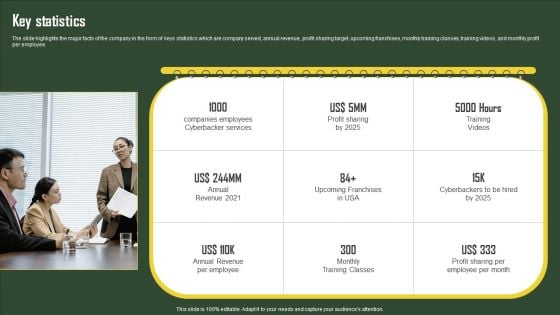
Business Profile For Virtual Assistant Solutions Firm Key Statistics Guidelines PDF
The slide highlights the major facts of the company in the form of keys statistics which are company served, annual revenue, profit sharing target, upcoming franchises, monthly training classes, training videos, and monthly profit per employee. If you are looking for a format to display your unique thoughts, then the professionally designed Business Profile For Virtual Assistant Solutions Firm Key Statistics Guidelines PDF is the one for you. You can use it as a Google Slides template or a PowerPoint template. Incorporate impressive visuals, symbols, images, and other charts. Modify or reorganize the text boxes as you desire. Experiment with shade schemes and font pairings. Alter, share or cooperate with other people on your work. Download Business Profile For Virtual Assistant Solutions Firm Key Statistics Guidelines PDF and find out how to give a successful presentation. Present a perfect display to your team and make your presentation unforgettable.
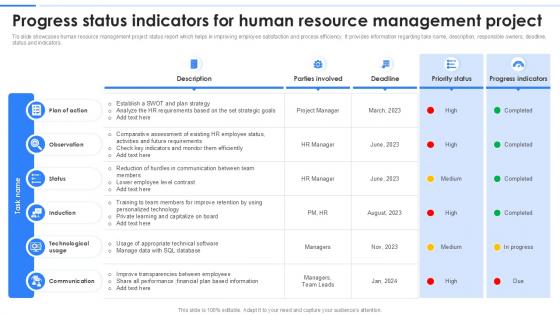
Progress Status Indicators For Human Resource Management Project
If you are looking for a format to display your unique thoughts, then the professionally designed Profit And Loss Waterfall Powerpoint Ppt Template is the one for you. You can use it as a Google Slides template or a PowerPoint template. Incorporate impressive visuals, symbols, images, and other charts. Modify or reorganize the text boxes as you desire. Experiment with shade schemes and font pairings. Alter, share or cooperate with other people on your work. Download Profit And Loss Waterfall Powerpoint Ppt Template and find out how to give a successful presentation. Present a perfect display to your team and make your presentation unforgettable. This template showcases Human Resource Management Project Status Report designed to enhance employee satisfaction and streamline process efficiency. It includes components such as task name, description, responsible owners, deadlines, current status, and progress indicators.
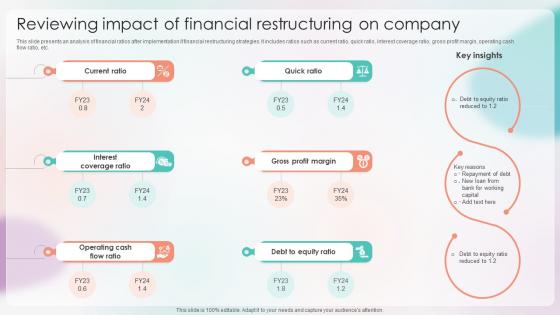
Strategies For Stabilizing Corporate Reviewing Impact Of Financial Restructuring On Company
This slide presents an analysis of financial ratios after implementation if financial restructuring strategies. It includes ratios such as current ratio, quick ratio, interest coverage ratio, gross profit margin, operating cash flow ratio, etc. Retrieve professionally designed Strategies For Stabilizing Corporate Reviewing Impact Of Financial Restructuring On Company to effectively convey your message and captivate your listeners. Save time by selecting pre-made slideshows that are appropriate for various topics, from business to educational purposes. These themes come in many different styles, from creative to corporate, and all of them are easily adjustable and can be edited quickly. Access them as PowerPoint templates or as Google Slides themes. You do not have to go on a hunt for the perfect presentation because Slidegeeks got you covered from everywhere. This slide presents an analysis of financial ratios after implementation if financial restructuring strategies. It includes ratios such as current ratio, quick ratio, interest coverage ratio, gross profit margin, operating cash flow ratio, etc.
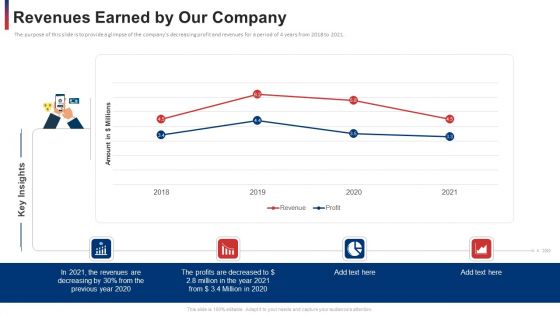
Revenues Earned By Our Company Themes PDF
The purpose of this slide is to provide a glimpse of the companys decreasing profit and revenues for a period of 4 years from 2018 to 2021. Deliver and pitch your topic in the best possible manner with this revenues earned by our company themes pdf. Use them to share invaluable insights on revenues earned by our company and impress your audience. This template can be altered and modified as per your expectations. So, grab it now.
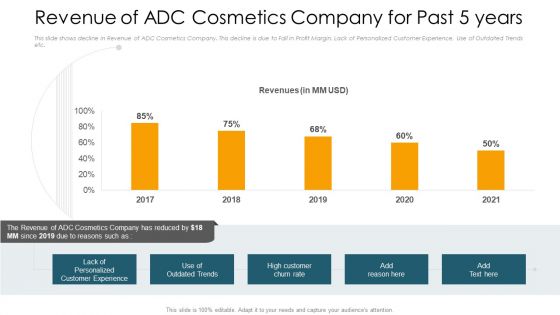
Revenue Of ADC Cosmetics Company For Past 5 Years Themes PDF
This slide shows decline in Revenue of ADC Cosmetics Company. This decline is due to Fall in Profit Margin, Lack of Personalized Customer Experience, Use of Outdated Trends etc. Deliver an awe-inspiring pitch with this creative revenue of adc cosmetics company for past 5 years themes pdf. bundle. Topics like revenue,2017 to 2021 can be discussed with this completely editable template. It is available for immediate download depending on the needs and requirements of the user.
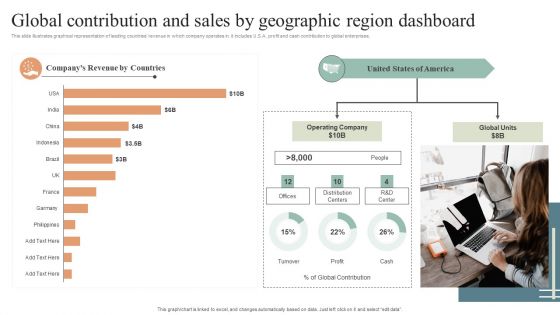
Global Contribution And Sales By Geographic Region Dashboard Diagrams PDF
This slide illustrates graphical representation of leading countries revenue in which company operates in. it includes U.S.A. profit and cash contribution to global enterprises. Pitch your topic with ease and precision using this Global Contribution And Sales By Geographic Region Dashboard Diagrams PDF. This layout presents information on Global Contribution, Sales By Geographic, Region Dashboard. It is also available for immediate download and adjustment. So, changes can be made in the color, design, graphics or any other component to create a unique layout.
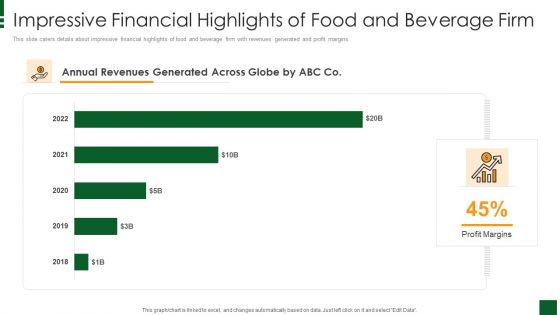
Refreshments Company Investor Introduction Impressive Financial Highlights Of Food And Beverage Firm Themes PDF
This slide caters details about impressive financial highlights of food and beverage firm with revenues generated and profit margins. Deliver and pitch your topic in the best possible manner with this refreshments company investor introduction impressive financial highlights of food and beverage firm themes pdf. Use them to share invaluable insights on impressive financial highlights of food and beverage firm and impress your audience. This template can be altered and modified as per your expectations. So, grab it now.
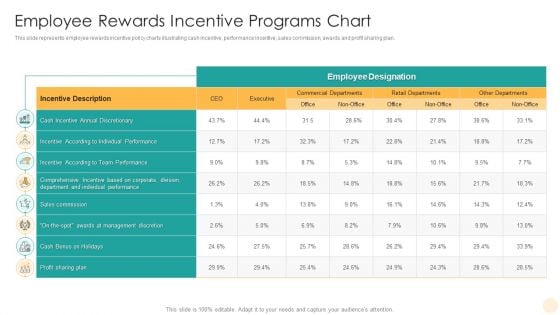
Employee Rewards Incentive Programs Chart Slides PDF
This slide represents employee rewards incentive policy charts illustrating cash incentive, performance incentive, sales commission, awards and profit sharing plan. Pitch your topic with ease and precision using this Employee Rewards Incentive Programs Chart Slides PDF. This layout presents information on Sales Commission, Team Performance, Individual Performance. It is also available for immediate download and adjustment. So, changes can be made in the color, design, graphics or any other component to create a unique layout.

Introducing CRM Framework Within Organization CRM Data Analysis Period Ppt Ideas Themes PDF
Presenting this set of slides with name introducing crm framework within organization crm data analysis period ppt ideas themes pdf. The topics discussed in these slides are entities by rep, completed activities, biz notes month, phone calls last 3 months, activity last 3 months, sales last 3 months, profit last 3 months. This is a completely editable PowerPoint presentation and is available for immediate download. Download now and impress your audience.
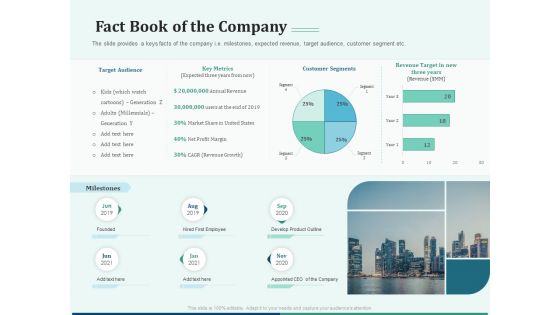
Early Stage Funding Fact Book Of The Company Ppt Outline Diagrams PDF
The slide provides a keys facts of the company i.e. milestones, expected revenue, target audience, customer segment etc. Deliver and pitch your topic in the best possible manner with this early stage funding fact book of the company ppt outline diagrams pdf. Use them to share invaluable insights on target audience, annual revenue, market, net profit margin, develop product outline and impress your audience. This template can be altered and modified as per your expectations. So, grab it now.
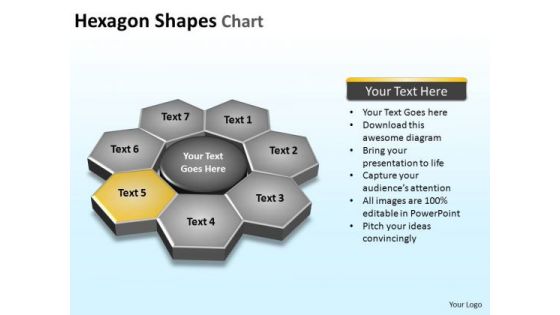
PowerPoint Slide Designs Chart Hexagon Shapes Ppt Backgrounds
PowerPoint_Slide_Designs_Chart_Hexagon_Shapes_PPT_BackgroundsBusiness Power Points-- Ensure a deal with our PowerPoint Slide Designs Chart Hexagon Shapes Ppt Backgrounds. Profits will surely ensue.
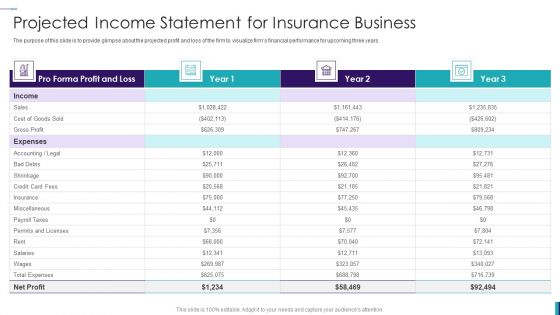
Establishing Insurance Company Projected Income Statement For Insurance Business Themes PDF
The purpose of this slide is to provide glimpse about the projected profit and loss of the firm to visualize firms financial performance for upcoming three years. Deliver an awe inspiring pitch with this creative Establishing Insurance Company Projected Income Statement For Insurance Business Themes PDF bundle. Topics like Income Sales, Bad Debts, Permits And Licenses can be discussed with this completely editable template. It is available for immediate download depending on the needs and requirements of the user.
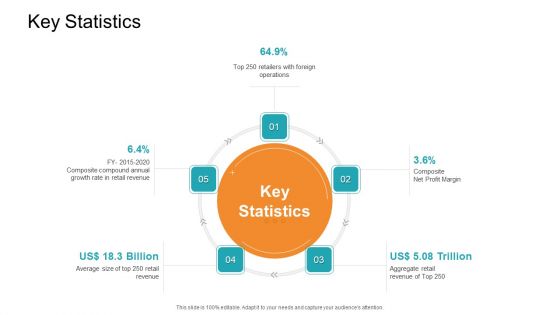
Retail Sector Introduction Key Statistics Themes PDF
Presenting retail sector introduction key statistics themes pdf. to provide visual cues and insights. Share and navigate important information on five stages that need your due attention. This template can be used to pitch topics like retailers with foreign operations, composite compound annual growth rate in retail revenue, composite net profit margin. In addtion, this PPT design contains high resolution images, graphics, etc, that are easily editable and available for immediate download.

Financial Dashboard For Month Closing Income And Expenses Ideas PDF
This slide illustrates facts and figures related to month end financials of a corporation. It includes income statement graph, profit margin, income and expenditure graph etc.Showcasing this set of slides titled Financial Dashboard For Month Closing Income And Expenses Ideas PDF The topics addressed in these templates are Accounts Receivable, Income Statement, Expenditure All the content presented in this PPT design is completely editable. Download it and make adjustments in color, background, font etc. as per your unique business setting.
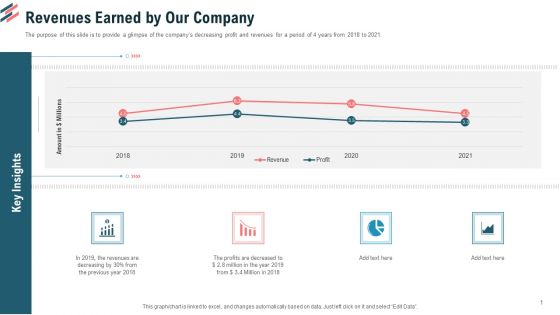
Revenues Earned By Our Company Ppt Professional Graphics Pictures PDF
The purpose of this slide is to provide a glimpse of the companys decreasing profit and revenues for a period of 4 years from 2018 to 2021.Deliver and pitch your topic in the best possible manner with this revenues earned by our company ppt professional graphics pictures pdf. Use them to share invaluable insights on revenue, 2018 to 2021 and impress your audience. This template can be altered and modified as per your expectations. So, grab it now.
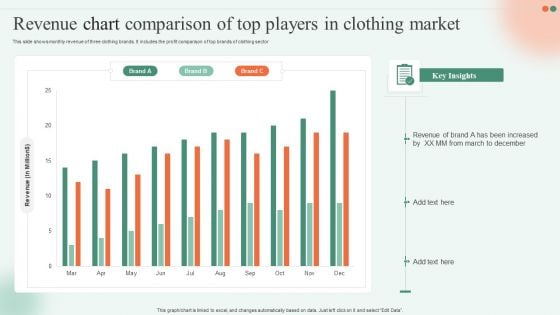
Revenue Chart Comparison Of Top Players In Clothing Market Ppt Infographics Skills PDF
This slide shows monthly revenue of three clothing brands. It includes the profit comparison of top brands of clothing sector Showcasing this set of slides titled Revenue Chart Comparison Of Top Players In Clothing Market Ppt Infographics Skills PDF. The topics addressed in these templates are Revenue, Brand, Key Insights. All the content presented in this PPT design is completely editable. Download it and make adjustments in color, background, font etc. as per your unique business setting.
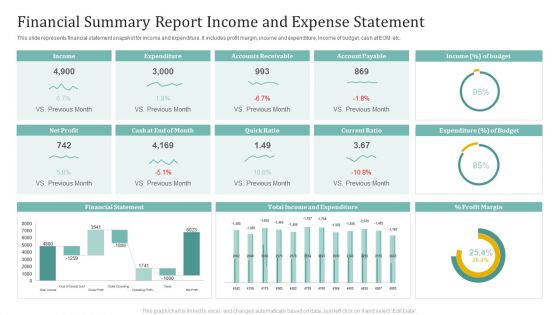
Financial Summary Report Income And Expense Statement Ppt File Background Designs PDF
This slide represents financial statement snapshot for income and expenditure. It includes profit margin, income and expenditure, income of budget, cash at EOM etc. Showcasing this set of slides titled Financial Summary Report Income And Expense Statement Ppt File Background Designs PDF. The topics addressed in these templates are Income, Expenditure, Accounts Receivable, Account Payable. All the content presented in this PPT design is completely editable. Download it and make adjustments in color, background, font etc. as per your unique business setting.
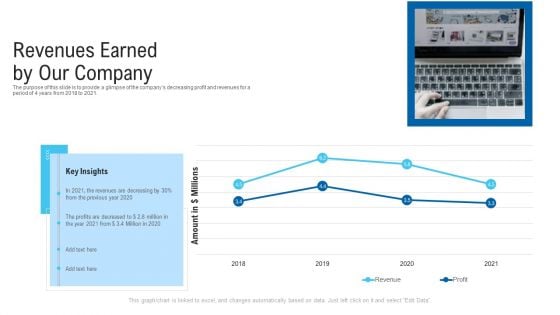
New Era Of B2B Trading Revenues Earned By Our Company Ppt Show Background Images PDF
The purpose of this slide is to provide a glimpse of the companys decreasing profit and revenues for a period of 4 years from 2018 to 2021.Deliver and pitch your topic in the best possible manner with this new era of B2B trading revenues earned by our company ppt show background images pdf. Use them to share invaluable insights on revenue, 2018 to 2021 and impress your audience. This template can be altered and modified as per your expectations. So, grab it now.

3d Man On A Colorful Pie Chart PowerPoint Templates Ppt Backgrounds For Slides 0713
Create your domain with our 3d Man On A Colorful Pie Chart PowerPoint Templates PPT Backgrounds For Slides. Rule minds with your thoughts. Get the domestics right with our People PowerPoint Templates. Create the base for thoughts to grow. Do away with dogmatic approaches. Establish the value of reason with our Pie Charts PowerPoint Templates. Achieve strong & sustainable profit gains with our 3d Man On A Colorful Pie Chart PowerPoint Templates Ppt Backgrounds For Slides 0713. They will make you look good.


 Continue with Email

 Home
Home


