Program Design
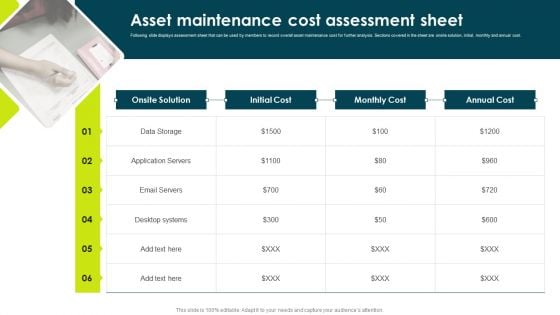
IT Threats Response Playbook Asset Maintenance Cost Assessment Sheet Clipart PDF
Following slide displays assessment sheet that can be used by members to record overall asset maintenance cost for further analysis. Sections covered in the sheet are onsite solution, initial, monthly and annual cost.This is a IT Threats Response Playbook Asset Maintenance Cost Assessment Sheet Clipart PDF template with various stages. Focus and dispense information on one stage using this creative set, that comes with editable features. It contains large content boxes to add your information on topics like Application Servers, Desktop Systems, Onsite Solution. You can also showcase facts, figures, and other relevant content using this PPT layout. Grab it now.
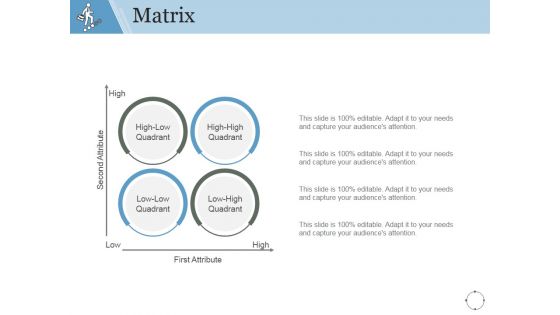
Matrix Ppt PowerPoint Presentation Layouts Portrait
This is a matrix ppt powerpoint presentation layouts portrait. This is a four stage process. The stages in this process are high low quadrant, second attribute, first attribute, low low quadrant.
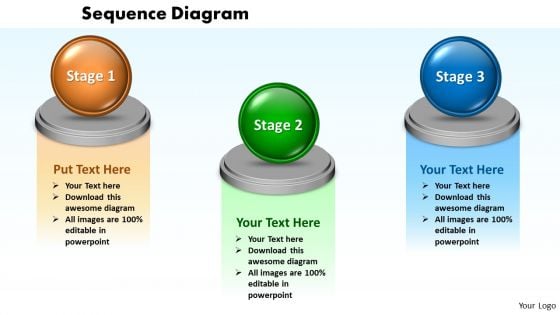
Ppt Sequence Spider Diagram PowerPoint Template 3 Stages Templates
PPT sequence spider diagram powerpoint template 3 stages Templates-This Analogous Diagram PPT slide can be used to help you to see concepts and the relationships between them and externalize your ideas.-PPT sequence spider diagram powerpoint template 3 stages Templates-Abstract, Blank, Business, Chart, Circular, Circulation, Cycle, Design, Diagram, Empty, Executive, Icon, Illustration, Management, Model, Numbers, Organization, Procedure, Process, Resource, Sequence, Sequential, Strategy, Template, Spheres, Circle Charts, Metaphor, Process Restore faith with our Ppt Sequence Spider Diagram PowerPoint Template 3 Stages Templates. Download without worries with our money back guaranteee.
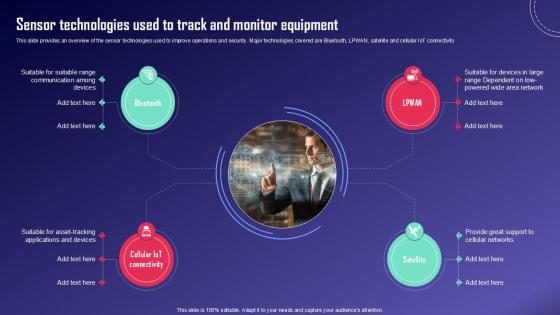
Sensor Technologies Used To IoT Fleet Monitoring Ppt Slide IoT SS V
This slide provides an overview of the sensor technologies used to improve operations and security. Major technologies covered are Bluetooth, LPWAN, satellite and cellular IoT connectivity. Do you have an important presentation coming up Are you looking for something that will make your presentation stand out from the rest Look no further than Sensor Technologies Used To IoT Fleet Monitoring Ppt Slide IoT SS V. With our professional designs, you can trust that your presentation will pop and make delivering it a smooth process. And with Slidegeeks, you can trust that your presentation will be unique and memorable. So why wait Grab Sensor Technologies Used To IoT Fleet Monitoring Ppt Slide IoT SS V today and make your presentation stand out from the rest This slide provides an overview of the sensor technologies used to improve operations and security. Major technologies covered are Bluetooth, LPWAN, satellite and cellular IoT connectivity
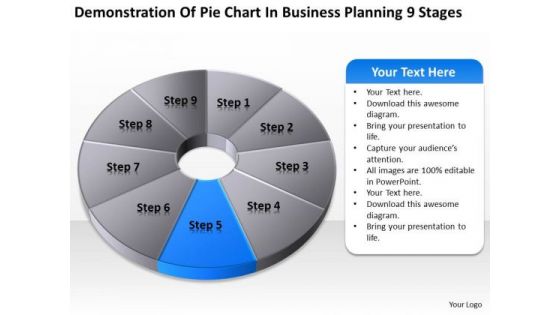
Pie Chart In Business Planning 9 Stages Ppt Template PowerPoint Templates
We present our pie chart in business planning 9 stages ppt template PowerPoint templates.Use our Process and Flows PowerPoint Templates because Our PowerPoint Templates and Slides help you pinpoint your timelines. Highlight the reasons for your deadlines with their use. Use our Circle Charts PowerPoint Templates because You can Channelise the thoughts of your team with our PowerPoint Templates and Slides. Urge them to focus on the goals you have set. Download our Business PowerPoint Templates because Our PowerPoint Templates and Slides will provide you a launch platform. Give a lift off to your ideas and send them into orbit. Download our Shapes PowerPoint Templates because You can Create a matrix with our PowerPoint Templates and Slides. Feel the strength of your ideas click into place. Download and present our Marketing PowerPoint Templates because Our PowerPoint Templates and Slides will fulfill your every need. Use them and effectively satisfy the desires of your audience.Use these PowerPoint slides for presentations relating to Chart, pie, graph, wheel, vector, process, marketing, diagram, business, website, network, statistics, document, junction, plan, presentation, circle, brochure, data, stock, management, options, direction, design, company, navigation, financial, structure, button, goals. The prominent colors used in the PowerPoint template are Blue, Gray, Black. Create the aroma with our Pie Chart In Business Planning 9 Stages Ppt Template PowerPoint Templates. Draw the crowds to your views.
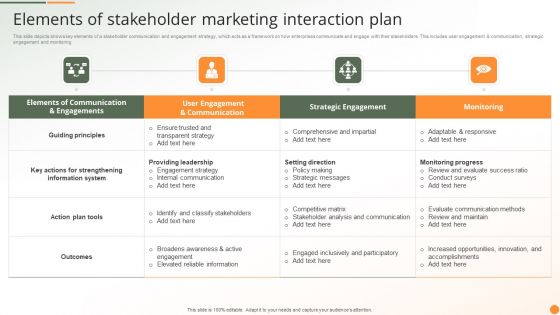
Elements Of Stakeholder Marketing Interaction Plan Ppt PowerPoint Presentation Gallery Mockup PDF
This slide depicts shows key elements of a stakeholder communication and engagement strategy, which acts as a framework on how enterprises communicate and engage with their stakeholders. This includes user engagement communication, strategic engagement and monitoring.Pitch your topic with ease and precision using this Elements Of Stakeholder Marketing Interaction Plan Ppt PowerPoint Presentation Gallery Mockup PDF. This layout presents information on Communication Engagements, Strategic Engagement, Information System. It is also available for immediate download and adjustment. So, changes can be made in the color, design, graphics or any other component to create a unique layout.
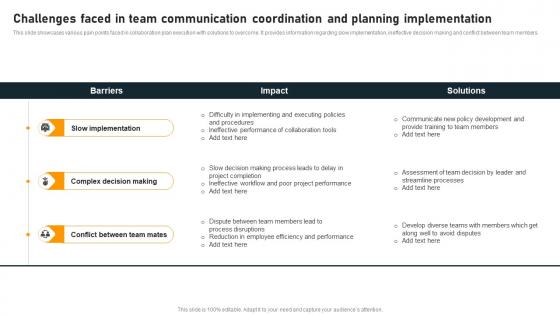
Challenges Faced In Team Communication Coordination And Planning Implementation Themes Pdf
This slide showcases various pain points faced in collaboration plan execution with solutions to overcome. It provides information regarding slow implementation, ineffective decision making and conflict between team members. Pitch your topic with ease and precision using this Challenges Faced In Team Communication Coordination And Planning Implementation Themes Pdf. This layout presents information on Slow Implementation, Complex Decision Making, Conflict Between Team Mates. It is also available for immediate download and adjustment. So, changes can be made in the color, design, graphics or any other component to create a unique layout. This slide showcases various pain points faced in collaboration plan execution with solutions to overcome. It provides information regarding slow implementation, ineffective decision making and conflict between team members.
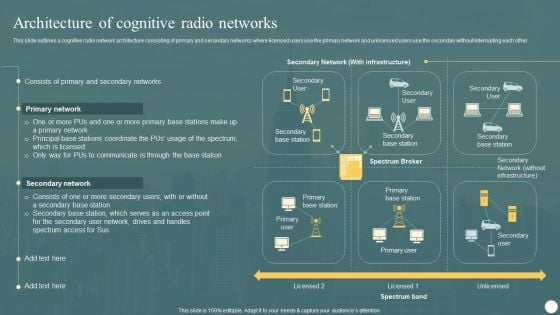
Cognitive Radio Network IT Architecture Of Cognitive Radio Networks Topics PDF
This slide outlines a cognitive radio network architecture consisting of primary and secondary networks where licensed users use the primary network and unlicensed users use the secondary without interrupting each other. Want to ace your presentation in front of a live audience Our Cognitive Radio Network IT Architecture Of Cognitive Radio Networks Topics PDF can help you do that by engaging all the users towards you. Slidegeeks experts have put their efforts and expertise into creating these impeccable powerpoint presentations so that you can communicate your ideas clearly. Moreover, all the templates are customizable, and easy to edit and downloadable. Use these for both personal and commercial use.
Curved Arrow Diagram Interrelatd 3 Stages How To Business Plan PowerPoint Slides
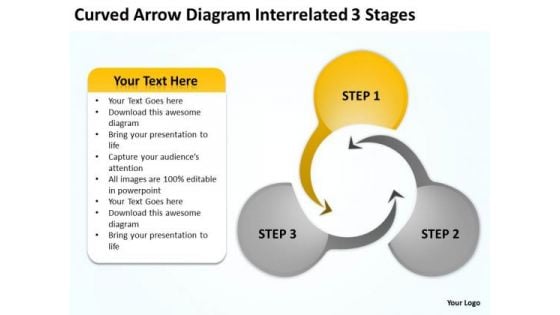
We present our curved arrow diagram interrelatd 3 stages how to business plan PowerPoint Slides.Download our Business PowerPoint Templates because Our PowerPoint Templates and Slides are truly out of this world. Even the MIB duo has been keeping tabs on our team. Download and present our Arrows PowerPoint Templates because Our PowerPoint Templates and Slides are the chords of your song. String them along and provide the lilt to your views. Use our Shapes PowerPoint Templates because It can be used to Set your controls for the heart of the sun. Our PowerPoint Templates and Slides will be the propellant to get you there. Download and present our Circle Charts PowerPoint Templates because Our PowerPoint Templates and Slides will let you Hit the right notes. Watch your audience start singing to your tune. Present our Process and Flows PowerPoint Templates because Our PowerPoint Templates and Slides offer you the widest possible range of options.Use these PowerPoint slides for presentations relating to Arrow, diagram, vector, circular, isolated, model,Arrow, diagram, vector, circular, isolated, model, turn, layout, business, blank, recycling, presentation, circle, ring, recycle, blue, abstract, cycle, icon, www, chart, round, web, design, color, motion, progress, movement, information, background, pattern, button white, turn, layout, business, blank, black, recycling, presentation, circle, ring, recycle, abstract, cycle, icon, www, chart, round, web, design, color, motion, progress, movement, information, background, pattern, button. The prominent colors used in the PowerPoint template are Orange, Gray, Black. Get ahead despite fierce competition. Accelerate away from the pack with our Curved Arrow Diagram Interrelatd 3 Stages How To Business Plan PowerPoint Slides.
Comparative Optimization Of Project Portfolio Risk Assessment Tools Structure PDF
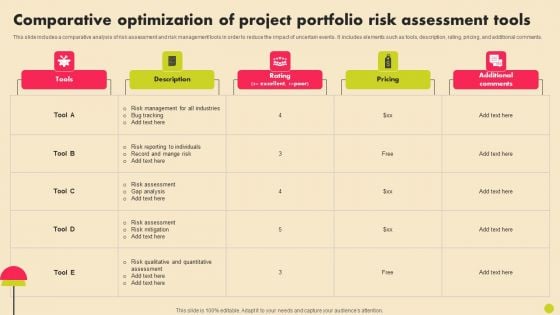
This slide includes a comparative analysis of risk assessment and risk management tools in order to reduce the impact of uncertain events. It includes elements such as tools, description, rating, pricing, and additional comments. Pitch your topic with ease and precision using this Comparative Optimization Of Project Portfolio Risk Assessment Tools Structure PDF. This layout presents information on Risk Management, Risk Reporting, Risk Mitigation . It is also available for immediate download and adjustment. So, changes can be made in the color, design, graphics or any other component to create a unique layout.
Roi Of Advertisement Income Generation Strategy For Social Networking Site Statistics Diagrams PDF
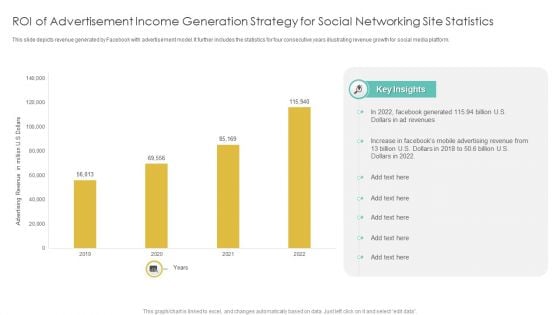
This slide depicts revenue generated by Facebook with advertisement model. It further includes the statistics for four consecutive years illustrating revenue growth for social media platform. Pitch your topic with ease and precision using this Roi Of Advertisement Income Generation Strategy For Social Networking Site Statistics Diagrams PDF. This layout presents information on Advertisement Income, Generation Strategy, Social Networking Site Statistics. It is also available for immediate download and adjustment. So, changes can be made in the color, design, graphics or any other component to create a unique layout.
Work Pattern Analysis Pre And Post Covid Pictures PDF
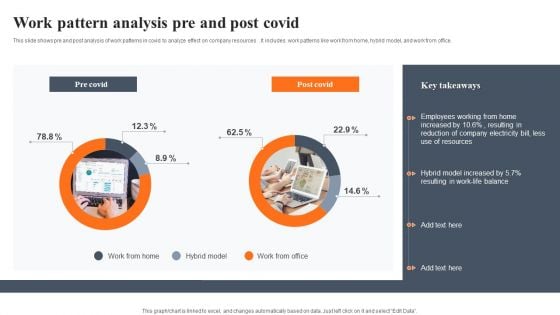
This slide shows pre and post analysis of work patterns in covid to analyze effect on company resources . It includes work patterns like work from home, hybrid model, and work from office. Pitch your topic with ease and precision using this Work Pattern Analysis Pre And Post Covid Pictures PDF. This layout presents information on Work Pattern Analysis, Pre And Post Covid. It is also available for immediate download and adjustment. So, changes can be made in the color, design, graphics or any other component to create a unique layout.
Data Expansion Trends For Global Home Ware Market Icons PDF
This slide shows data growth trends for home ware industry that presents incremental growth, CAGR and other figures etc. It include figure next year growth and incremental growth etc. Pitch your topic with ease and precision using this Data Expansion Trends For Global Home Ware Market Icons PDF. This layout presents information on Incremental Growth Figures, Growth Rate Predicted, Fragmented Market Model. It is also available for immediate download and adjustment. So, changes can be made in the color, design, graphics or any other component to create a unique layout.
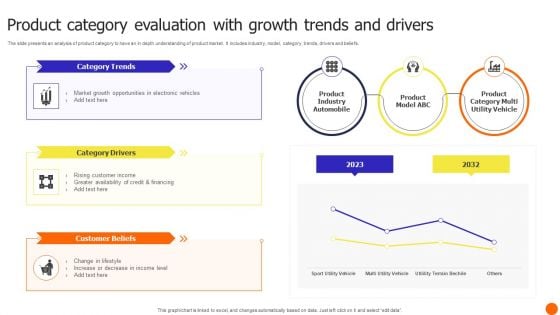
Product Category Evaluation With Growth Trends And Drivers Themes PDF
The slide presents an analysis of product category to have an in depth understanding of product market. It includes industry, model, category, trends, drivers and beliefs. Pitch your topic with ease and precision using this Product Category Evaluation With Growth Trends And Drivers Themes PDF. This layout presents information on Product Industry Automobile, Customer Beliefs, Category Drivers. It is also available for immediate download and adjustment. So, changes can be made in the color, design, graphics or any other component to create a unique layout.
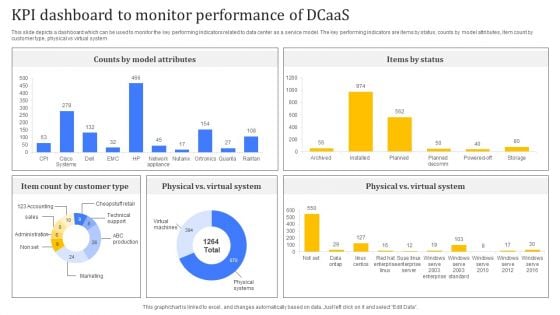
KPI Dashboard To Monitor Performance Of Dcaas Pictures PDF
Following slide highlights major benefits of applying data center as a service to business operations which can be used by businesses looking to modernize their IT infrastructure. Major benefits are in terms of scalability, flexibility, cost effectiveness, and security. Pitch your topic with ease and precision using this KPI Dashboard To Monitor Performance Of Dcaas Pictures PDF. This layout presents information on Customer Type, Counts By Model Attributes, Items By Status. It is also available for immediate download and adjustment. So, changes can be made in the color, design, graphics or any other component to create a unique layout.
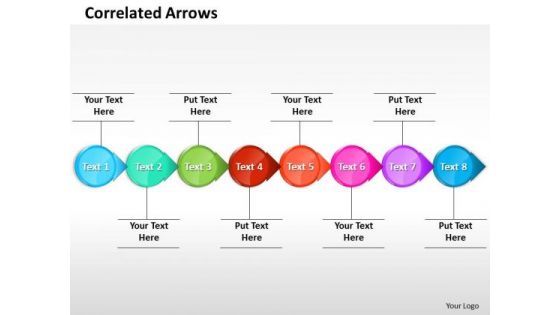
Ppt Correlated Circular 3d Arrows PowerPoint Horizontal Line 8 Stages Templates
PPT correlated circular 3d arrows powerpoint horizontal line 8 stages Templates-This PowerPoint Diagram shows you Correlated Circular Arrows in Horizontal Line which signifies step by step Execution, inter-related approaches etc.-PPT correlated circular 3d arrows powerpoint horizontal line 8 stages Templates-3d, Advertisement, Advertising, Arrow, Border, Business, Circles, Collection, Customer, Design, Element, Icon, Idea, Illustration, Info, Information, Isolated, Label, Light, Location, Needle, New, Notification, Notify, Point, Pointer, Promotion, Role, Rounded Audience comprehension is highly desirable. Our Ppt Correlated Circular 3d Arrows PowerPoint Horizontal Line 8 Stages Templates make it feasible.
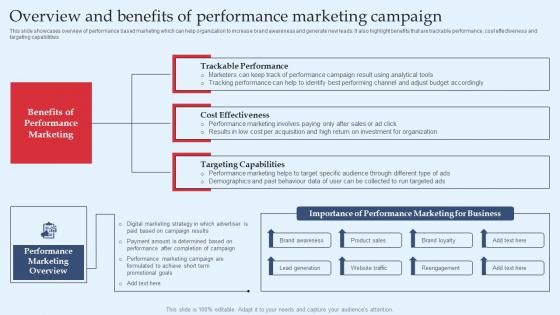
Overview And Benefits Of Performance Marketing Strategic Performance Marketing Structure Pdf
This slide showcases overview of performance based marketing which can help organization to increase brand awareness and generate new leads. It also highlight benefits that are trackable performance, cost effectiveness and targeting capabilities. Create an editable Overview And Benefits Of Performance Marketing Strategic Performance Marketing Structure Pdf that communicates your idea and engages your audience. Whether you are presenting a business or an educational presentation, pre-designed presentation templates help save time. Overview And Benefits Of Performance Marketing Strategic Performance Marketing Structure Pdf is highly customizable and very easy to edit, covering many different styles from creative to business presentations. Slidegeeks has creative team members who have crafted amazing templates. So, go and get them without any delay. This slide showcases overview of performance based marketing which can help organization to increase brand awareness and generate new leads. It also highlight benefits that are trackable performance, cost effectiveness and targeting capabilities.
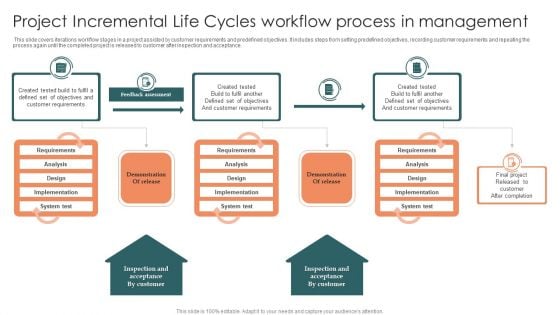
Project Incremental Life Cycles Workflow Process In Management Sample PDF
This slide covers iterations workflow stages in a project assisted by customer requirements and predefined objectives. It includes steps from setting predefined objectives, recording customer requirements and repeating the process again until the completed project is released to customer after inspection and acceptance. Presenting Project Incremental Life Cycles Workflow Process In Management Sample PDF to dispense important information. This template comprises Three stages. It also presents valuable insights into the topics including Requirements, Analysis, Design. This is a completely customizable PowerPoint theme that can be put to use immediately. So, download it and address the topic impactfully.
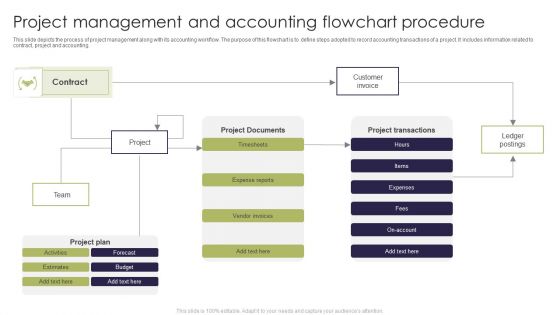
Project Management And Accounting Flowchart Procedure Sample PDF
This slide depicts the process of project management along with its accounting workflow. The purpose of this flowchart is to define steps adopted to record accounting transactions of a project. It includes information related to contract, project and accounting. Pitch your topic with ease and precision using this Project Management And Accounting Flowchart Procedure Sample PDF. This layout presents information on Customer Invoice, Ledger Postings. It is also available for immediate download and adjustment. So, changes can be made in the color, design, graphics or any other component to create a unique layout.
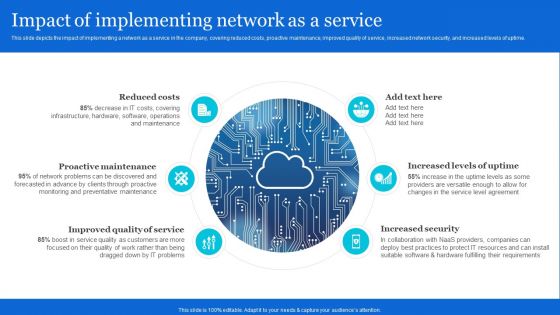
Naas Architectural Framework Impact Of Implementing Network As A Service Structure PDF
This slide depicts the impact of implementing a network as a service in the company, covering reduced costs, proactive maintenance, improved quality of service, increased network security, and increased levels of uptime. Do you have an important presentation coming up Are you looking for something that will make your presentation stand out from the rest Look no further than Naas Architectural Framework Impact Of Implementing Network As A Service Structure PDF. With our professional designs, you can trust that your presentation will pop and make delivering it a smooth process. And with Slidegeeks, you can trust that your presentation will be unique and memorable. So why wait Grab Naas Architectural Framework Impact Of Implementing Network As A Service Structure PDF today and make your presentation stand out from the rest.
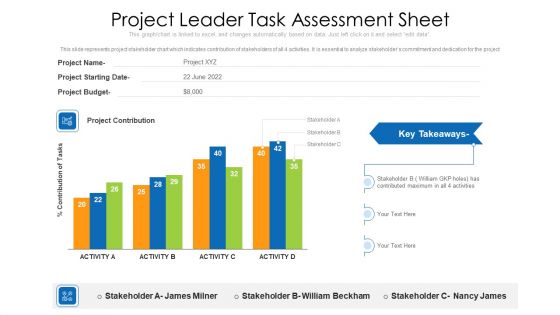
Project Leader Task Assessment Sheet Ppt PowerPoint Presentation Gallery Outline PDF
This slide represents project stakeholder chart which indicates contribution of stakeholders of all 4 activities. It is essential to analyze stakeholders commitment and dedication for the project. Pitch your topic with ease and precision using this project leader task assessment sheet ppt powerpoint presentation gallery outline pdf. This layout presents information on project leader task assessment sheet. It is also available for immediate download and adjustment. So, changes can be made in the color, design, graphics or any other component to create a unique layout.
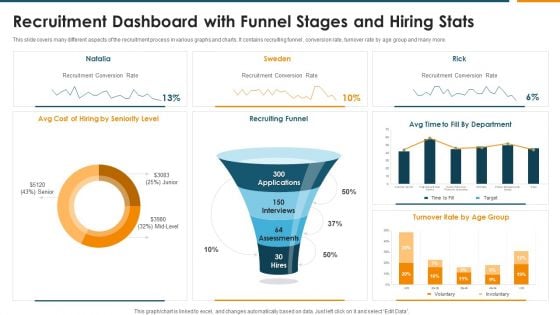
Recruitment Dashboard With Funnel Stages And Hiring Stats Rules PDF
This slide covers many different aspects of the recruitment process in various graphs and charts. It contains recruiting funnel , conversion rate, turnover rate by age group and many more. Pitch your topic with ease and precision using this Recruitment Dashboard With Funnel Stages And Hiring Stats Rules PDF. This layout presents information on Recruiting Funnel, Recruitment Conversion Rate, Seniority Level. It is also available for immediate download and adjustment. So, changes can be made in the color, design, graphics or any other component to create a unique layout.
Finance Metrics Dashboard Illustrating Account Payables Icons PDF
This graph or chart is linked to excel, and changes automatically based on data. Just left click on it and select edit data. Pitch your topic with ease and precision using this Total Income Budget, Total Expenses Balance, Net Profit Quick, Ratio Current Ratio. This layout presents information on Account Payable Age, Average Creditor Days, Cash On Hand. It is also available for immediate download and adjustment. So, changes can be made in the color, design, graphics or any other component to create a unique layout.
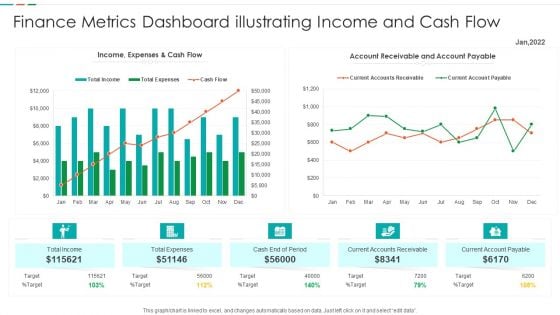
Finance Metrics Dashboard Illustrating Income And Cash Flow Template PDF
This graph or chart is linked to excel, and changes automatically based on data. Just left click on it and select edit data. Pitch your topic with ease and precision using this Finance Metrics Dashboard Illustrating Income And Cash Flow Template PDF. This layout presents information on Current Accounts Receivable, Current Account Payable, Cash End Period, Account Receivable Account. It is also available for immediate download and adjustment. So, changes can be made in the color, design, graphics or any other component to create a unique layout.
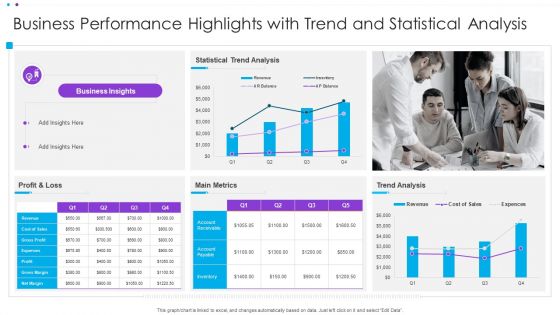
Business Performance Highlights With Trend And Statistical Analysis Ppt Infographic Template Display PDF
This graph or chart is linked to excel, and changes automatically based on data. Just left click on it and select Edit Data. Pitch your topic with ease and precision using this Business Performance Highlights With Trend And Statistical Analysis Ppt Infographic Template Display PDF. This layout presents information on Statistical Trend Analysis, Main Metrics, Profit And Loss. It is also available for immediate download and adjustment. So, changes can be made in the color, design, graphics or any other component to create a unique layout.
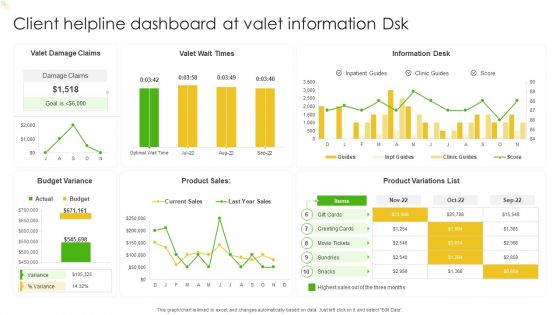
Client Helpline Dashboard At Valet Information Dsk Ppt Gallery Slide Portrait PDF
This graph or chart is linked to excel, and changes automatically based on data. Just left click on it and select Edit Data. Pitch your topic with ease and precision using this Client Helpline Dashboard At Valet Information Dsk Ppt Gallery Slide Portrait PDF. This layout presents information on Valet Damage Claims, Valet Wait Times, Information Desk. It is also available for immediate download and adjustment. So, changes can be made in the color, design, graphics or any other component to create a unique layout.
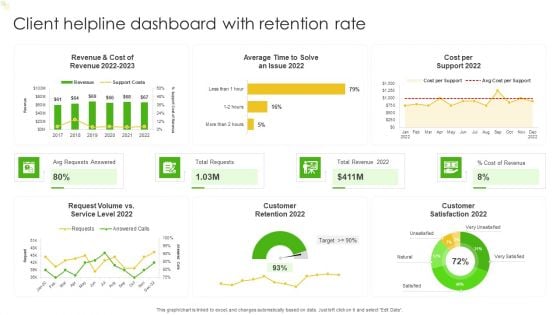
Client Helpline Dashboard With Retention Rate Ppt Gallery Ideas PDF
This graph or chart is linked to excel, and changes automatically based on data. Just left click on it and select Edit Data. Pitch your topic with ease and precision using this Client Helpline Dashboard With Retention Rate Ppt Gallery Ideas PDF. This layout presents information on Cost per Support 2022, Total Requests, Total Revenue 2022, Avg Requests Answered. It is also available for immediate download and adjustment. So, changes can be made in the color, design, graphics or any other component to create a unique layout.
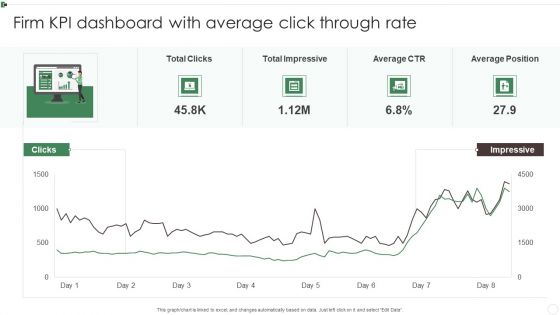
Firm KPI Dashboard With Average Click Through Rate Ppt Inspiration Sample PDF
This graph or chart is linked to excel, and changes automatically based on data. Just left click on it and select Edit Data. Pitch your topic with ease and precision using this Firm KPI Dashboard With Average Click Through Rate Ppt Inspiration Sample PDF. This layout presents information on Total Clicks, Total Impressive, Average CTR, Average Position. It is also available for immediate download and adjustment. So, changes can be made in the color, design, graphics or any other component to create a unique layout.
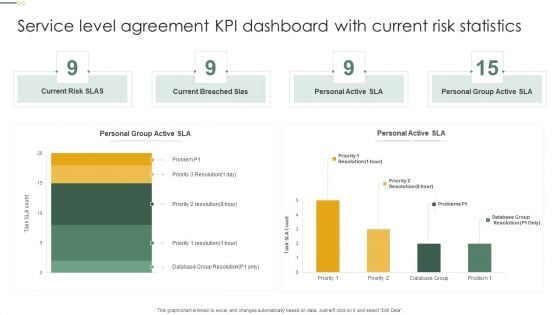
Service Level Agreement KPI Dashboard With Current Risk Statistics Topics PDF
This graph or chart is linked to excel, and changes automatically based on data. Just left click on it and select Edit Data. Pitch your topic with ease and precision using this Service Level Agreement KPI Dashboard With Current Risk Statistics Topics PDF. This layout presents information on Current Risk SLAS, Current Breached Slas, Personal Active SLA It is also available for immediate download and adjustment. So, changes can be made in the color, design, graphics or any other component to create a unique layout.
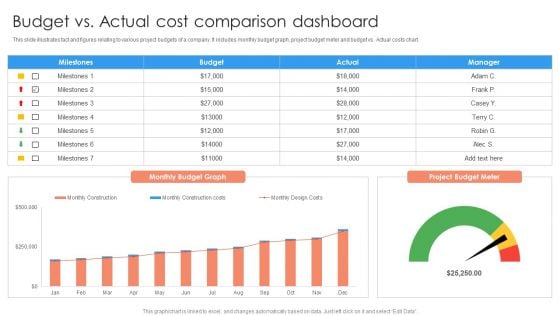
Budget Vs Actual Cost Comparison Dashboard Ppt PowerPoint Presentation Professional Format Ideas PDF
This slide illustrates fact and figures relating to various project budgets of a company. It includes monthly budget graph, project budget meter and budget vs. Actual costs chart.Pitch your topic with ease and precision using this Budget Vs Actual Cost Comparison Dashboard Ppt PowerPoint Presentation Professional Format Ideas PDF. This layout presents information on Milestones, Budget Graph, Manager. It is also available for immediate download and adjustment. So, changes can be made in the color, design, graphics or any other component to create a unique layout.
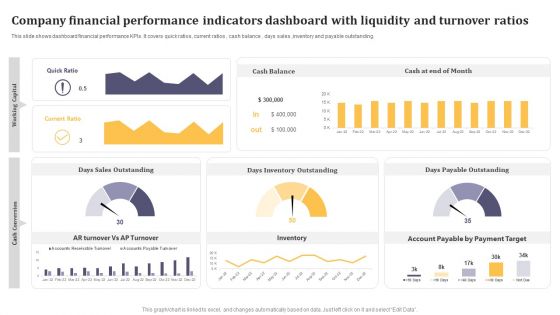
Company Financial Performance Indicators Dashboard With Liquidity And Turnover Ratios Formats PDF
This graph or chart is linked to excel, and changes automatically based on data. Just left click on it and select Edit Data. Pitch your topic with ease and precision using this Company Financial Performance Indicators Dashboard With Liquidity And Turnover Ratios Formats PDF. This layout presents information on Cash Balance, Days Inventory Outstanding, Days Payable Outstanding. It is also available for immediate download and adjustment. So, changes can be made in the color, design, graphics or any other component to create a unique layout.
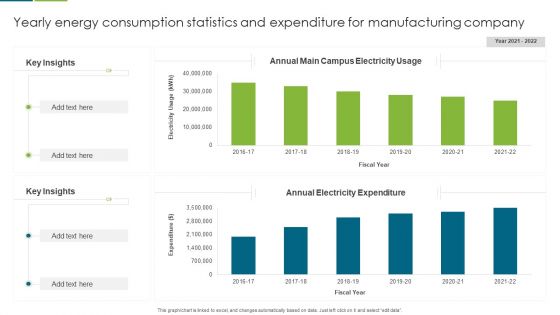
Yearly Energy Consumption Statistics And Expenditure For Manufacturing Company Guidelines PDF
This graph or chart is linked to excel, and changes automatically based on data. Just left click on it and select edit data. Pitch your topic with ease and precision using this Yearly Energy Consumption Statistics And Expenditure For Manufacturing Company Guidelines PDF. This layout presents information on Key Insights, Annual Electricity Expenditure, Annual Main Campus, Electricity Usage. It is also available for immediate download and adjustment. So, changes can be made in the color, design, graphics or any other component to create a unique layout.
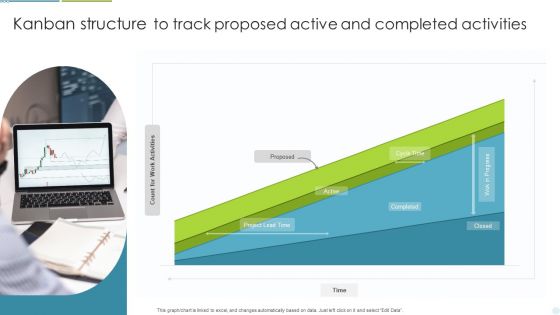
Kanban Structure To Track Proposed Active And Completed Activities Ppt Outline Slide Portrait PDF
This graph or chart is linked to excel, and changes automatically based on data. Just left click on it and select Edit Data. Pitch your topic with ease and precision using this Kanban Structure To Track Proposed Active And Completed Activities Ppt Outline Slide Portrait PDF. This layout presents information on Project Lead Time, Cycle Time, Completed. It is also available for immediate download and adjustment. So, changes can be made in the color, design, graphics or any other component to create a unique layout.
Customer Service Request Tickets Administration Dashboard Icons PDF
This slide covers division of tickets into different groups. It also includes a pie chart dividing tickets in multiple categories such as status, tech groups, alert level, request type and alert condition. Pitch your topic with ease and precision using this Customer Service Request Tickets Administration Dashboard Icons PDF. This layout presents information on Tickets Activity, Tickets Alert Level, Tickets Teach Group. It is also available for immediate download and adjustment. So, changes can be made in the color, design, graphics or any other component to create a unique layout.
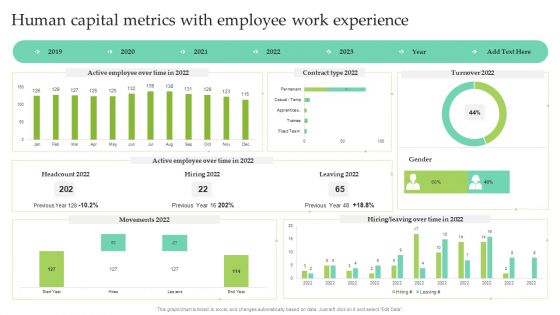
Human Capital Metrics With Employee Work Experience Ppt Show Images PDF
This graph or chart is linked to excel, and changes automatically based on data. Just left click on it and select Edit Data. Pitch your topic with ease and precision using this Human Capital Metrics With Employee Work Experience Ppt Show Images PDF. This layout presents information on Active Employee, Over Time, Contract Type 2022, Leaving 2022. It is also available for immediate download and adjustment. So, changes can be made in the color, design, graphics or any other component to create a unique layout.
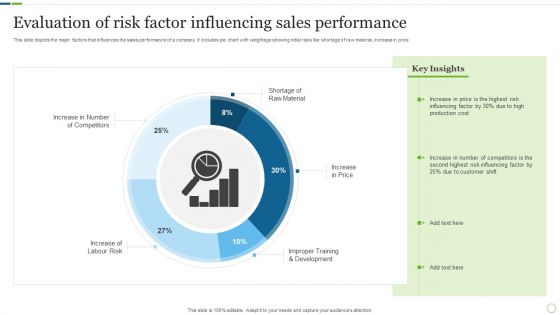
Evaluation Of Risk Factor Influencing Sales Performance Inspiration PDF
This slide depicts the major factors that influences the sales performance of a company. It includes pie chart with weightage showing initial risks like shortage of raw material, increase in price. Pitch your topic with ease and precision using this Evaluation Of Risk Factor Influencing Sales Performance Inspiration PDF. This layout presents information on Production Cost, Customer Shift, Risk Influencing. It is also available for immediate download and adjustment. So, changes can be made in the color, design, graphics or any other component to create a unique layout.
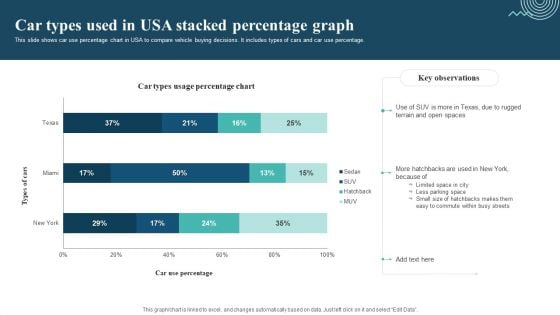
Car Types Used In Usa Stacked Percentage Graph Sample PDF
This slide shows car use percentage chart in USA to compare vehicle buying decisions. It includes types of cars and car use percentage. Pitch your topic with ease and precision using this Car Types Used In Usa Stacked Percentage Graph Sample PDF. This layout presents information on Limited Space In City, Less Parking Space, Easy To Commute. It is also available for immediate download and adjustment. So, changes can be made in the color, design, graphics or any other component to create a unique layout.
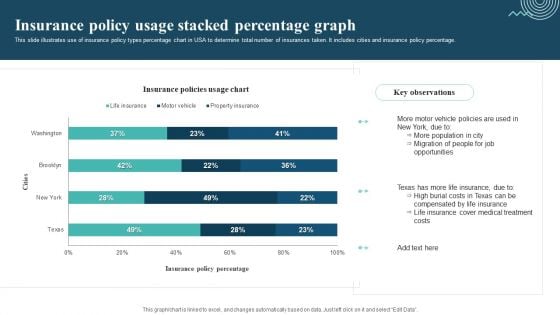
Insurance Policy Usage Stacked Percentage Graph Template PDF
This slide illustrates use of insurance policy types percentage chart in USA to determine total number of insurances taken. It includes cities and insurance policy percentage. Pitch your topic with ease and precision using this Insurance Policy Usage Stacked Percentage Graph Template PDF. This layout presents information on Motor Vehicle Policies, More Population, Migration Of People. It is also available for immediate download and adjustment. So, changes can be made in the color, design, graphics or any other component to create a unique layout.
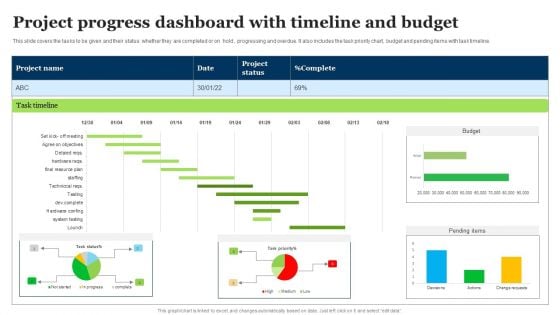
Project Progress Dashboard With Timeline And Budget Mockup PDF
This slide covers the tasks to be given and their status whether they are completed or on hold , progressing and overdue. It also includes the task priority chart, budget and pending items with task timeline. Pitch your topic with ease and precision using this Project Progress Dashboard With Timeline And Budget Mockup PDF. This layout presents information on Task Timeline, Project Status, Pending Items. It is also available for immediate download and adjustment. So, changes can be made in the color, design, graphics or any other component to create a unique layout.
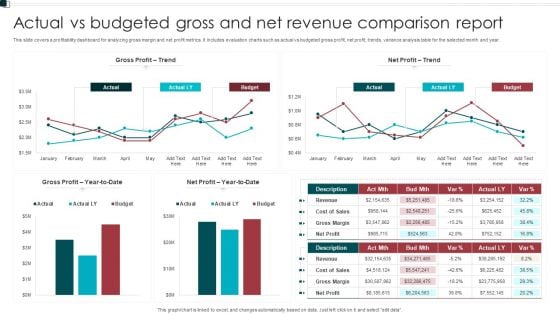
Actual Vs Budgeted Gross And Net Revenue Comparison Report Sample PDF
This slide covers a profitability dashboard for analyzing gross margin and net profit metrics. It includes evaluation charts such as actual vs budgeted gross profit, net profit, trends, variance analysis table for the selected month and year. Pitch your topic with ease and precision using this Actual Vs Budgeted Gross And Net Revenue Comparison Report Sample PDF. This layout presents information on Gross Profit, Net Profit, Budget. It is also available for immediate download and adjustment. So, changes can be made in the color, design, graphics or any other component to create a unique layout.
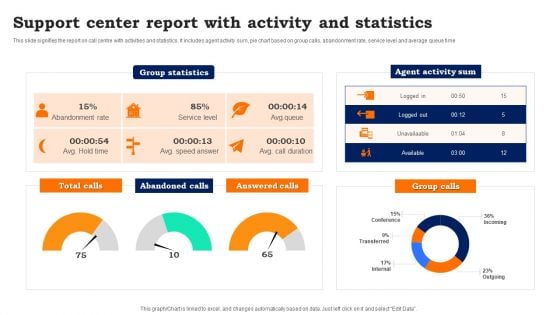
Support Center Report With Activity And Statistics Guidelines PDF
This slide signifies the report on call centre with activities and statistics. It includes agent activity sum, pie chart based on group calls, abandonment rate, service level and average queue time. Pitch your topic with ease and precision using this Support Center Report With Activity And Statistics Guidelines PDF. This layout presents information on Support Center Report, Activity And Statistics. It is also available for immediate download and adjustment. So, changes can be made in the color, design, graphics or any other component to create a unique layout.
Project Error Tracking KPI Dashboard Themes PDF
This slide illustrates the dashboard for the project issue tracking and management. It includes the column chart for issues assignee, incomplete issues by priority and project, monthly percentage increase in issues created and closed, etc. Pitch your topic with ease and precision using this Project Error Tracking KPI Dashboard Themes PDF. This layout presents information on Issues Assignee, Issue Status, Incomplete Issues. It is also available for immediate download and adjustment. So, changes can be made in the color, design, graphics or any other component to create a unique layout.
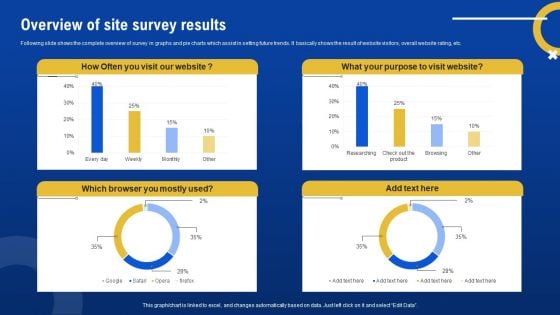
Overview Of Site Survey Results Survey SS
Following slide shows the complete overview of survey in graphs and pie charts which assist in setting future trends. It basically shows the result of website visitors, overall website rating, etc. Pitch your topic with ease and precision using this Overview Of Site Survey Results Survey SS. This layout presents information on Overview, Site Survey Results. It is also available for immediate download and adjustment. So, changes can be made in the color, design, graphics or any other component to create a unique layout.
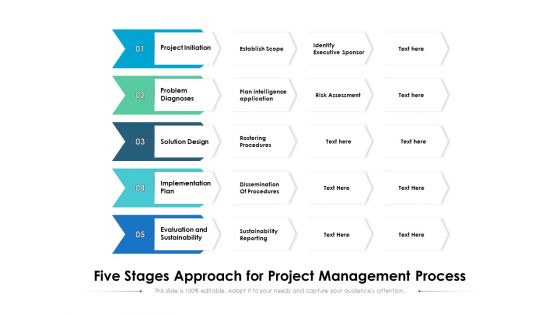
Five Stages Approach For Project Management Process Ppt PowerPoint Presentation Model Portrait PDF
Presenting five stages approach for project management process ppt powerpoint presentation model portrait pdf to dispense important information. This template comprises five stages. It also presents valuable insights into the topics including project initiation, problem diagnoses, solution design, implementation plan, evaluation and sustainability. This is a completely customizable PowerPoint theme that can be put to use immediately. So, download it and address the topic impactfully.
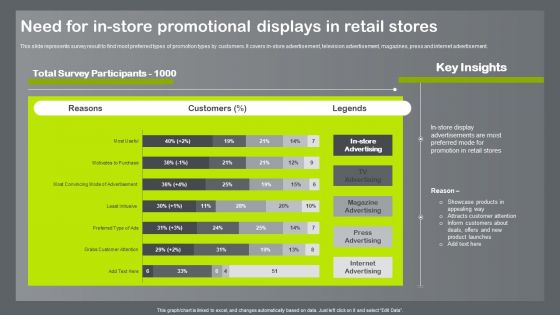
Shopper And Client Marketing Plan To Boost Sales Need For In Store Promotional Displays In Retail Stores Mockup PDF
This slide represents survey result to find most preferred types of promotion types by customers. It covers in-store advertisement, television advertisement, magazines, press and internet advertisement. This Shopper And Client Marketing Plan To Boost Sales Need For In Store Promotional Displays In Retail Stores Mockup PDF from Slidegeeks makes it easy to present information on your topic with precision. It provides customization options, so you can make changes to the colors, design, graphics, or any other component to create a unique layout. It is also available for immediate download, so you can begin using it right away. Slidegeeks has done good research to ensure that you have everything you need to make your presentation stand out. Make a name out there for a brilliant performance.
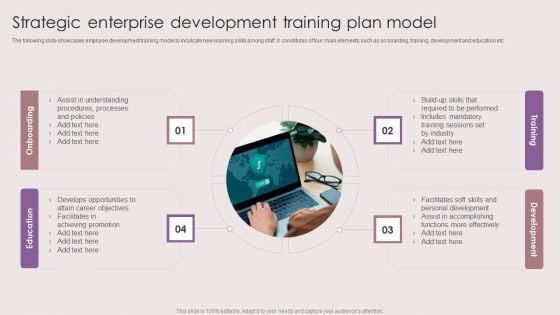
Strategic Enterprise Development Training Plan Model Introduction PDF
The following slide showcases employee development training model to inculcate new learning skills among staff. It constitutes of four main elements such as on boarding, training, development and education etc. Presenting Strategic Enterprise Development Training Plan Model Introduction PDF to dispense important information. This template comprises four stages. It also presents valuable insights into the topics including Onboarding, Education, Training, Development. This is a completely customizable PowerPoint theme that can be put to use immediately. So, download it and address the topic impactfully.
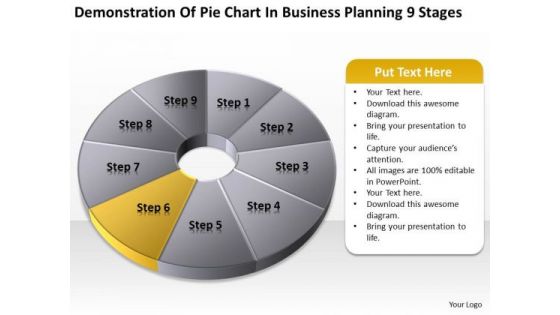
Pie Chart In Business Planning 9 Stages Ppt Assistance PowerPoint Slides
We present our pie chart in business planning 9 stages ppt assistance PowerPoint Slides.Use our Process and Flows PowerPoint Templates because Our PowerPoint Templates and Slides provide you with a vast range of viable options. Select the appropriate ones and just fill in your text. Download our Circle Charts PowerPoint Templates because They will bring a lot to the table. Their alluring flavours will make your audience salivate. Download our Business PowerPoint Templates because They will Put your wonderful verbal artistry on display. Our PowerPoint Templates and Slides will provide you the necessary glam and glitter. Use our Shapes PowerPoint Templates because They will Put the wind in your sails. Skim smoothly over the choppy waters of the market. Present our Marketing PowerPoint Templates because It will Strengthen your hand with your thoughts. They have all the aces you need to win the day.Use these PowerPoint slides for presentations relating to Chart, pie, graph, wheel, vector, process, marketing, diagram, business, website, network, statistics, document, junction, plan, presentation, circle, brochure, data, stock, management, options, direction, design, company, navigation, financial, structure, button, goals. The prominent colors used in the PowerPoint template are Yellow, Black, Gray. Our Pie Chart In Business Planning 9 Stages Ppt Assistance PowerPoint Slides project your erudite nature. They bring your depth of knowledge to the surface.
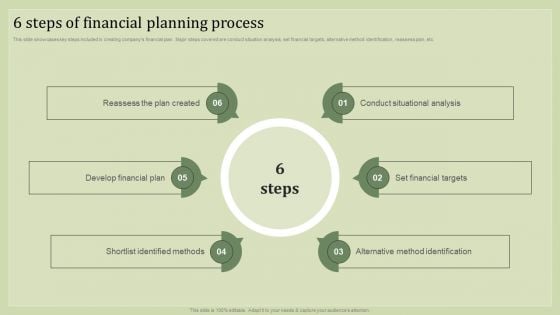
Strategic Financial Plan 6 Steps Of Financial Planning Process Clipart PDF
This slide showcases key steps included in creating companys financial plan. Major steps covered are conduct situation analysis, set financial targets, alternative method identification, reassess plan, etc. Find a pre-designed and impeccable Strategic Financial Plan 6 Steps Of Financial Planning Process Clipart PDF. The templates can ace your presentation without additional effort. You can download these easy-to-edit presentation templates to make your presentation stand out from others. So, what are you waiting for Download the template from Slidegeeks today and give a unique touch to your presentation.
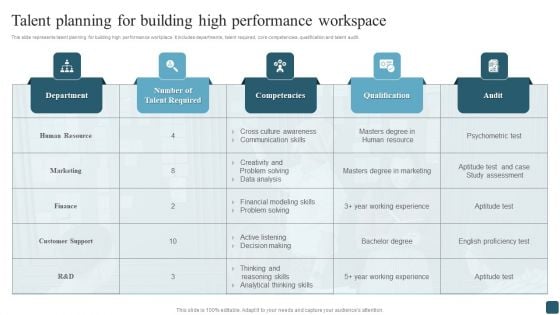
Talent Planning For Building High Performance Workspace Structure PDF
This slide represents talent planning for building high performance workplace. It includes departments, talent required, core competencies, qualification and talent audit. This Talent Planning For Building High Performance Workspace Structure PDF from Slidegeeks makes it easy to present information on your topic with precision. It provides customization options, so you can make changes to the colors, design, graphics, or any other component to create a unique layout. It is also available for immediate download, so you can begin using it right away. Slidegeeks has done good research to ensure that you have everything you need to make your presentation stand out. Make a name out there for a brilliant performance.

Approach For Effective Stakeholder Management Plan Graphics PDF
Following slide exhibits approach to develop management plan for stakeholders to assure engagement. It includes pointers such as inputs, tools, techniques and outputs. This Approach For Effective Stakeholder Management Plan Graphics PDF from Slidegeeks makes it easy to present information on your topic with precision. It provides customization options, so you can make changes to the colors, design, graphics, or any other component to create a unique layout. It is also available for immediate download, so you can begin using it right away. Slidegeeks has done good research to ensure that you have everything you need to make your presentation stand out. Make a name out there for a brilliant performance.
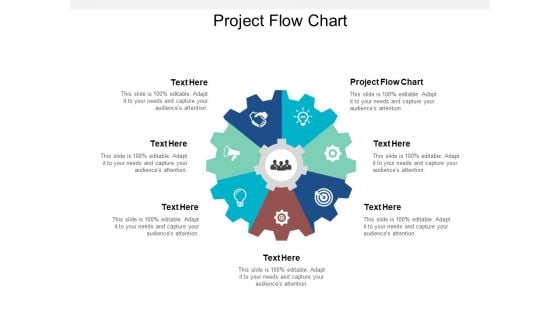
Project Flow Chart Ppt PowerPoint Presentation Show Backgrounds Cpb
Presenting this set of slides with name project flow chart ppt powerpoint presentation show backgrounds cpb. This is a seven stage process. The stages in this process are project flow chart. This is a completely editable PowerPoint presentation and is available for immediate download. Download now and impress your audience.
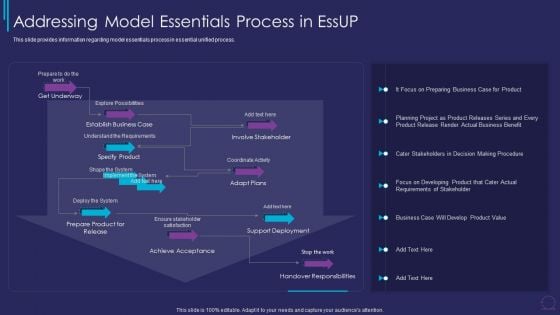
Addressing Model Essentials Process Essup For Agile Software Development Template PDF
This slide provides information regarding model essentials process in essential unified process. Deliver and pitch your topic in the best possible manner with this addressing model essentials process essup for agile software development template pdf. Use them to share invaluable insights on get underway, explore possibilities, involve stakeholder, coordinate activity, adapt plans and impress your audience. This template can be altered and modified as per your expectations. So, grab it now.
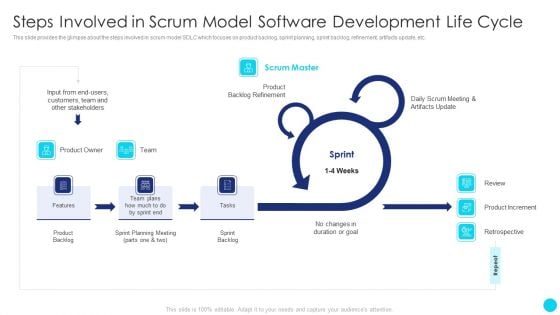
Steps Involved In Scrum Model Software Development Life Cycle Diagrams PDF
This slide provides the glimpse about the steps involved in scrum model SDLC which focuses on product backlog, sprint planning, sprint backlog, refinement, artifacts update, etc. Deliver and pitch your topic in the best possible manner with this Steps Involved In Scrum Model Software Development Life Cycle Diagrams PDF. Use them to share invaluable insights on Product Owner, Team, Sprint Backlog, Product Backlog and impress your audience. This template can be altered and modified as per your expectations. So, grab it now.
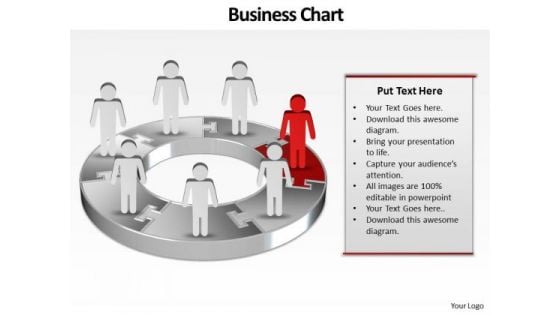
Ppt Circle Of Free Business PowerPoint Templates People With 3d Pie Chart
PPT circle of free business powerpoint templates people with 3d pie chart-Use this PowerPoint Diagram to represent the layers of Linear Process model Graphically. It shows the Red stage in an animated manner through a circular puzzle. You can change color, size and orientation of any icon to your liking.-PPT circle of free business powerpoint templates people with 3d pie chart-Adult, Art, Background, Business, Career, Chart, Communication, Concept, Conference, Corporate, Creative, Design, Economy, Executive, Finance, Group, Growth, Idea, Illustration, Leadership, Meeting, New, Occupation, Office, People, Person, Progress, Silhouette, Space, Speaking, Standing, Success Our Ppt Circle Of Free Business PowerPoint Templates People With 3d Pie Chart never fail to amaze. They catch every eye that comes by.
Framework Administration Icons Slide Ppt Model Demonstration PDF
Download our innovative and attention-grabbing framework administration icons slide ppt model demonstration pdf template. The set of slides exhibit completely customizable icons. These icons can be incorporated into any business presentation. So download it immediately to clearly communicate with your clientele.
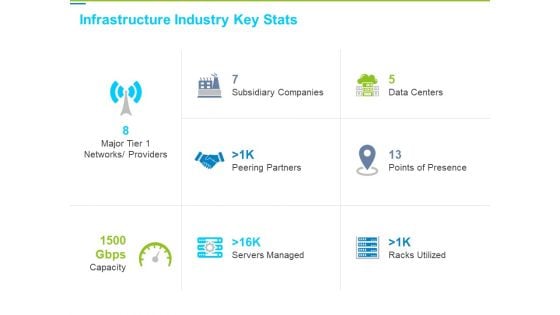
Framework Administration Infrastructure Industry Key Stats Ppt Model Background PDF
Deliver and pitch your topic in the best possible manner with this framework administration infrastructure industry key stats ppt model background pdf. Use them to share invaluable insights on subsidiary companies, data centers, peering partners, servers managed, racks utilized and impress your audience. This template can be altered and modified as per your expectations. So, grab it now.
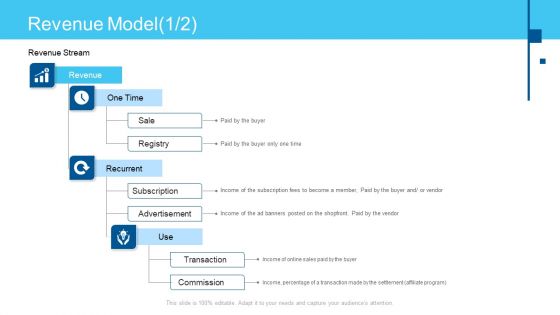
Online Business Framework Revenue Model Sale Sample PDF
Deliver and pitch your topic in the best possible manner with this online business framework revenue model sale sample pdf. Use them to share invaluable insights on sale, registry, subscription and impress your audience. This template can be altered and modified as per your expectations. So, grab it now.
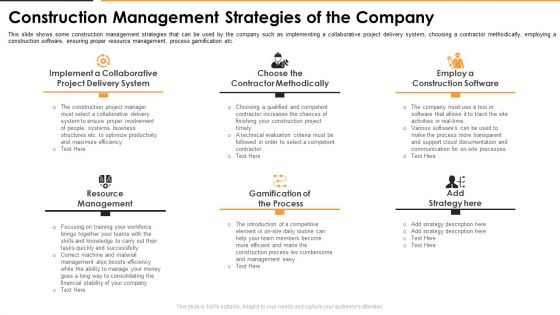
Construction Management Strategies Of The Company Mockup PDF
This slide shows some construction management strategies that can be used by the company such as implementing a collaborative project delivery system, choosing a contractor methodically, employing a construction software, ensuring proper resource management, process gamification etc. This is a construction management strategies of the company mockup pdf template with various stages. Focus and dispense information on six stages using this creative set, that comes with editable features. It contains large content boxes to add your information on topics like system, implement, project, software, process, management. You can also showcase facts, figures, and other relevant content using this PPT layout. Grab it now.
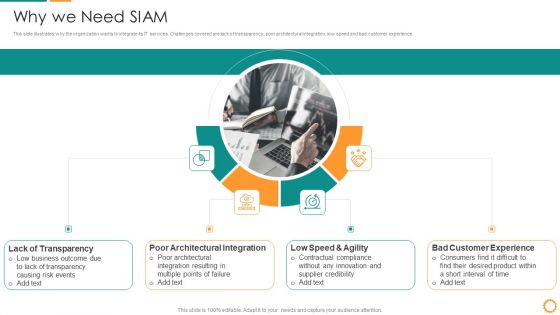
IT Consolidation Post Mergers And Acquisition Why We Need SIAM Inspiration PDF
This slide illustrates why the organization wants to integrate its IT services. Challenges covered are lack of transparency, poor architectural integration, low speed and bad customer experience. This is a IT Consolidation Post Mergers And Acquisition Why We Need SIAM Inspiration PDF template with various stages. Focus and dispense information on four stages using this creative set, that comes with editable features. It contains large content boxes to add your information on topics like Lack Of Transparency, Poor Architectural Integration, Low Speed And Agility, Bad Customer Experience. You can also showcase facts, figures, and other relevant content using this PPT layout. Grab it now.
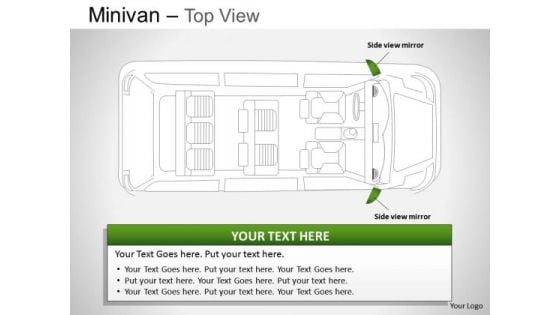
Wheel Green Minivan Top View Slides And Ppt Diagrams Templates
Wheel Green Minivan Top View Slides And PPT Diagrams Templates-These high quality powerpoint pre-designed slides and powerpoint templates have been carefully created by our professional team to help you impress your audience. All slides have been created and are 100% editable in powerpoint. Each and every property of any graphic - color, size, orientation, shading, outline etc. can be modified to help you build an effective powerpoint presentation. Any text can be entered at any point in the powerpoint template or slide. Simply DOWNLOAD, TYPE and PRESENT! Our Wheel Green Minivan Top View Slides And Ppt Diagrams Templates act like a consultant. They advise on the arrangement of your thoughts.


 Continue with Email

 Home
Home


