Program Management Plan
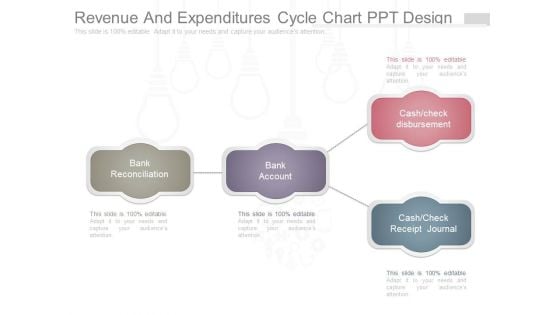
Revenue And Expenditures Cycle Chart Ppt Design
This is a revenue and expenditures cycle chart ppt design. This is a four stage process. The stages in this process are cash check disbursement, cash check receipt journal, bank account, bank reconciliation.
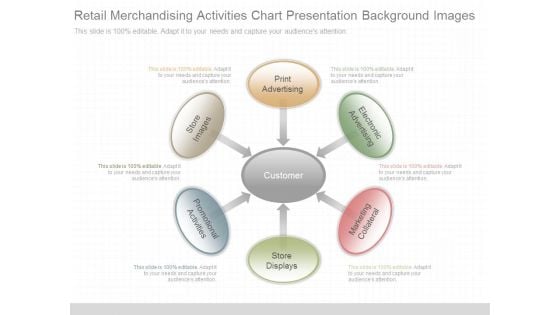
Retail Merchandising Activities Chart Presentation Background Images
This is a retail merchandising activities chart presentation background images. This is a six stage process. The stages in this process are customer, print advertising, electronic advertising, marketing collateral, store displays, promotional activities, store images.
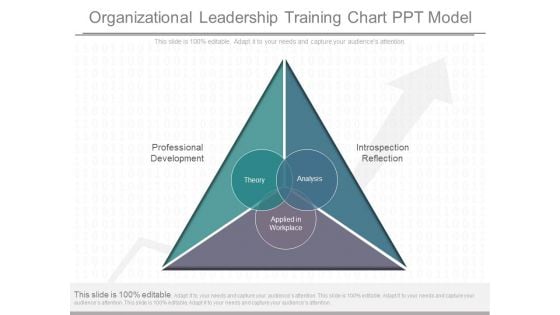
Organizational Leadership Training Chart Ppt Model
This is a organizational leadership training chart ppt model. This is a three stage process. The stages in this process are professional development, introspection reflection, applied in workplace, theory, analysis.
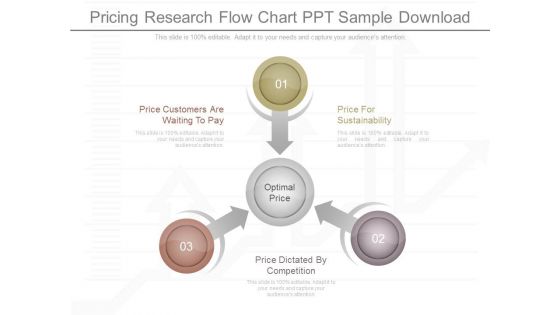
Pricing Research Flow Chart Ppt Sample Download
This is a pricing research flow chart ppt sample download. This is a three stage process. The stages in this process are price customers are waiting to pay, price dictated by competition, optimal price, price for sustainability.
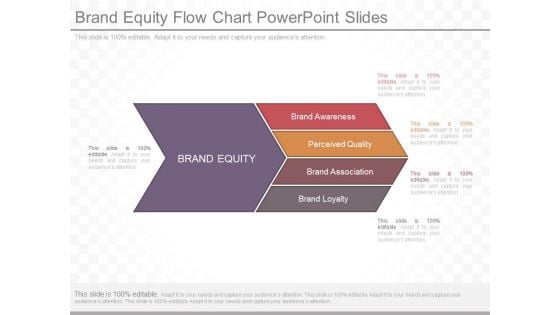
Brand Equity Flow Chart Powerpoint Slides
This is a brand equity flow chart powerpoint slides. This is a five stage process. The stages in this process are brand equity, brand awareness, perceived quality, brand association, brand loyalty.
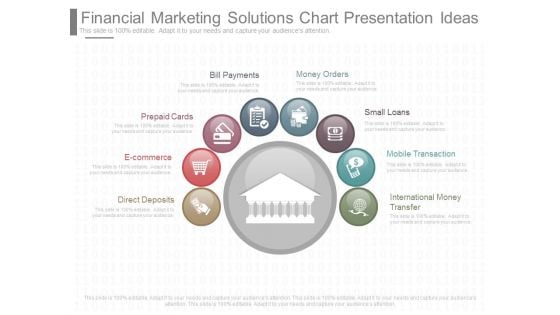
Financial Marketing Solutions Chart Presentation Ideas
This is a financial marketing solutions chart presentation ideas. This is a eight stage process. The stages in this process are direct deposits, e commerce, prepaid cards, bill payments, money orders, small loans, mobile transaction, international money transfer.
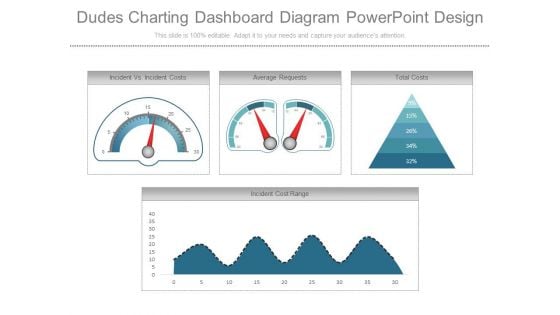
Dudes Charting Dashboard Diagram Powerpoint Design
This is a dudes charting dashboard diagram powerpoint design. This is a four stage process. The stages in this process are incident vs incident costs, average requests, total costs, incident cost range.
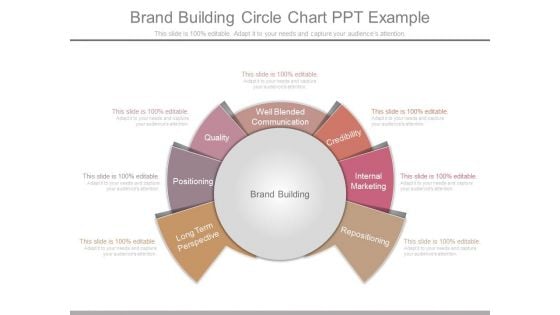
Brand Building Circle Chart Ppt Example
This is a brand building circle chart ppt example. This is a seven stage process. The stages in this process are long term perspective, positioning, quality, well blended communication, credibility, internal marketing, repositioning, brand building.

Market Research Data Collection Chart Presentation
This is a market research data collection chart presentation. This is a five stage process. The stages in this process are concept testing, customer satisfaction, pricing research, market segmentation, awareness usage.
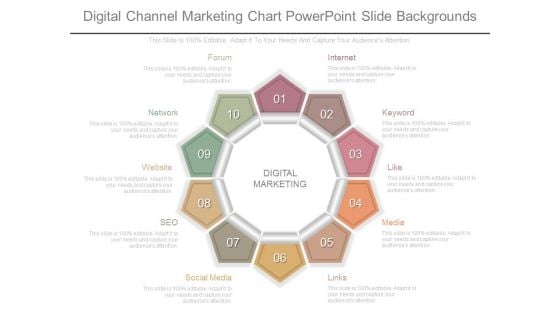
Digital Channel Marketing Chart Powerpoint Slide Backgrounds
This is a digital channel marketing chart powerpoint slide backgrounds. This is a ten stage process. The stages in this process are digital marketing, internet, keyword, like, media, links, social media, seo, website, network, forum.
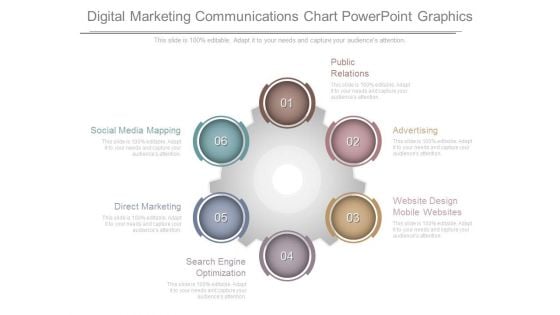
Digital Marketing Communications Chart Powerpoint Graphics
This is a digital marketing communications chart powerpoint graphics. This is a six stage process. The stages in this process are public relations, advertising, website design mobile websites, search engine optimization, direct marketing, social media mapping.
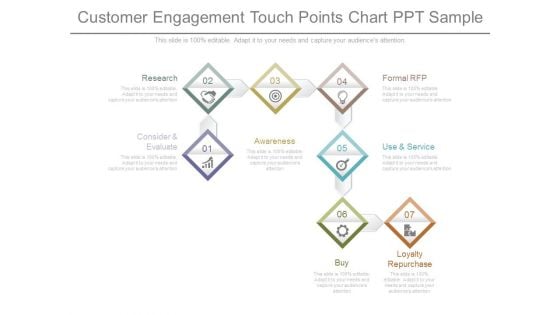
Customer Engagement Touch Points Chart Ppt Sample
This is a customer engagement touch points chart ppt sample. This is a seven stage process. The stages in this process are research, consider and evaluate, awareness, formal rfp, use and service, buy, loyalty repurchase.
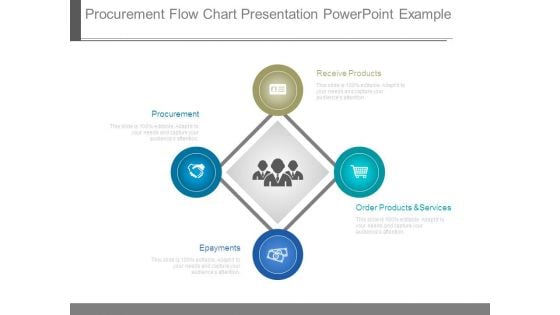
Procurement Flow Chart Presentation Powerpoint Example
This is a procurement flow chart presentation powerpoint example. This is a four stage process. The stages in this process are procurement, epayments, order products and services, receive products.
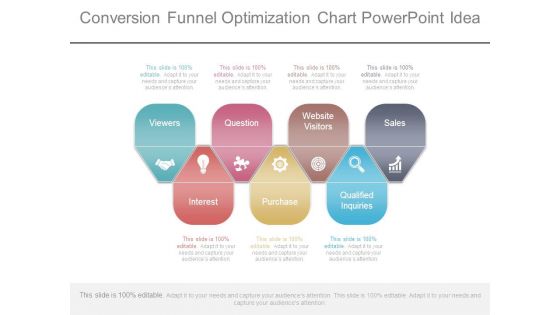
Conversion Funnel Optimization Chart Powerpoint Idea
This is a conversion funnel optimization chart powerpoint idea. This is a seven stage process. The stages in this process are viewers, question, website visitors, sales, interest, purchase, qualified inquiries.
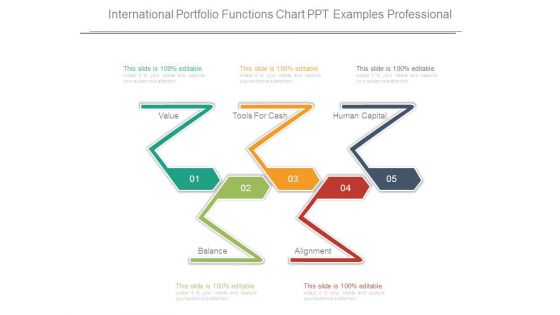
International Portfolio Functions Chart Ppt Examples Professional
This is a international portfolio functions chart ppt examples professional. This is a five stage process. The stages in this process are value, tools for cash, human capital, alignment, balance.
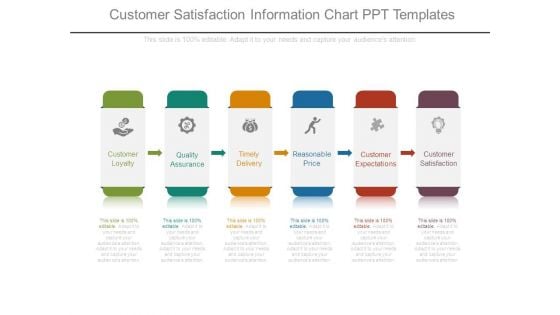
Customer Satisfaction Information Chart Ppt Templates
This is a customer satisfaction information chart ppt templates. This is a six stage process. The stages in this process are customer loyalty, quality assurance, timely delivery, reasonable price, customer expectations, customer satisfaction.
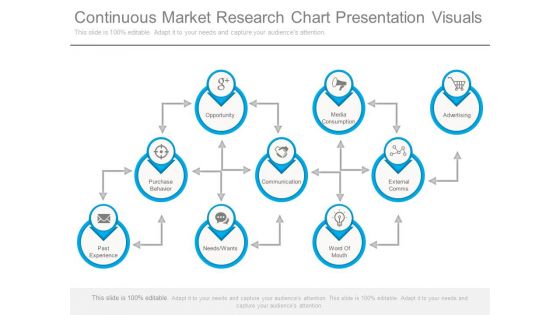
Continuous Market Research Chart Presentation Visuals
This is a continuous market research chart presentation visuals. This is a nine stage process. The stages in this process are opportunity, purchase behavior, past experience, needs wants, word of mouth, external comms, advertising, media consumption, communication.
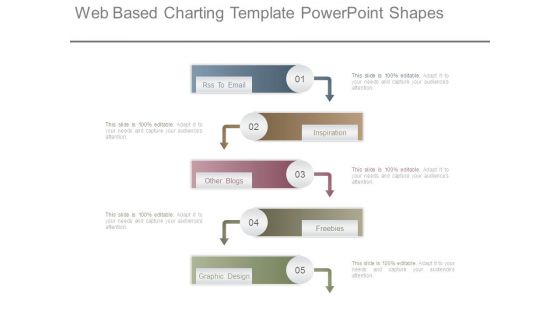
Web Based Charting Template Powerpoint Shapes
This is a web based charting template powerpoint shapes. This is a five stage process. The stages in this process are rss to email, inspiration, other blogs, freebies, graphic design.
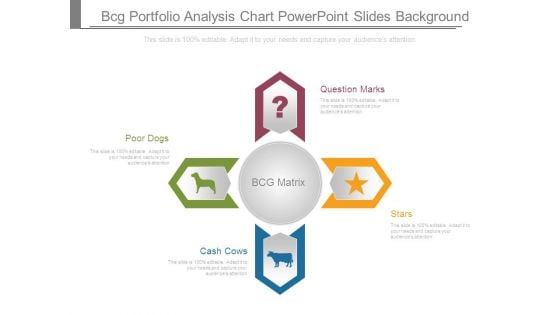
Bcg Portfolio Analysis Chart Powerpoint Slides Background
This is a bcg portfolio analysis chart powerpoint slides background. This is a four stage process. The stages in this process are question marks, stars, cash cows, poor dogs.
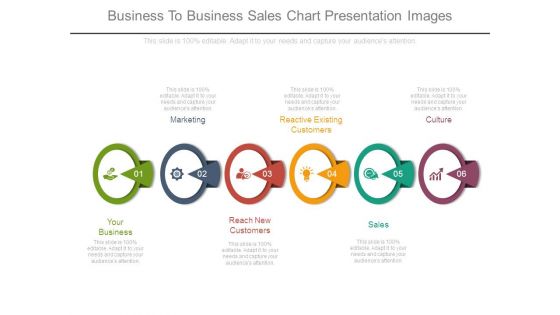
Business To Business Sales Chart Presentation Images
This is a business to business sales chart presentation images. This is a six stage process. The stages in this process are your business, marketing, reactive existing customers, culture, reach new customers, sales.
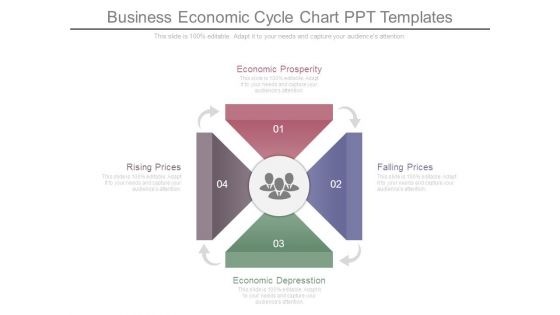
Business Economic Cycle Chart Ppt Templates
This is a business economic cycle chart ppt templates. This is a four stage process. The stages in this process are economic prosperity, falling prices, economic depression, rising prices.
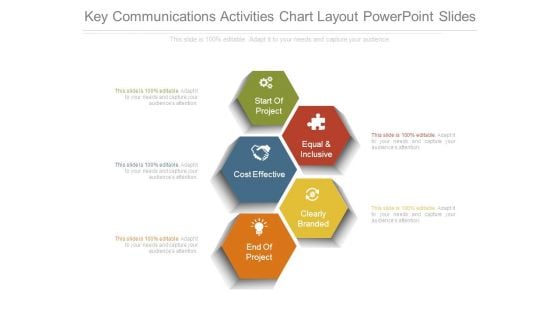
Key Communications Activities Chart Layout Powerpoint Slides
This is a key communications activities chart layout powerpoint slides. This is a five stage process. The stages in this process are start of project, cost effective, equal and inclusive, clearly branded, end of project.
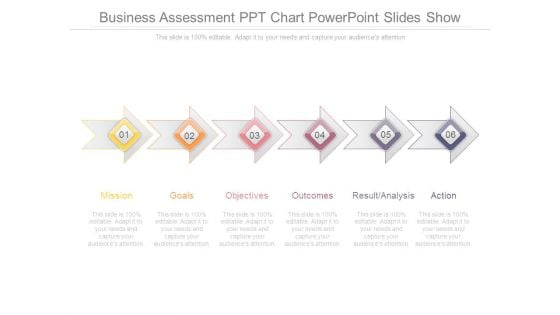
Business Assessment Ppt Chart Powerpoint Slides Show
This is a business assessment ppt chart powerpoint slides show. This is a six stage process. The stages in this process are mission, goals, objectives, outcomes, result analysis, action.
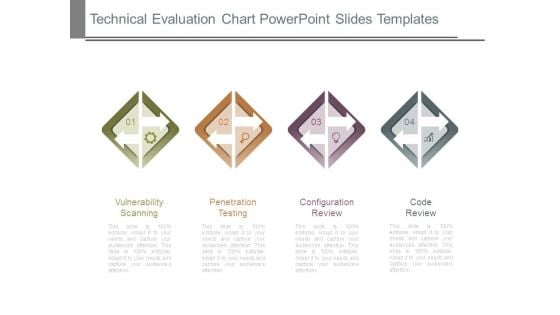
Technical Evaluation Chart Powerpoint Slides Templates
This is a technical evaluation chart powerpoint slides templates. This is a four stage process. The stages in this process are vulnerability scanning, penetration testing, configuration review, code review.
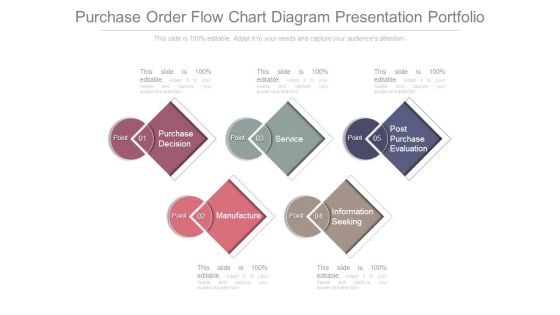
Purchase Order Flow Chart Diagram Presentation Portfolio
This is a purchase order flow chart diagram presentation portfolio. This is a five stage process. The stages in this process are purchase decision, service, post purchase evaluation, point, manufacture, information seeking.
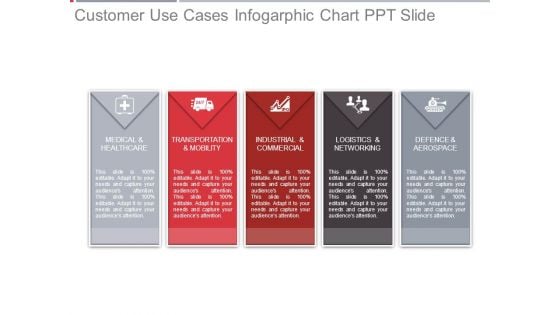
Customer Use Cases Infogarphic Chart Ppt Slide
This is a customer use cases infogarphic chart ppt slide. This is a five stage process. The stages in this process are medical and healthcare, transportation and mobility, industrial and commercial, logistics and networking, defence and aerospace.

Project Issues Infogarphic Chart Ppt Examples Slides
This is a project issues infogarphic chart ppt examples slides. This is a seven stage process. The stages in this process are issue description, reported on, reported by, owner, severity, priority, status.
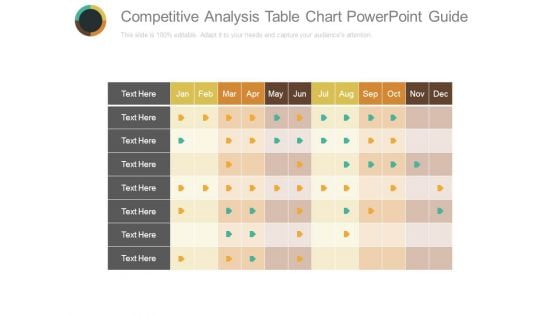
Competitive Analysis Table Chart Powerpoint Guide
This is a competitive analysis table chart powerpoint guide. This is a twelve stage process. The stages in this process are jan,feb, mar, apr, may, jun, jul, aug, sep, oct, nov, dec.
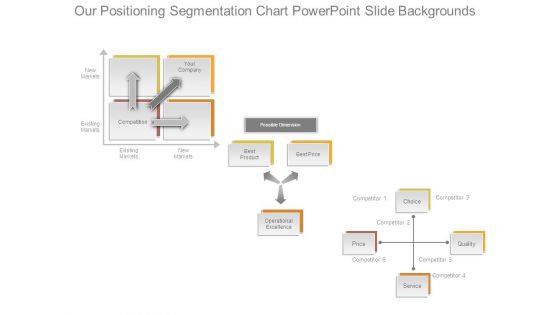
Our Positioning Segmentation Chart Powerpoint Slide Backgrounds
This is a our positioning segmentation chart powerpoint slide backgrounds. This is a three stage process. The stages in this process are new markets, existing markets, your company, competition, possible dimension, best product, operational excellence, service, price, choice.
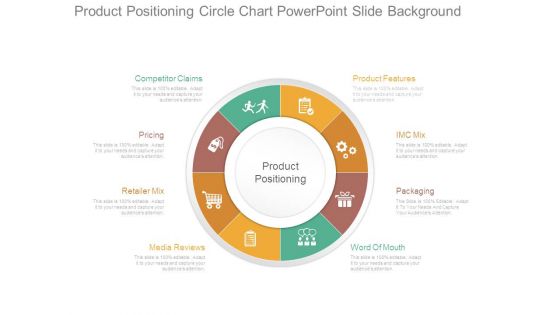
Product Positioning Circle Chart Powerpoint Slide Background
This is a product positioning circle chart powerpoint slide background. This is a eight stage process. The stages in this process are competitor claims, pricing, retailer mix, media reviews, product positioning, product features, imc mix, packaging, word of mouth.
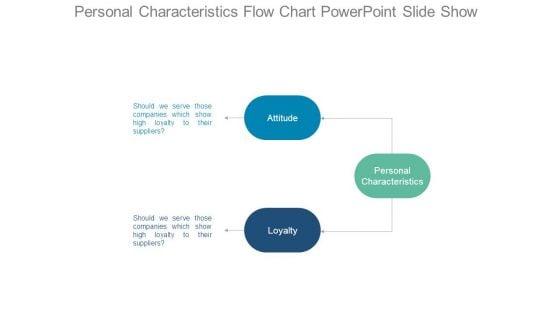
Personal Characteristics Flow Chart Powerpoint Slide Show
This is a personal characteristics flow chart powerpoint slide show. This is a three stage process. The stages in this process are should we serve those companies which show high loyalty to their suppliers, attitude, loyalty, personal characteristics.
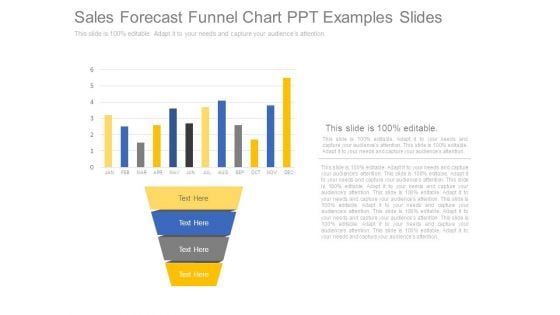
Sales Forecast Funnel Chart Ppt Examples Slides
This is a sales forecast funnel chart ppt examples slides. This is a four stage process. The stages in this process are jan, feb, mar, apr, may, jun, jul, aug, sep, oct, nov, dec.
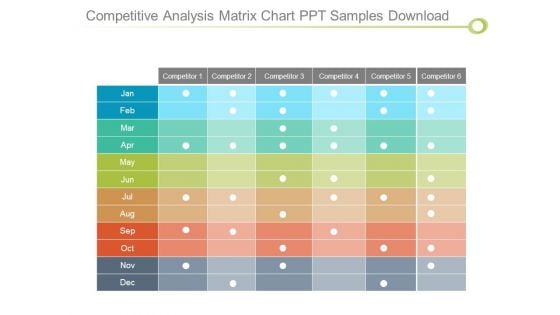
Competitive Analysis Matrix Chart Ppt Samples Download
This is a competitive analysis matrix chart ppt samples download. This is a six stage process. The stages in this process are competitor, jan, feb, mar, apr, may, jun, jul, aug, sep, oct, nov, dec.
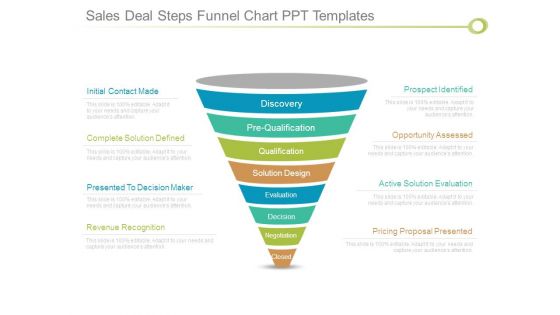
Sales Deal Steps Funnel Chart Ppt Templates
This is a sales deal steps funnel chart ppt templates. This is a eight stage process. The stages in this process are discovery, pre qualification, qualification, solution design, evaluation, decision, negotiation, closed.
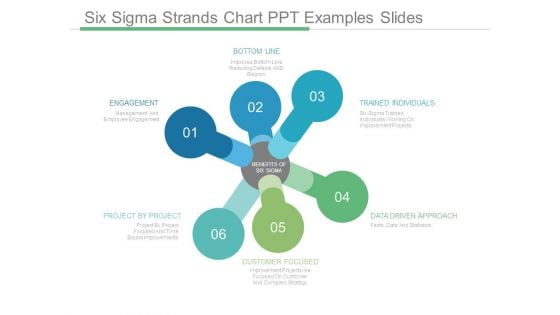
Six Sigma Strands Chart Ppt Examples Slides
This is a six sigma strands chart ppt examples slides. This is a six stage process. The stages in this process are bottom line, trained individuals, data driven approach, customer focused, project by project, engagement, benefits of six sigma.
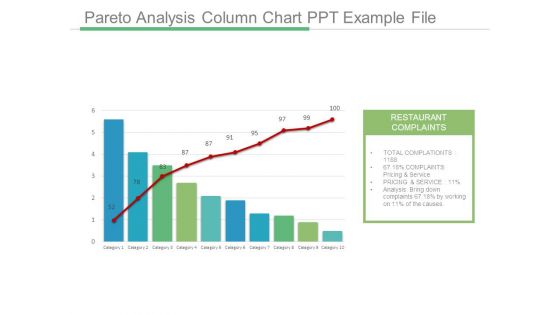
Pareto Analysis Column Chart Ppt Example File
This is a pareto analysis column chart ppt example file. This is a ten stage process. The stages in this process are restaurant complaints, total complaints, complaints pricing and service, pricing and service, analysis bring down complaints, category.

Six Sigma Circle Chart Powerpoint Slide Information
This is a six sigma circle chart powerpoint slide information. This is a five stage process. The stages in this process are bottom line, trained individuals, engagement, project by project, customer focused.
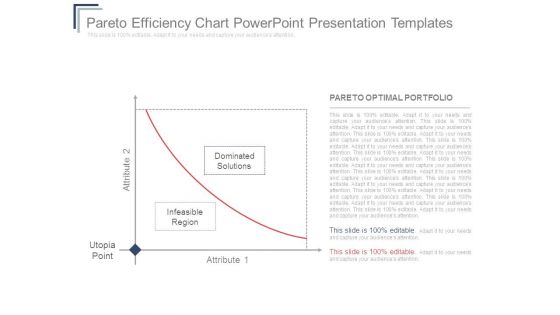
Pareto Efficiency Chart Powerpoint Presentation Templates
This is a pareto efficiency chart powerpoint presentation templates. This is a two stage process. The stages in this process are attribute 2, utopia, point, infeasible region, dominated, solutions, attribute 1, pareto optimal portfolio.
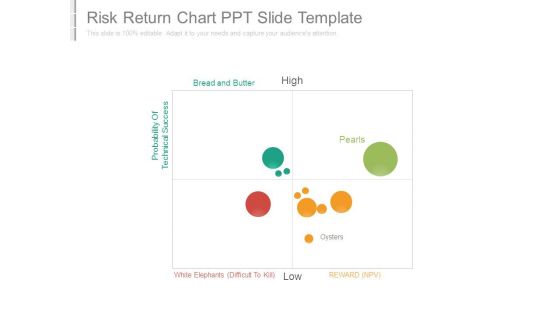
Risk Return Chart Ppt Slide Template
This is a risk return chart ppt slide template. This is a four stage process. The stages in this process are probability of technical success, bread and butter, pearls, oysters.
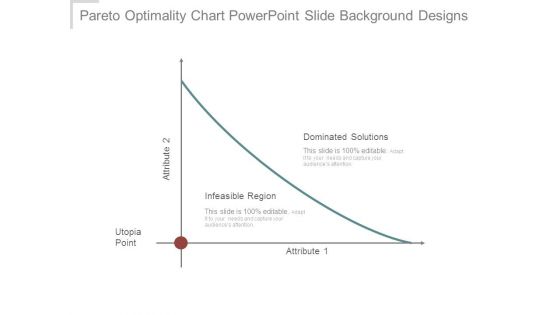
Pareto Optimality Chart Powerpoint Slide Background Designs
This is a pareto optimality chart powerpoint slide background designs. This is a one stage process. The stages in this process are dominated solutions, infeasible region, utopia point, attribute.
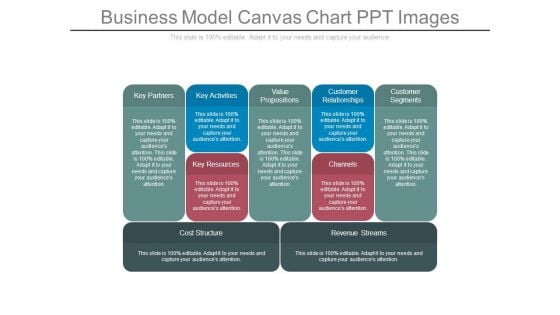
Business Model Canvas Chart Ppt Images
This is a business model canvas chart ppt images. This is a five stage process. The stages in this process are key partners, key activities, value propositions, customer relationships, customer segments, key resources, channels, cost structure, revenue streams.
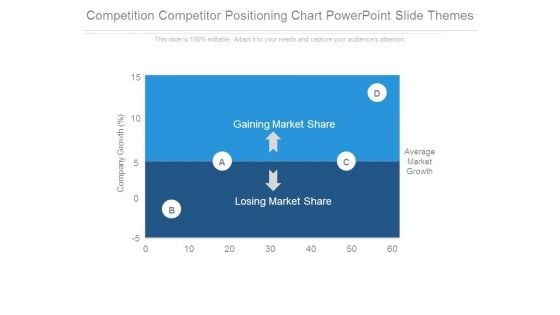
Competition Competitor Positioning Chart Powerpoint Slide Themes
This is a competition competitor positioning chart powerpoint slide themes. This is a four stage process. The stages in this process are gaining market share, losing market share, average market growth, company growth.
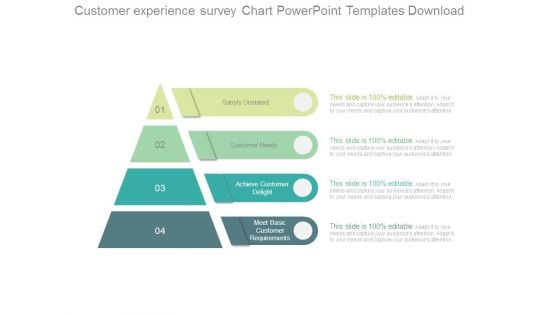
Customer Experience Survey Chart Powerpoint Templates Download
This is a customer experience survey chart powerpoint templates download. This is a four stage process. The stages in this process are satisfy unstated, customer needs, achieve customer delight, meet basic, customer requirements.
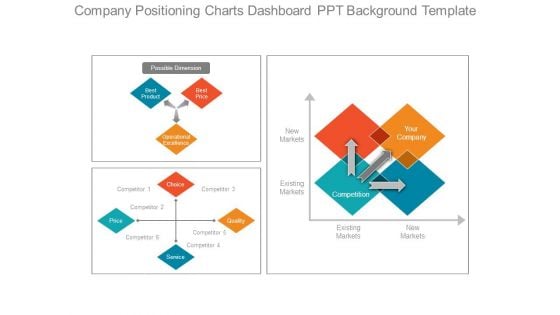
Company Positioning Charts Dashboard Ppt Background Template
This is a company positioning charts dashboard ppt background template. This is a four stage process. The stages in this process are possible dimension, best product, best price, operational excellence, choice, service, quality, competition, your company.
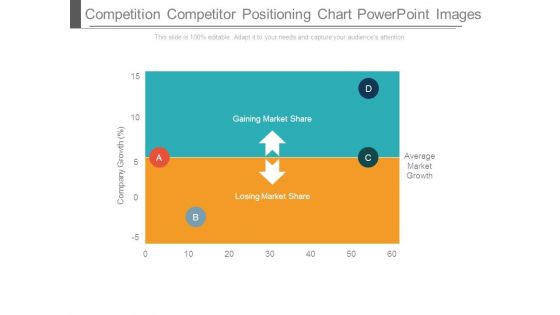
Competition Competitor Positioning Chart Powerpoint Images
This is a competition competitor positioning chart powerpoint images. This is a four stage process. The stages in this process are gaining market share, losing market share, average market growth, company growth.
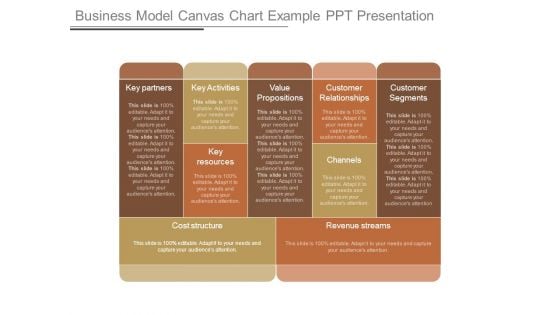
Business Model Canvas Chart Example Ppt Presentation
This is a business model canvas chart example ppt presentation. This is a five stage process. The stages in this process are key partners, key activities, value propositions, customer relationships, customer segments, key resources, channels, cost structure, revenue streams.
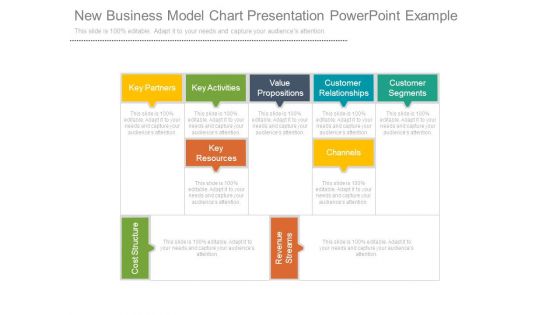
New Business Model Chart Presentation Powerpoint Example
This is a new business model chart presentation powerpoint example. This is a five stage process. The stages in this process are key partners, key activities, value propositions, customer, relationships, customer segments, key resources, channels, cost structure, revenue streams.
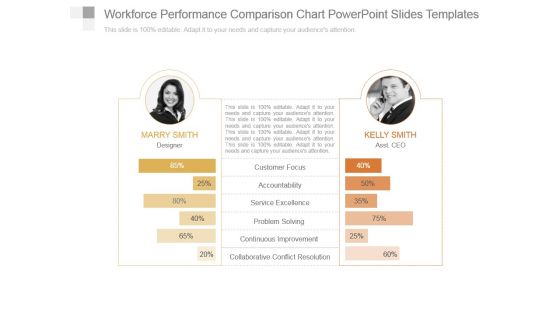
Workforce Performance Comparison Chart Powerpoint Slides Templates
This is a workforce performance comparison chart powerpoint slides templates. This is a two stage process. The stages in this process are customer focus, accountability, service excellence, problem solving, continuous improvement, collaborative conflict resolution.
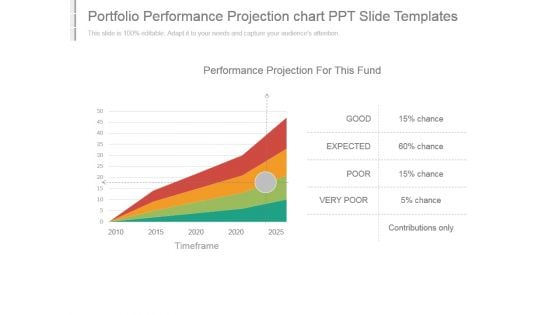
Portfolio Performance Projection Chart Ppt Slide Templates
This is a portfolio performance projection chart ppt slide templates. This is a four stage process. The stages in this process are performance projection for this fund, good, expected, poor, very poor, contributions only, timeframe.
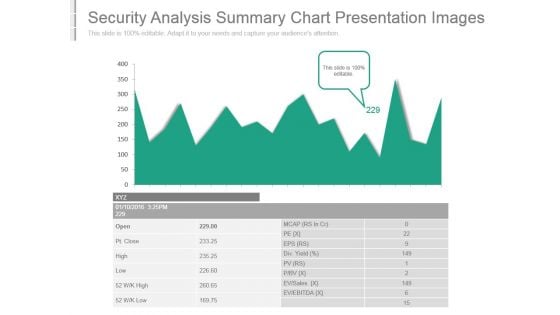
Security Analysis Summary Chart Presentation Images
This is a security analysis summary chart presentation images. This is a one stage process. The stages in this process are ev ebitda, ev sales, div yield, open, pt close, high, low, mcap, eps.
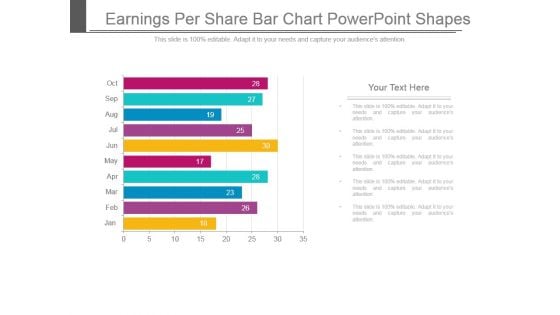
Earnings Per Share Bar Chart Powerpoint Shapes
This is a earnings per share bar chart powerpoint shapes. This is a ten stage process. The stages in this process are jan, feb, mar, apr, may, jun, jul, aug, sep, oct.
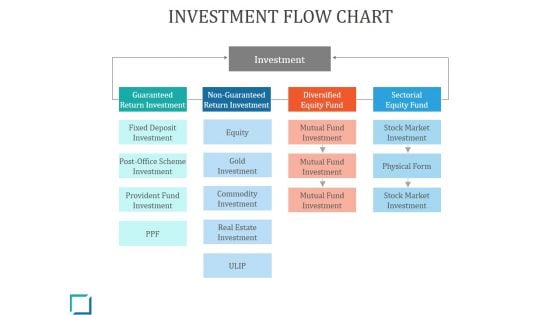
Investment Flow Chart Ppt PowerPoint Presentation Themes
This is a investment flow chart ppt powerpoint presentation themes. This is a five stage process. The stages in this process are investment, equity, gold investment, physical form, provident fund investment.
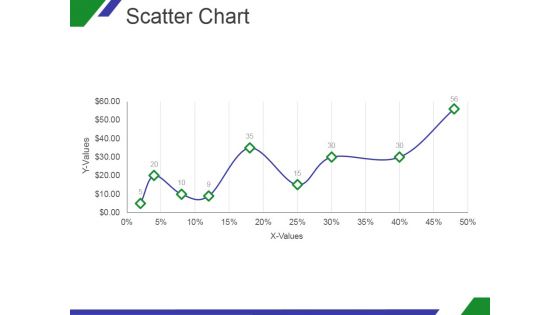
Scatter Chart Ppt PowerPoint Presentation Designs Download
This is a scatter chart ppt powerpoint presentation designs download. This is a nine stage process. The stages in this process are x values, y values, graph, growth, success.

Scatter Chart Ppt PowerPoint Presentation Model Template
This is a scatter chart ppt powerpoint presentation model template. This is a nine stage process. The stages in this process are x values, y values, graph, growth, success.
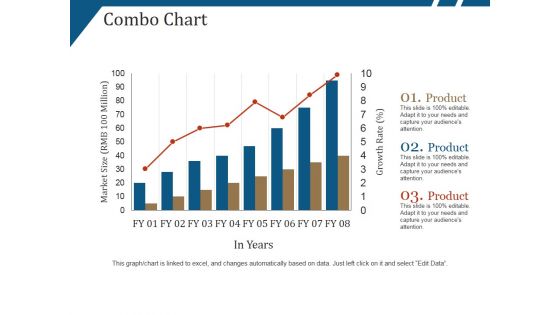
Combo Chart Ppt PowerPoint Presentation Summary Ideas
This is a combo chart ppt powerpoint presentation summary ideas. This is a eight stage process. The stages in this process are market size, growth rate, product, in years.
Scatter Chart Ppt PowerPoint Presentation Icon Elements
This is a scatter chart ppt powerpoint presentation icon elements. This is a nine stage process. The stages in this process are dollar in billions, sales in percentage, business, success.
Bar Chart Ppt PowerPoint Presentation Portfolio Icons
This is a bar chart ppt powerpoint presentation portfolio icons. This is a seven stage process. The stages in this process are in years, in percentage, finance, business marketing.
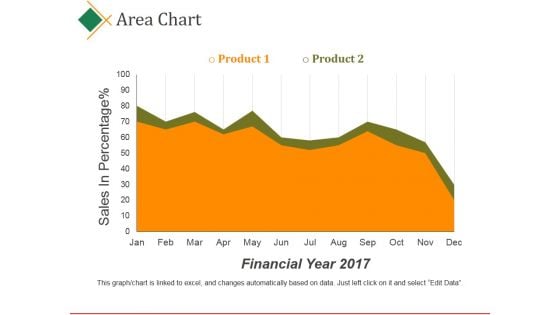
Area Chart Ppt PowerPoint Presentation Pictures Files
This is a area chart ppt powerpoint presentation pictures files. This is a two stage process. The stages in this process are product, sales, in percentage, financial year, business.
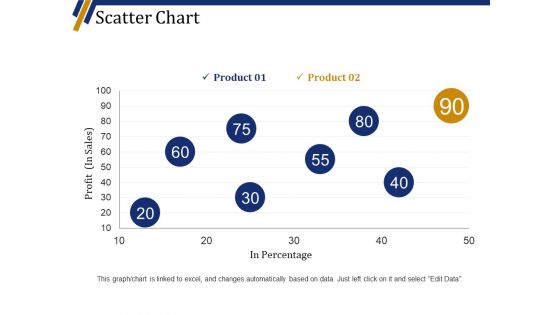
Scatter Chart Ppt PowerPoint Presentation Summary Visuals
This is a scatter chart ppt powerpoint presentation summary visuals. This is a eight stage process. The stages in this process are product, profit in sales, in percentage, finance, business.
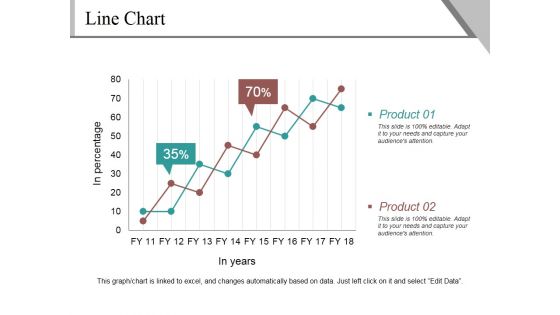
Line Chart Ppt PowerPoint Presentation Infographics Example
This is a line chart ppt powerpoint presentation infographics example. This is a two stage process. The stages in this process are product, in percentage, in years, finance, growth.


 Continue with Email

 Home
Home


