Progress Dashboard

Instagram Influencer Marketing Campaign Dashboard Ppt Infographic Template Topics PDF
This slide represents key metrics dashboard to track and measure progress of Instagram influencer marketing campaign. It includes details related to KPIs such as impressions, likes, engagement rates etc. Explore a selection of the finest Instagram Influencer Marketing Campaign Dashboard Ppt Infographic Template Topics PDF here. With a plethora of professionally designed and pre made slide templates, you can quickly and easily find the right one for your upcoming presentation. You can use our Instagram Influencer Marketing Campaign Dashboard Ppt Infographic Template Topics PDF to effectively convey your message to a wider audience. Slidegeeks has done a lot of research before preparing these presentation templates. The content can be personalized and the slides are highly editable. Grab templates today from Slidegeeks.
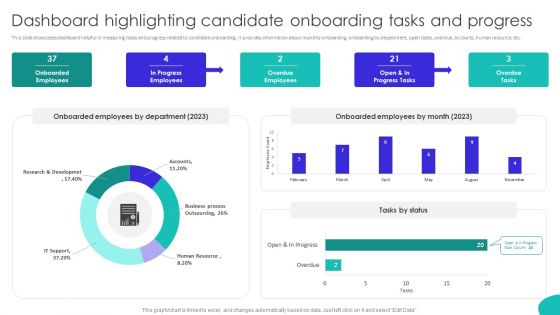
Improving Technology Based Dashboard Highlighting Candidate Onboarding Tasks Information PDF
This slide showcases dashboard helpful in measuring tasks and progress related to candidate onboarding. It provides information about monthly onboarding, onboarding by department, open tasks, overdue, accounts, human resource, etc. Slidegeeks is here to make your presentations a breeze with Improving Technology Based Dashboard Highlighting Candidate Onboarding Tasks Information PDF With our easy-to-use and customizable templates, you can focus on delivering your ideas rather than worrying about formatting. With a variety of designs to choose from, youre sure to find one that suits your needs. And with animations and unique photos, illustrations, and fonts, you can make your presentation pop. So whether youre giving a sales pitch or presenting to the board, make sure to check out Slidegeeks first.
Dashboard For Tracking Direct Mail Advertising Campaign Performance Inspiration PDF
This slide represents dashboard showcasing direct mail marketing campaign performance progress. It provides information regarding click through rate, campaign performance, web conversions, total revenue etc. Showcasing this set of slides titled Dashboard For Tracking Direct Mail Advertising Campaign Performance Inspiration PDF. The topics addressed in these templates are Product Delivery Rate, Deliverables, App Uninstalls. All the content presented in this PPT design is completely editable. Download it and make adjustments in color, background, font etc. as per your unique business setting.
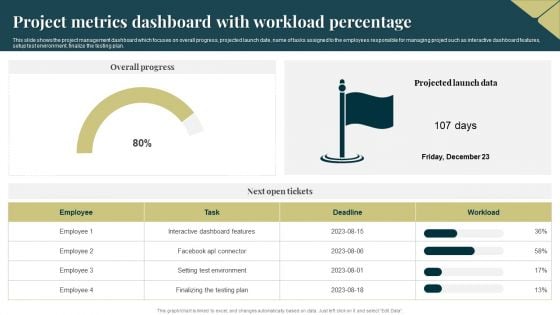
Project Metrics Dashboard With Workload Percentage Ideas PDF
This slide shows the project management dashboard which focuses on overall progress, projected launch date, name of tasks assigned to the employees responsible for managing project such as interactive dashboard features, setup test environment, finalize the testing plan. Showcasing this set of slides titled Project Metrics Dashboard With Workload Percentage Ideas PDF. The topics addressed in these templates are Environment, Plan, Dashboard. All the content presented in this PPT design is completely editable. Download it and make adjustments in color, background, font etc. as per your unique business setting.

Infrastructure Expansion KPI Dashboard For Investment Project Management Inspiration PDF
This slide covers management dashboard for analyzing the project performance and progress. It include KPIs such as total claims to date, total costs to date, project status, profits, number of days left, etc. Showcasing this set of slides titled Infrastructure Expansion KPI Dashboard For Investment Project Management Inspiration PDF. The topics addressed in these templates are Claims And Costs, Project Status, Profits. All the content presented in this PPT design is completely editable. Download it and make adjustments in color, background, font etc. as per your unique business setting.
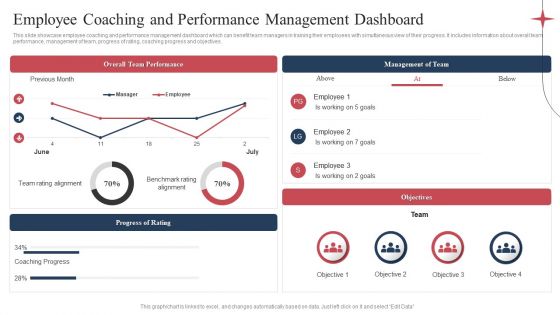
Employee Coaching And Performance Management Dashboard Microsoft PDF
This slide showcase employee coaching and performance management dashboard which can benefit team managers in training their employees with simultaneous view of their progress. It includes information about overall team performance, management of team, progress of rating, coaching progress and objectives. Showcasing this set of slides titled Employee Coaching And Performance Management Dashboard Microsoft PDF. The topics addressed in these templates are Overall Team Performance, Management Of Team, Objectives, Progress Of Rating. All the content presented in this PPT design is completely editable. Download it and make adjustments in color, background, font etc. as per your unique business setting.
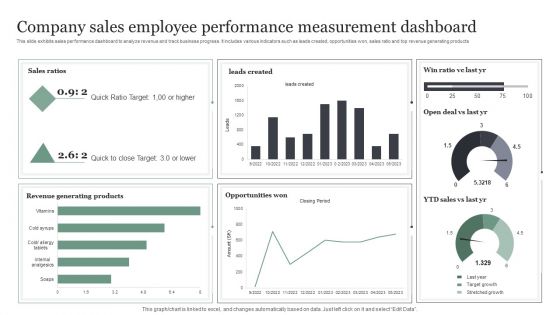
Company Sales Employee Performance Measurement Dashboard Information PDF
This slide exhibits sales performance dashboard to analyze revenue and track business progress. It includes various indicators such as leads created, opportunities won, sales ratio and top revenue generating products. Showcasing this set of slides titled Company Sales Employee Performance Measurement Dashboard Information PDF. The topics addressed in these templates are Quick Ratio Target, Opportunities Won, Revenue Generating Products. All the content presented in this PPT design is completely editable. Download it and make adjustments in color, background, font etc. as per your unique business setting.
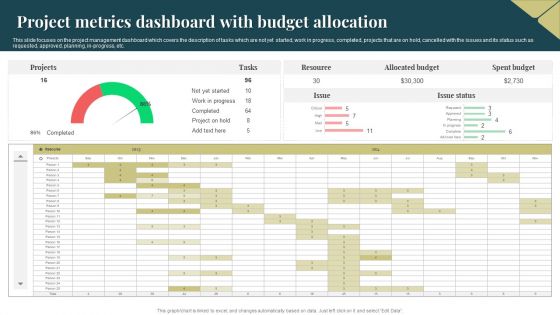
Project Metrics Dashboard With Budget Allocation Portrait PDF
This slide focuses on the project management dashboard which covers the description of tasks which are not yet started, work in progress, completed, projects that are on hold, cancelled with the issues and its status such as requested, approved, planning, in progress, etc. Showcasing this set of slides titled Project Metrics Dashboard With Budget Allocation Portrait PDF. The topics addressed in these templates are Projects, Resource, Allocated Budget. All the content presented in this PPT design is completely editable. Download it and make adjustments in color, background, font etc. as per your unique business setting.
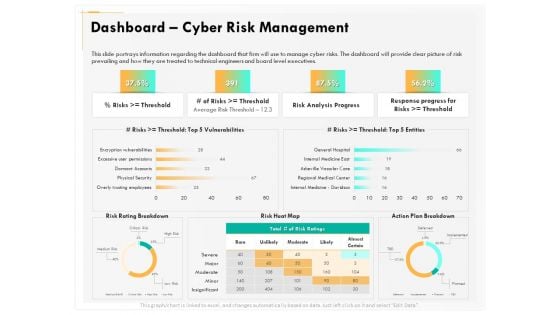
Computer Security Incident Handling Dashboard Cyber Risk Management Download PDF
Presenting this set of slides with name computer security incident handling dashboard cyber risk management download pdf. The topics discussed in these slides are risk rating breakdown, risk heat map, action plan breakdown, risk analysis progress, response progress for risks. This is a completely editable PowerPoint presentation and is available for immediate download. Download now and impress your audience.
KPI Dashboard For Tracking Project Summary Ppt Status Themes PDF
This slide brings forth dashboard which assists project managers in tracking the status of projects . The key performance indicators are project title, tag, responsibility, date assigned, project team, progress, deadline and status. Persuade your audience using this KPI Dashboard For Tracking Project Summary Ppt Status Themes PDF. This PPT design covers one stages, thus making it a great tool to use. It also caters to a variety of topics including Project Title, Responsibility, Date Assigned. Download this PPT design now to present a convincing pitch that not only emphasizes the topic but also showcases your presentation skills.
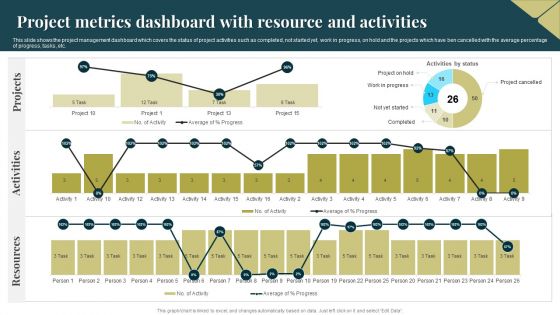
Project Metrics Dashboard With Resource And Activities Infographics PDF
This slide shows the project management dashboard which covers the status of project activities such as completed, not started yet, work in progress, on hold and the projects which have ben cancelled with the average percentage of progress, tasks, etc. Showcasing this set of slides titled Project Metrics Dashboard With Resource And Activities Infographics PDF. The topics addressed in these templates are Activities, Projects, Resources. All the content presented in this PPT design is completely editable. Download it and make adjustments in color, background, font etc. as per your unique business setting.
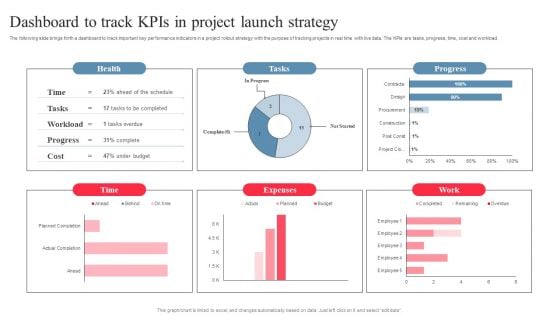
Dashboard To Track Kpis In Project Launch Strategy Pictures PDF
The following slide brings forth a dashboard to track important key performance indicators in a project rollout strategy with the purpose of tracking projects in real time with live data. The KPIs are tasks, progress, time, cost and workload. Showcasing this set of slides titled Dashboard To Track Kpis In Project Launch Strategy Pictures PDF. The topics addressed in these templates are Expenses, Project Launch Strategy, Dashboard To Track Kpis. All the content presented in this PPT design is completely editable. Download it and make adjustments in color, background, font etc. as per your unique business setting.
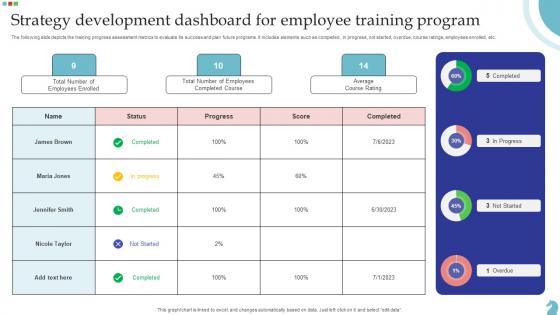
Strategy Development Dashboard For Employee Training Program Designs Pdf
The following slide depicts the training progress assessment metrics to evaluate its success and plan future programs. It includes elements such as completed, in progress, not started, overdue, course ratings, employees enrolled, etc. Showcasing this set of slides titled Strategy Development Dashboard For Employee Training Program Designs Pdf. The topics addressed in these templates are Strategy Development Dashboard, Employee Training Program, Average Course Rating. All the content presented in this PPT design is completely editable. Download it and make adjustments in color, background, font etc. as per your unique business setting. The following slide depicts the training progress assessment metrics to evaluate its success and plan future programs. It includes elements such as completed, in progress, not started, overdue, course ratings, employees enrolled, etc.

Learning And Improvement KPI Activities For Workforce Dashboard Formats Pdf
This slide provides glimpse about statistics related to progress status of training activities for employees. It includes activities, current courses status, etc. Pitch your topic with ease and precision using this Learning And Improvement KPI Activities For Workforce Dashboard Formats Pdf. This layout presents information on Learning And Improvement KPI, Workforce Dashboard, Current Courses Status. It is also available for immediate download and adjustment. So, changes can be made in the color, design, graphics or any other component to create a unique layout. This slide provides glimpse about statistics related to progress status of training activities for employees. It includes activities, current courses status, etc.
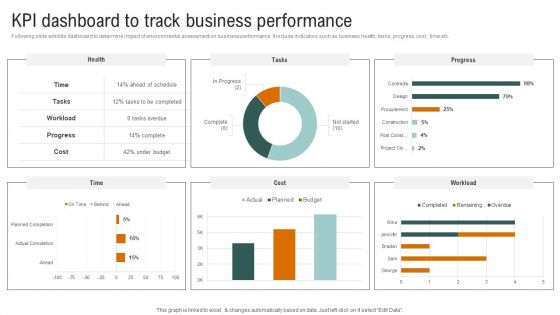
Kpi Dashboard To Track Business Performance Portrait PDF
Following slide exhibits dashboard to determine impact of environmental assessment on business performance. It include indicators such as business health, tasks, progress, cost , time etc. Do you know about Slidesgeeks Kpi Dashboard To Track Business Performance Portrait PDF These are perfect for delivering any kind od presentation. Using it, create PowerPoint presentations that communicate your ideas and engage audiences. Save time and effort by using our pre-designed presentation templates that are perfect for a wide range of topic. Our vast selection of designs covers a range of styles, from creative to business, and are all highly customizable and easy to edit. Download as a PowerPoint template or use them as Google Slides themes.
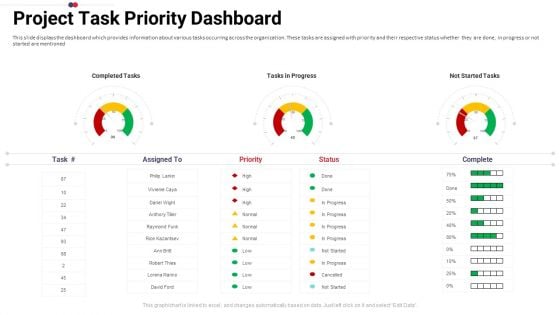
Work Prioritization Procedure Project Task Priority Dashboard Elements PDF
This slide displays the dashboard which provides information about various tasks occurring across the organization. These tasks are assigned with priority and their respective status whether they are done, in progress or not started are mentioned. Deliver an awe inspiring pitch with this creative work prioritization procedure project task priority dashboard elements pdf bundle. Topics like completed tasks, tasks in progress, not started tasks can be discussed with this completely editable template. It is available for immediate download depending on the needs and requirements of the user.
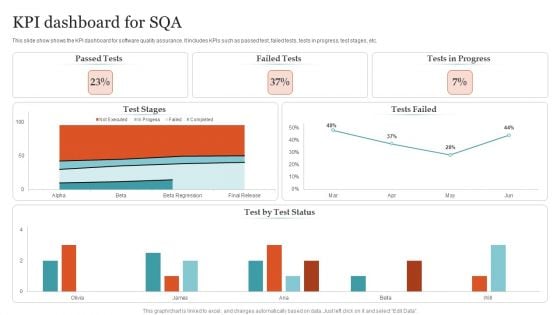
KPI Dashboard For SQA Ppt PowerPoint Presentation Gallery Structure PDF
This slide show shows the KPI dashboard for software quality assurance. It includes KPIs such as passed test, failed tests, tests in progress, test stages, etc. Pitch your topic with ease and precision using this KPI Dashboard For SQA Ppt PowerPoint Presentation Gallery Structure PDF. This layout presents information on Passed Tests, Failed Tests, Tests Progress . It is also available for immediate download and adjustment. So, changes can be made in the color, design, graphics or any other component to create a unique layout.
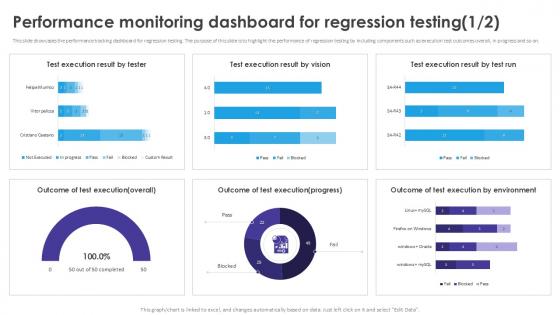
Performance Monitoring Dashboard Automated Regression Testing And Achieving PPT Example
This slide showcases the performance tracking dashboard for regression testing. The purpose of this slide is to highlight the performance of regression testing by including components such as execution test outcomes overall, in progress and so on. If your project calls for a presentation, then Slidegeeks is your go-to partner because we have professionally designed, easy-to-edit templates that are perfect for any presentation. After downloading, you can easily edit Performance Monitoring Dashboard Automated Regression Testing And Achieving PPT Example and make the changes accordingly. You can rearrange slides or fill them with different images. Check out all the handy templates This slide showcases the performance tracking dashboard for regression testing. The purpose of this slide is to highlight the performance of regression testing by including components such as execution test outcomes overall, in progress and so on.
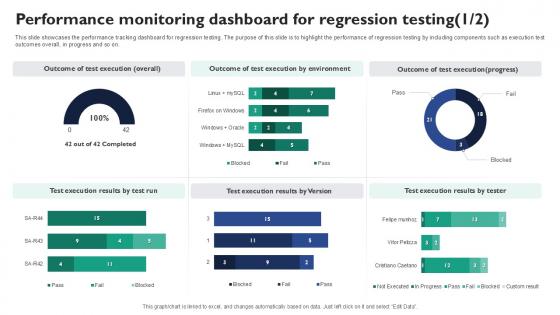
Performance Monitoring Dashboard For Corrective Regression Testing Ppt Example
This slide showcases the performance tracking dashboard for regression testing. The purpose of this slide is to highlight the performance of regression testing by including components such as execution test outcomes overall, in progress and so on. Want to ace your presentation in front of a live audience Our Performance Monitoring Dashboard For Corrective Regression Testing Ppt Example can help you do that by engaging all the users towards you. Slidegeeks experts have put their efforts and expertise into creating these impeccable powerpoint presentations so that you can communicate your ideas clearly. Moreover, all the templates are customizable, and easy-to-edit and downloadable. Use these for both personal and commercial use. This slide showcases the performance tracking dashboard for regression testing. The purpose of this slide is to highlight the performance of regression testing by including components such as execution test outcomes overall, in progress and so on.
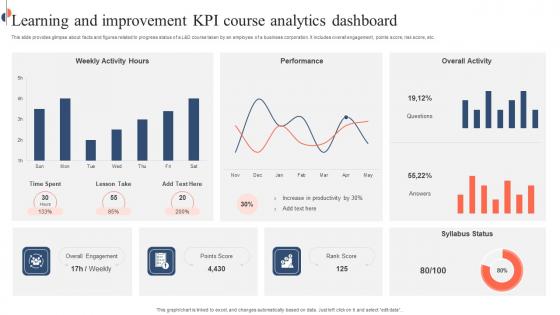
Learning And Improvement KPI Course Analytics Dashboard Inspiration Pdf
This slide provides glimpse about facts and figures related to progress status of a L and D course taken by an employee of a business corporation. It includes overall engagement, points score, risk score, etc. Showcasing this set of slides titled Learning And Improvement KPI Course Analytics Dashboard Inspiration Pdf. The topics addressed in these templates are Learning And Improvement KPI, Course Analytics Dashboard, Risk Score. All the content presented in this PPT design is completely editable. Download it and make adjustments in color, background, font etc. as per your unique business setting. This slide provides glimpse about facts and figures related to progress status of a L and D course taken by an employee of a business corporation. It includes overall engagement, points score, risk score, etc.
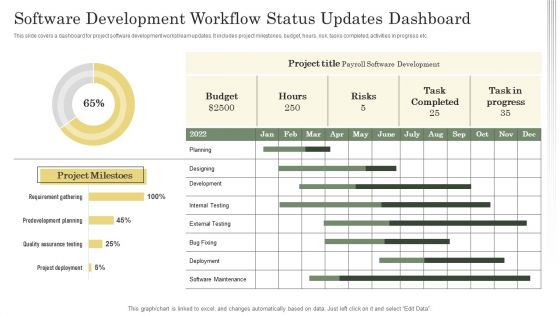
Software Development Workflow Status Updates Dashboard Ppt Gallery Slides PDF
This slide covers a dashboard for project software development workstream updates. It includes project milestones, budget, hours, risk, tasks completed, activities in progress etc. Showcasing this set of slides titled Software Development Workflow Status Updates Dashboard Ppt Gallery Slides PDF. The topics addressed in these templates are Project Milestones, Project Title, Planning. All the content presented in this PPT design is completely editable. Download it and make adjustments in color, background, font etc. as per your unique business setting.
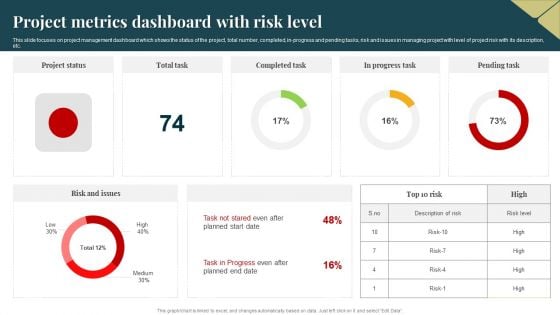
Project Metrics Dashboard With Risk Level Guidelines PDF
This slide focuses on project management dashboard which shows the status of the project, total number, completed, in progress and pending tasks, risk and issues in managing project with level of project risk with its description, etc. Pitch your topic with ease and precision using this Project Metrics Dashboard With Risk Level Guidelines PDF. This layout presents information on Project Metrics Dashboard, Risk Level. It is also available for immediate download and adjustment. So, changes can be made in the color, design, graphics or any other component to create a unique layout.
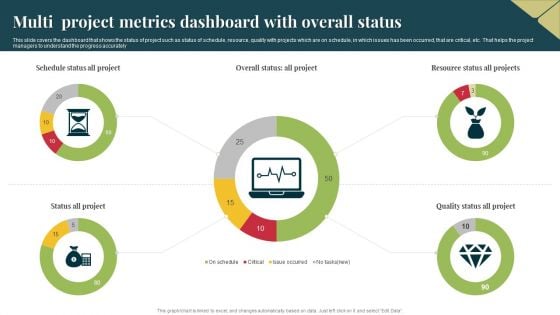
Multi Project Metrics Dashboard With Overall Status Pictures PDF
This slide covers the dashboard that shows the status of project such as status of schedule, resource, quality with projects which are on schedule, in which issues has been occurred, that are critical, etc. That helps the project managers to understand the progress accurately. Pitch your topic with ease and precision using this Multi Project Metrics Dashboard With Overall Status Pictures PDF. This layout presents information on Multi Project, Metrics Dashboard. It is also available for immediate download and adjustment. So, changes can be made in the color, design, graphics or any other component to create a unique layout.
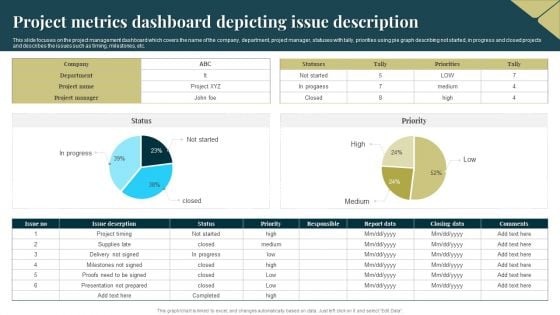
Project Metrics Dashboard Depicting Issue Description Rules PDF
This slide focuses on the project management dashboard which covers the name of the company, department, project manager, statuses with tally, priorities using pie graph describing not started, in progress and closed projects and describes the issues such as timing, milestones, etc. Showcasing this set of slides titled Project Metrics Dashboard Depicting Issue Description Rules PDF. The topics addressed in these templates are Project Metrics, Dashboard Depicting. All the content presented in this PPT design is completely editable. Download it and make adjustments in color, background, font etc. as per your unique business setting.
Project Metrics Dashboard With Task Summary Icons PDF
This slide shows the project management dashboard which covers the summary of different projects with time, cost, workload, tasks and progress with workload, created verses completed tasks, time spent on managing projects, etc. Showcasing this set of slides titled Project Metrics Dashboard With Task Summary Icons PDF. The topics addressed in these templates are Project Metrics Dashboard, Task Summary. All the content presented in this PPT design is completely editable. Download it and make adjustments in color, background, font etc. as per your unique business setting.
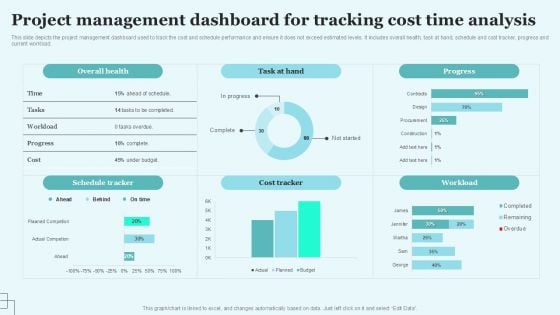
Project Management Dashboard For Tracking Cost Time Analysis Background PDF
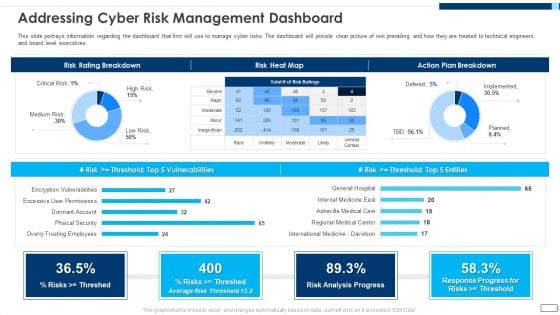
Evolving BI Infrastructure Addressing Cyber Risk Management Dashboard Background PDF
This slide portrays information regarding the dashboard that firm will use to manage cyber risks. The dashboard will provide clear picture of risk prevailing and how they are treated to technical engineers and board level executives. Deliver an awe inspiring pitch with this creative evolving bi infrastructure addressing cyber risk management dashboard background pdf bundle. Topics like risk rating breakdown, risk heat map, action plan breakdown, risk analysis progress can be discussed with this completely editable template. It is available for immediate download depending on the needs and requirements of the user.
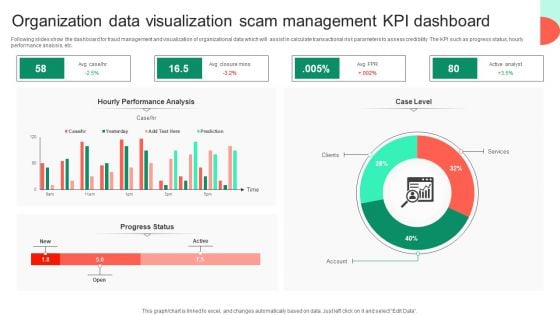
Organization Data Visualization Scam Management KPI Dashboard Rules PDF
Following slides show the dashboard for fraud management and visualization of organizational data which will assist in calculate transactional risk parameters to assess credibility. The KPI such as progress status, hourly performance analysis, etc. Showcasing this set of slides titled Organization Data Visualization Scam Management KPI Dashboard Rules PDF. The topics addressed in these templates are Hourly Performance Analysis, Services, Organization Data Visualization. All the content presented in this PPT design is completely editable. Download it and make adjustments in color, background, font etc. as per your unique business setting.
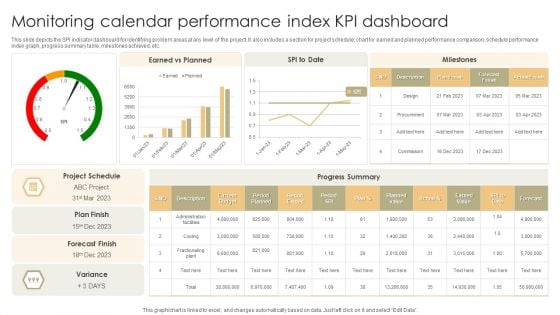
Monitoring Calendar Performance Index KPI Dashboard Slides PDF
This slide depicts the SPI indicator dashboard for identifying problem areas at any level of the project. It also includes a section for project schedule, chart for earned and planned performance comparison, schedule performance index graph, progress summary table, milestones achieved, etc. Pitch your topic with ease and precision using this Monitoring Calendar Performance Index KPI Dashboard Slides PDF. This layout presents information on Current Budget, Planned Value, Earned Value. It is also available for immediate download and adjustment. So, changes can be made in the color, design, graphics or any other component to create a unique layout.
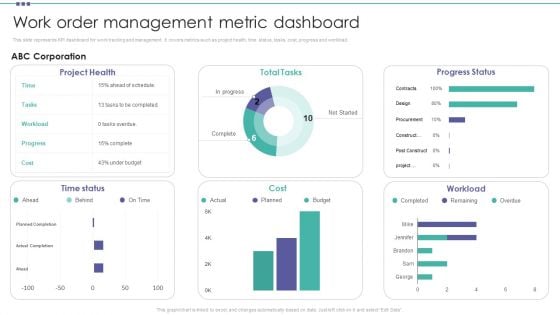
Work Order Management Metric Dashboard Organization Physical Assets Template PDF
This slide represents KPI dashboard for work tracking and management. It covers metrics such as project health, time status, tasks, cost, progress and workload. Boost your pitch with our creative Work Order Management Metric Dashboard Organization Physical Assets Template PDF. Deliver an awe-inspiring pitch that will mesmerize everyone. Using these presentation templates you will surely catch everyones attention. You can browse the ppts collection on our website. We have researchers who are experts at creating the right content for the templates. So you do not have to invest time in any additional work. Just grab the template now and use them.
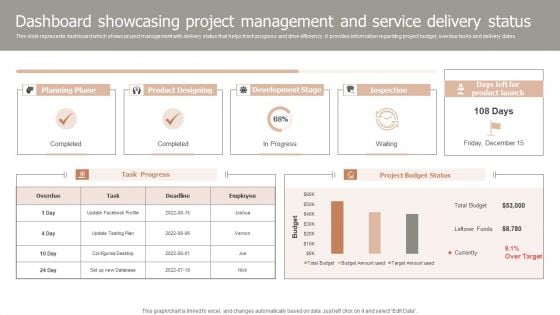
Dashboard Showcasing Project Management And Service Delivery Status Demonstration PDF
This slide represents dashboard which shows project management with delivery status that helps track progress and drive efficiency. It provides information regarding project budget, overdue tasks and delivery dates. Showcasing this set of slides titled Dashboard Showcasing Project Management And Service Delivery Status Demonstration PDF. The topics addressed in these templates are Planning Phase, Product Designing, Development Stage, Inspection. All the content presented in this PPT design is completely editable. Download it and make adjustments in color, background, font etc. as per your unique business setting.

Project Metrics Dashboard With Task Status Rules PDF
This slide shows the project management dashboard which shows the number of team members of managing project activities, estimated and actual time to complete the project task, hours taken by employees with achieved and open milestones and progress status. Pitch your topic with ease and precision using this Project Metrics Dashboard With Task Status Rules PDF. This layout presents information on Team Members, Employee. It is also available for immediate download and adjustment. So, changes can be made in the color, design, graphics or any other component to create a unique layout.
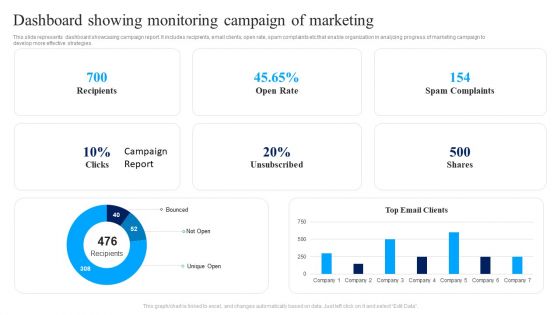
Dashboard Showing Monitoring Campaign Of Marketing Ppt Infographics PDF
This slide represents dashboard showcasing campaign report. It includes recipients, email clients, open rate, spam complaints etc that enable organization in analyzing progress of marketing campaign to develop more effective strategies. Showcasing this set of slides titled Dashboard Showing Monitoring Campaign Of Marketing Ppt Infographics PDF. The topics addressed in these templates are Recipients, Open Rate, Spam Complaints, Shares. All the content presented in this PPT design is completely editable. Download it and make adjustments in color, background, font etc. as per your unique business setting.
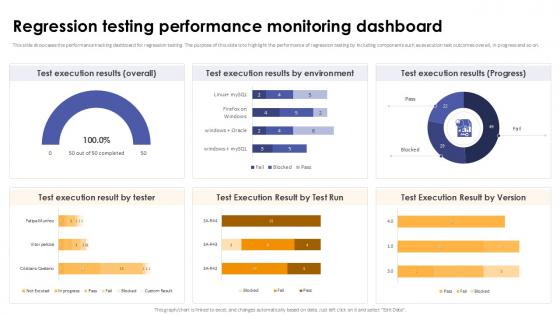
Regression Testing Performance Monitoring Dashboard Corrective Regression Testing Ppt Powerpoint
This slide showcases the performance tracking dashboard for regression testing. The purpose of this slide is to highlight the performance of regression testing by including components such as execution test outcomes overall, in progress and so on. Are you in need of a template that can accommodate all of your creative concepts This one is crafted professionally and can be altered to fit any style. Use it with Google Slides or PowerPoint. Include striking photographs, symbols, depictions, and other visuals. Fill, move around, or remove text boxes as desired. Test out color palettes and font mixtures. Edit and save your work, or work with colleagues. Download Regression Testing Performance Monitoring Dashboard Corrective Regression Testing Ppt Powerpoint and observe how to make your presentation outstanding. Give an impeccable presentation to your group and make your presentation unforgettable. This slide showcases the performance tracking dashboard for regression testing. The purpose of this slide is to highlight the performance of regression testing by including components such as execution test outcomes overall, in progress and so on.
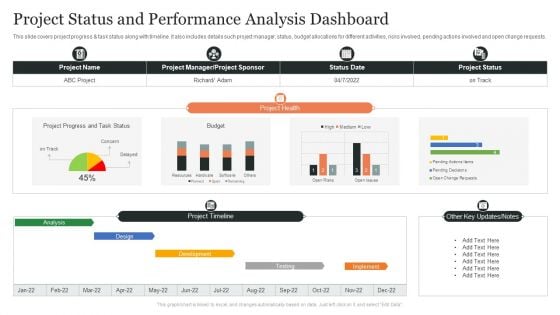
Project Status And Performance Analysis Dashboard Ppt Slides Brochure PDF
This slide covers project progress and task status along with timeline. It also includes details such project manager, status, budget allocations for different activities, risks involved, pending actions involved and open change requests. Showcasing this set of slides titled Project Status And Performance Analysis Dashboard Ppt Slides Brochure PDF. The topics addressed in these templates are Project Health, Design, Project Timeline, Other Key Updates, Notes. All the content presented in this PPT design is completely editable. Download it and make adjustments in color, background, font etc. as per your unique business setting.
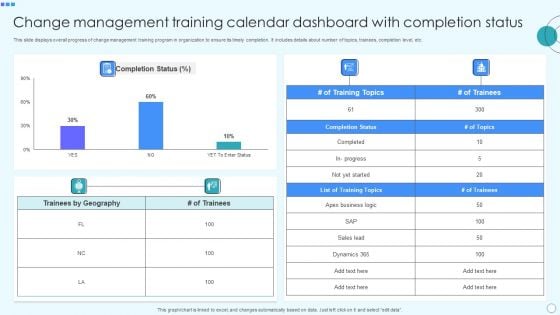
Change Management Training Calendar Dashboard With Completion Status Portrait PDF
This slide displays overall progress of change management training program in organization to ensure its timely completion. It includes details about number of topics, trainees, completion level, etc. Pitch your topic with ease and precision using this Change Management Training Calendar Dashboard With Completion Status Portrait PDF. This layout presents information on Business Logic, Geography, Completion Status, Sales Lead, Dynamics. It is also available for immediate download and adjustment. So, changes can be made in the color, design, graphics or any other component to create a unique layout.
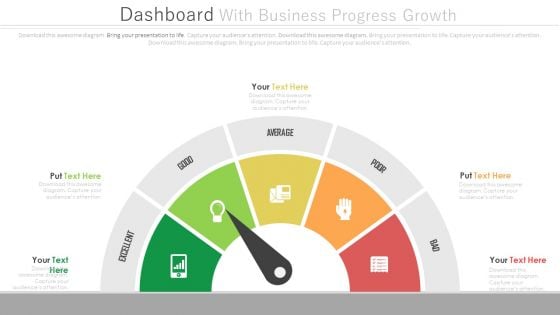
Dashboard To Simplify Business Data Analysis Powerpoint Slides
This PowerPoint template graphics of meter chart. Download this PPT chart to simplify business data analysis. This PowerPoint slide is of great help in the business sector to make realistic presentations and provides effective way of presenting your newer thoughts.
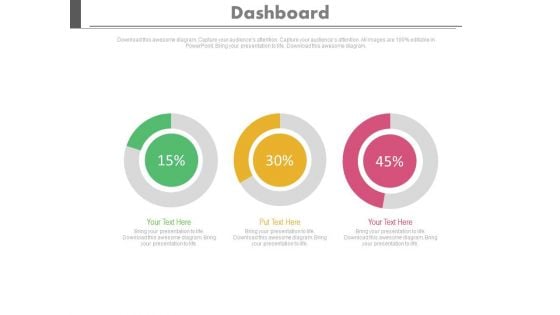
Three Dashboard With Percentage Value Growth Powerpoint Slides
This PowerPoint template has been designed with three dashboards. Use this PPT slide to depict rise in business profit. This professional diagram slide will help you express your views to target audience.
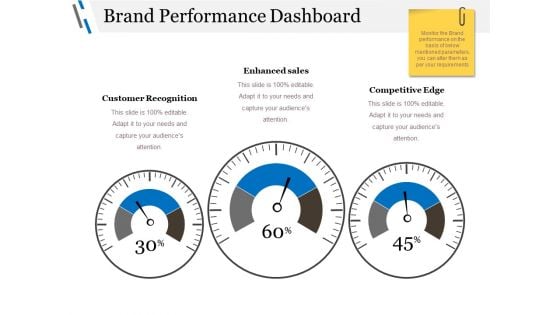
Brand Performance Dashboard Ppt PowerPoint Presentation Professional Grid
This is a brand performance dashboard ppt powerpoint presentation professional grid. This is a three stage process. The stages in this process are customer recognition, enhanced sales, competitive edge, dashboard, business.
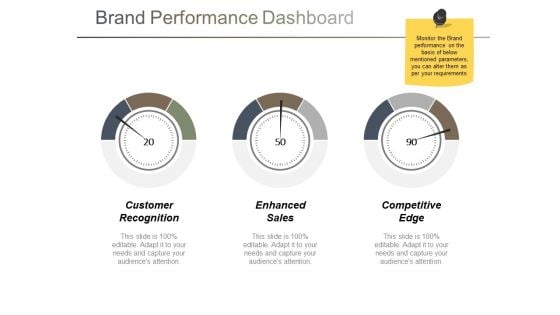
Brand Performance Dashboard Ppt PowerPoint Presentation Layouts Summary
This is a brand performance dashboard ppt powerpoint presentation layouts summary. This is a three stage process. The stages in this process are customer recognition, enhanced sales, competitive edge, dashboard, business.
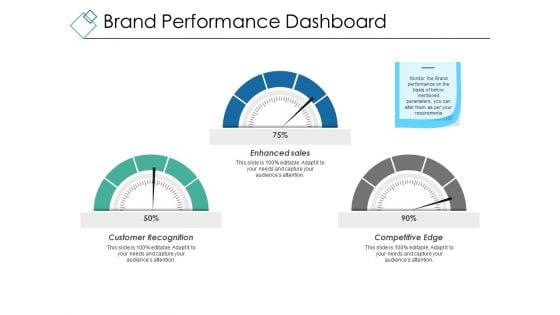
Brand Performance Dashboard Ppt PowerPoint Presentation Show Graphic Tips
This is a brand performance dashboard ppt powerpoint presentation show graphic tips. This is a three stage process. The stages in this process are customer recognition, enhanced sales, competitive edge, dashboard, business, percentage.
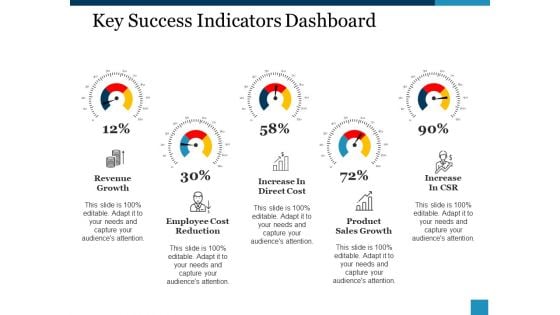
Key Success Indicators Dashboard Ppt PowerPoint Presentation Inspiration Guide
This is a key success indicators dashboard ppt powerpoint presentation inspiration guide. This is a five stage process. The stages in this process are revenue growth, increase in direct cost, increase in csr, employee cost reduction, product, sales growth.
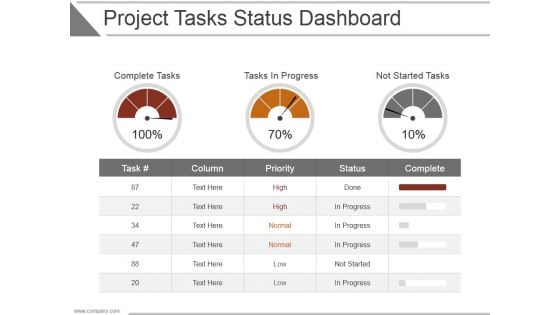
Project Tasks Status Dashboard Ppt PowerPoint Presentation Layouts
This is a project tasks status dashboard ppt powerpoint presentation layouts. This is a three stage process. The stages in this process are complete tasks, tasks in progress, not started tasks, complete, status.
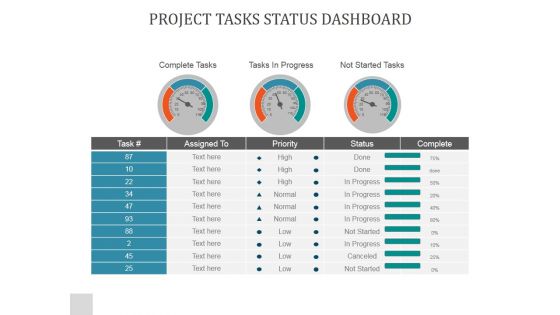
Project Tasks Status Dashboard Ppt PowerPoint Presentation Templates
This is a project tasks status dashboard ppt powerpoint presentation templates. This is a three stage process. The stages in this process are complete tasks, tasks in progress, not started tasks.

Project Tasks Status Dashboard Ppt PowerPoint Presentation Professional Pictures
This is a project tasks status dashboard ppt powerpoint presentation professional pictures. This is a three stage process. The stages in this process are complete tasks, task in progress, not started tasks, task.
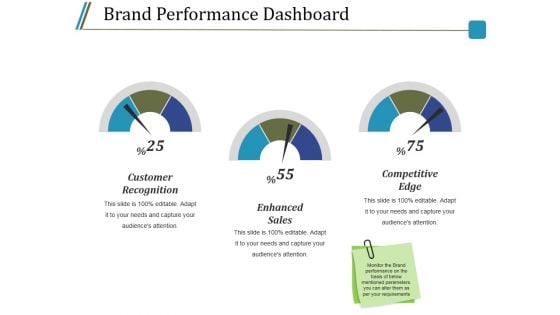
Brand Performance Dashboard Ppt PowerPoint Presentation Infographics Shapes
This is a brand performance dashboard ppt powerpoint presentation infographics shapes. This is a three stage process. The stages in this process are customer recognition, enhanced sales, competitive edge.
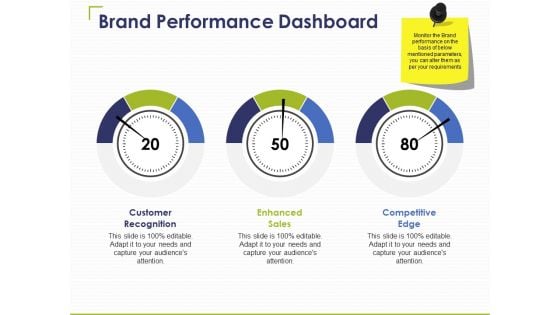
Brand Performance Dashboard Ppt PowerPoint Presentation Infographic Template Designs
This is a brand performance dashboard ppt powerpoint presentation infographic template designs. This is a three stage process. The stages in this process are customer recognition, enhanced sales, competitive edge.
Brand Performance Dashboard Ppt PowerPoint Presentation Icon Microsoft
This is a brand performance dashboard ppt powerpoint presentation icon microsoft. This is a three stage process. The stages in this process are customer recognition, enhanced sales, competitive edge.
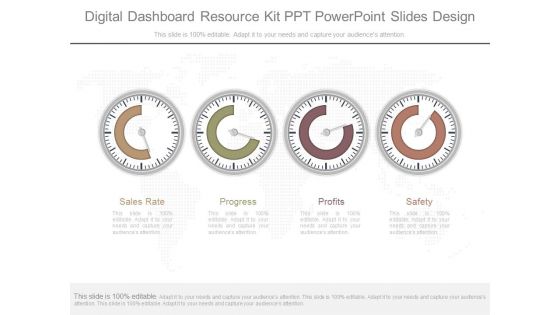
Digital Dashboard Resource Kit Ppt Powerpoint Slides Design
This is a digital dashboard resource kit ppt powerpoint slides design. This is a four stage process. The stages in this process are sales rate, progress, profits, safety.
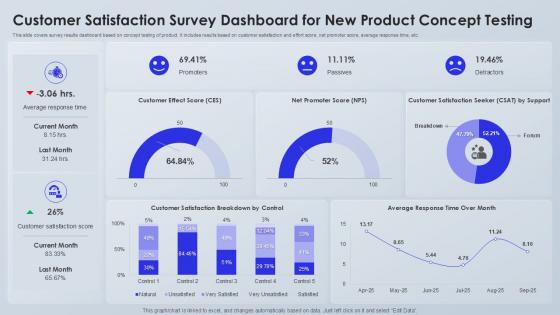
Customer Satisfaction Survey Dashboard For New Product Concept Testing
Find a pre-designed and impeccable Customer Satisfaction Survey Dashboard For New Product Concept Testing. The templates can ace your presentation without additional effort. You can download these easy-to-edit presentation templates to make your presentation stand out from others. So, what are you waiting for Download the template from Slidegeeks today and give a unique touch to your presentation. This slide highlights the survey results dashboard, focusing on product concept testing. It involves key metrics such as customer satisfaction, effort score, net promoter score, and average response time, providing valuable insights to refine and improve the product.
Brand Building Brand Performance Dashboard Ppt Icon Diagrams PDF
Presenting this set of slides with name brand building brand performance dashboard ppt icon diagrams pdf. This is a three stage process. The stages in this process are customer recognition, enhanced sales, competitive edge. This is a completely editable PowerPoint presentation and is available for immediate download. Download now and impress your audience.
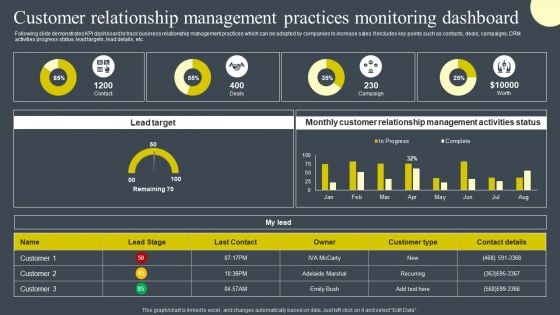
Customer Relationship Management Practices Monitoring Dashboard Designs PDF
Following slide demonstrates KPI dashboard to track business relationship management practices which can be adopted by companies to increase sales. It includes key points such as contacts, deals, campaigns, CRM activities progress status, lead targets, lead details, etc. Are you in need of a template that can accommodate all of your creative concepts This one is crafted professionally and can be altered to fit any style. Use it with Google Slides or PowerPoint. Include striking photographs, symbols, depictions, and other visuals. Fill, move around, or remove text boxes as desired. Test out color palettes and font mixtures. Edit and save your work, or work with colleagues. Download Customer Relationship Management Practices Monitoring Dashboard Designs PDF and observe how to make your presentation outstanding. Give an impeccable presentation to your group and make your presentation unforgettable.
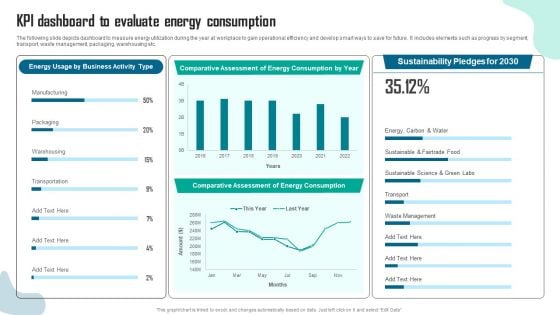
KPI Dashboard To Evaluate Energy Consumption Designs PDF
The following slide depicts dashboard to measure energy utilization during the year at workplace to gain operational efficiency and develop smart ways to save for future. It includes elements such as progress by segment, transport, waste management, packaging, warehousing etc. Do you know about Slidesgeeks KPI Dashboard To Evaluate Energy Consumption Designs PDF These are perfect for delivering any kind od presentation. Using it, create PowerPoint presentations that communicate your ideas and engage audiences. Save time and effort by using our pre designed presentation templates that are perfect for a wide range of topic. Our vast selection of designs covers a range of styles, from creative to business, and are all highly customizable and easy to edit. Download as a PowerPoint template or use them as Google Slides themes.
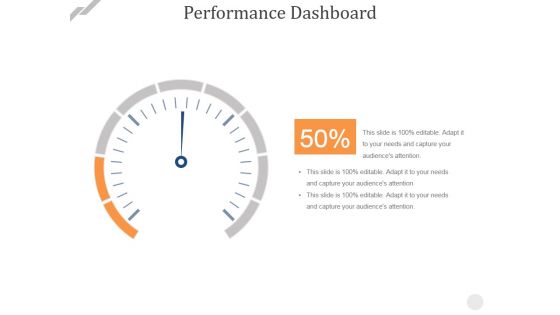
Performance Dashboard Template 2 Ppt PowerPoint Presentation Picture
This is a performance dashboard template 2 ppt powerpoint presentation picture. This is a one stage process. The stages in this dashboard, planning, management, strategy, marketing, business.
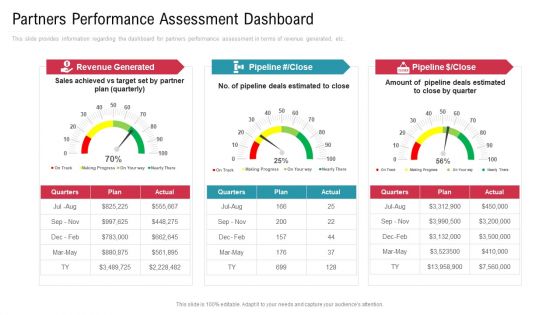
Co Variety Advertisement Partners Performance Assessment Dashboard Introduction PDF
This slide provides information regarding the dashboard for partners performance assessment in terms of revenue generated, etc. Presenting co variety advertisement partners performance assessment dashboard introduction pdf to provide visual cues and insights. Share and navigate important information on three stages that need your due attention. This template can be used to pitch topics like revenue generated, marketing progress, plan. In addition, this PPT design contains high-resolution images, graphics, etc, that are easily editable and available for immediate download.
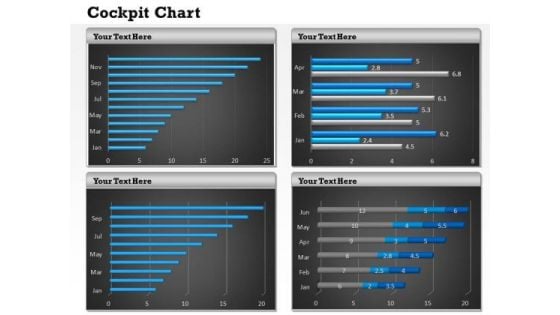
Sales Diagram Visual Design Of Dashboard Strategy Diagram
Dominate Proceedings With Your Ideas. Our Sales Diagram Visual Design Of Dashboard Strategy Diagram Powerpoint Templates Will Empower Your Thoughts.
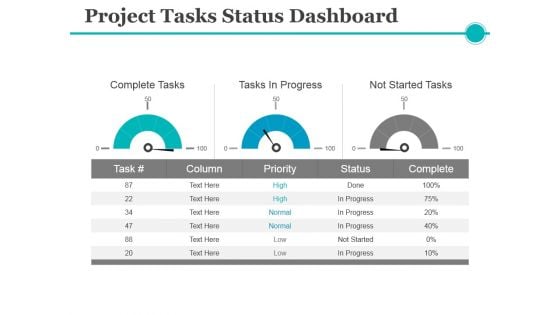
Project Tasks Status Dashboard Ppt PowerPoint Presentation File Graphics Download
This is a project tasks status dashboard ppt powerpoint presentation file graphics download. This is a three stage process. The stages in this process are complete tasks, tasks in progress, not started tasks.
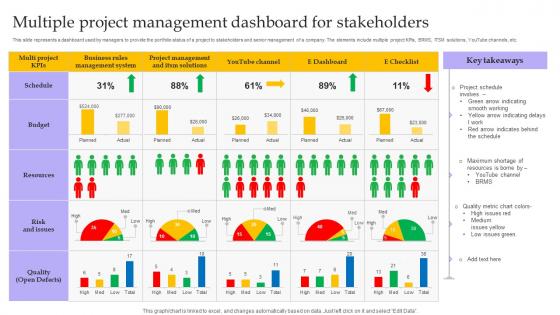
Multiple Project Management Dashboard For Stakeholders Portrait Pdf
This slide represents a dashboard used by managers to provide the portfolio status of a project to stakeholders and senior management of a company. The elements include multiple project KPIs, BRMS, ITSM solutions, YouTube channels, etc. Pitch your topic with ease and precision using this Multiple Project Management Dashboard For Stakeholders Portrait Pdf. This layout presents information on Multiple Project Management, Dashboard For Stakeholders, Youtube Channels. It is also available for immediate download and adjustment. So, changes can be made in the color, design, graphics or any other component to create a unique layout. This slide represents a dashboard used by managers to provide the portfolio status of a project to stakeholders and senior management of a company. The elements include multiple project KPIs, BRMS, ITSM solutions, YouTube channels, etc.
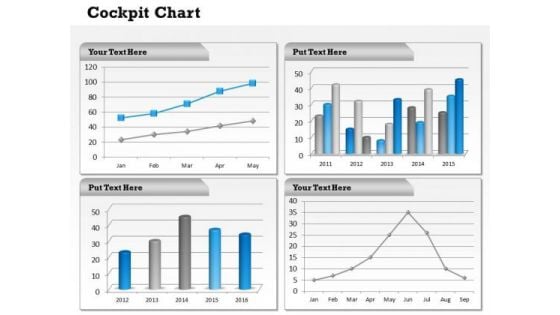
Consulting Diagram Dashboard Layout For Business Reporting Sales Diagram
Dominate Proceedings With Your Ideas. Our Consulting Diagram Dashboard Layout For Business Reporting Sales Diagram Powerpoint Templates Will Empower Your Thoughts.
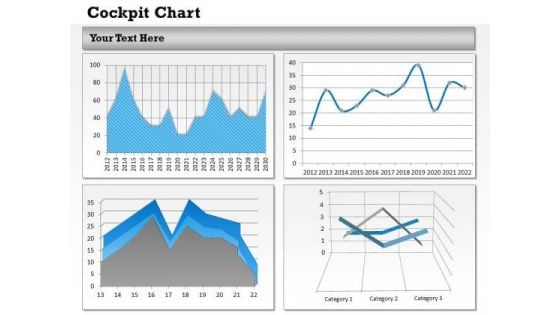
Strategic Management Dashboard Layout For Business Business Cycle Diagram
Knock On The Door To Success With Our Strategic Management Dashboard Layout For Business Business Cycle Diagram Powerpoint Templates. Be Assured Of Gaining Entry.


 Continue with Email

 Home
Home


