Progress Dashboard
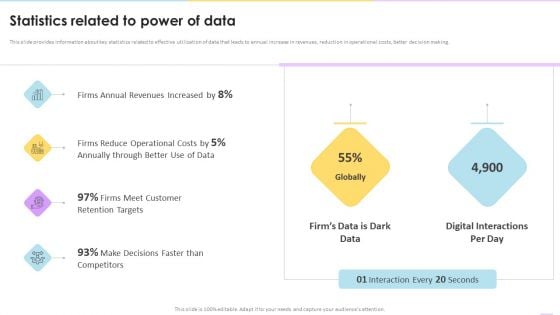
Data Valuation And Monetization Statistics Related To Power Of Data Designs PDF
This slide provides information about key statistics related to effective utilization of data that leads to annual increase in revenues, reduction in operational costs, better decision making. Deliver an awe inspiring pitch with this creative Data Valuation And Monetization Statistics Related To Power Of Data Designs PDF bundle. Topics like Firms Annual, Revenues Increased, Reduce Operational can be discussed with this completely editable template. It is available for immediate download depending on the needs and requirements of the user.
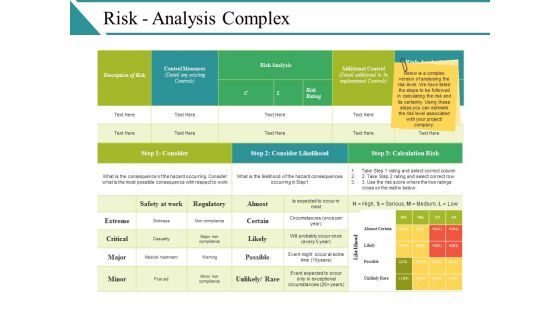
Risk Analysis Complex Ppt PowerPoint Presentation Styles Show
This is a risk analysis complex ppt powerpoint presentation styles show. This is a five stage process. The stages in this process are description of risk, risk analysis, extreme, critical, risk analysis.
Four Steps Of Cyber Security Data Breach Threats Process Ppt Icon Format Ideas PDF
This slide covers steps utilised to breach data. It includes stages such as probing, performing initial attack, expansion of attacks and data lifting. Presenting Four Steps Of Cyber Security Data Breach Threats Process Ppt Icon Format Ideas PDF to dispense important information. This template comprises one stages. It also presents valuable insights into the topics including Probe, Initial Attack, Expanded Attack, Data Lift. This is a completely customizable PowerPoint theme that can be put to use immediately. So, download it and address the topic impactfully.
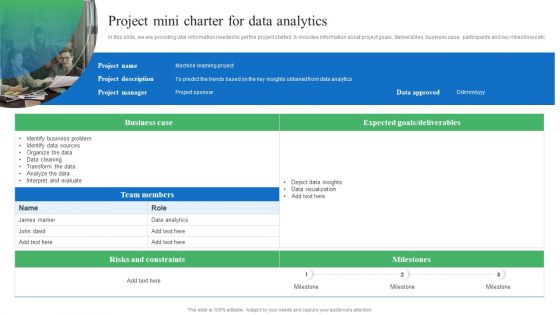
Toolkit For Data Science And Analytics Transition Project Mini Charter For Data Analytics Pictures PDF
In this slide, we are providing vital information needed to get the project started. It includes information about project goals, deliverables, business case, participants and key milestones etc. Welcome to our selection of the Toolkit For Data Science And Analytics Transition Project Mini Charter For Data Analytics Pictures PDF. These are designed to help you showcase your creativity and bring your sphere to life. Planning and Innovation are essential for any business that is just starting out. This collection contains the designs that you need for your everyday presentations. All of our PowerPoints are 100 percent editable, so you can customize them to suit your needs. This multi purpose template can be used in various situations. Grab these presentation templates today.
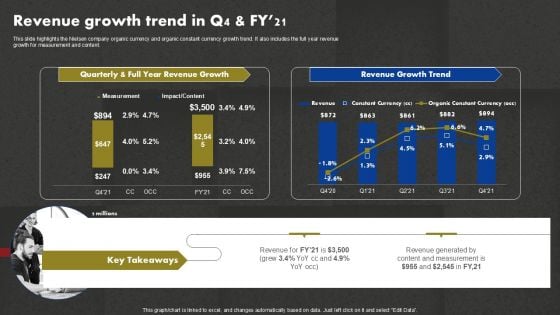
Data And Customer Analysis Company Outline Revenue Growth Trend In Q4 And Fy21 Template PDF
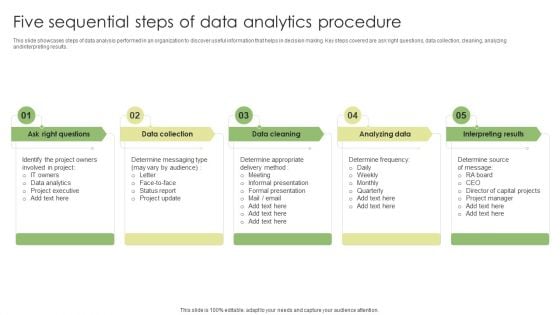
Five Sequential Steps Of Data Analytics Procedure Diagrams PDF
This slide showcases steps of data analysis performed in an organization to discover useful information that helps in decision making. Key steps covered are ask right questions, data collection, cleaning, analyzing and interpreting results. Persuade your audience using this Five Sequential Steps Of Data Analytics Procedure Diagrams PDF. This PPT design covers five stages, thus making it a great tool to use. It also caters to a variety of topics including Data Collection, Analyzing Data, Interpreting Results. Download this PPT design now to present a convincing pitch that not only emphasizes the topic but also showcases your presentation skills.
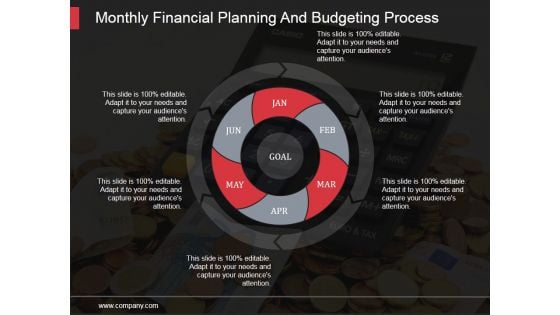
Monthly Financial Planning And Budgeting Process Ppt PowerPoint Presentation Visuals
This is a monthly financial planning and budgeting process ppt powerpoint presentation visuals. This is a six stage process. The stages in this process are growth, finance, development, financial development, economic growth, data analysis.
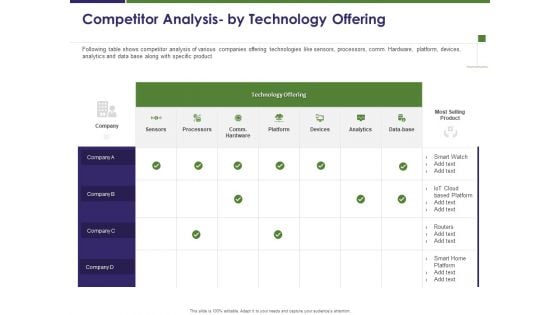
Business Intelligence Report Competitor Analysis By Technology Offering Ppt Infographics Slide Portrait PDF
Presenting this set of slides with name business intelligence report competitor analysis by technology offering ppt infographics slide portrait pdf. The topics discussed in these slides are sensors, processors, platform, devices, analytics, data base. This is a completely editable PowerPoint presentation and is available for immediate download. Download now and impress your audience.
Personal Data Visualization On Computer Screen Ppt PowerPoint Presentation Show Layout Ideas
Presenting this set of slides with name personal data visualization on computer screen ppt powerpoint presentation show layout ideas. This is a one stage process. The stages in this process are data visualization icon, research analysis, business focus. This is a completely editable PowerPoint presentation and is available for immediate download. Download now and impress your audience.
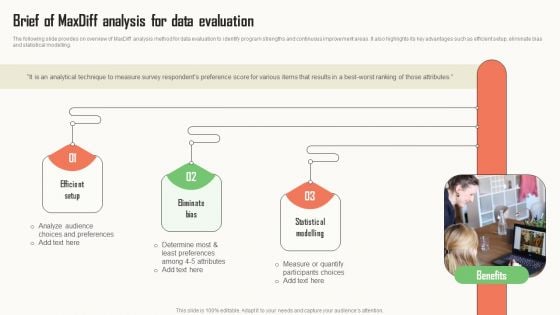
Strategic Market Insight Implementation Guide Brief Of Maxdiff Analysis For Data Evaluation Themes PDF
The following slide provides on overview of MaxDiff analysis method for data evaluation to identify program strengths and continuous improvement areas. It also highlights its key advantages such as efficient setup, eliminate bias and statistical modelling. Do you have to make sure that everyone on your team knows about any specific topic I yes, then you should give Strategic Market Insight Implementation Guide Brief Of Maxdiff Analysis For Data Evaluation Themes PDF a try. Our experts have put a lot of knowledge and effort into creating this impeccable Strategic Market Insight Implementation Guide Brief Of Maxdiff Analysis For Data Evaluation Themes PDF. You can use this template for your upcoming presentations, as the slides are perfect to represent even the tiniest detail. You can download these templates from the Slidegeeks website and these are easy to edit. So grab these today.
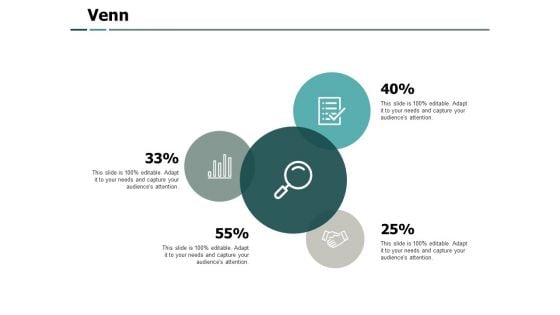
Venn Big Data Analysis Ppt PowerPoint Presentation Show Format
Presenting this set of slides with name venn big data analysis ppt powerpoint presentation show format. This is a four stage process. The stages in this process are marketing, business, management, planning, strategy. This is a completely editable PowerPoint presentation and is available for immediate download. Download now and impress your audience.
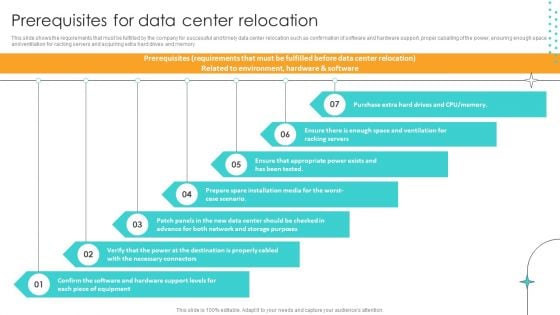
Cost Saving Benefits Of Implementing Data Center Prerequisites For Data Center Relocation Summary PDF
This slide shows the requirements that must be fulfilled by the company for successful and timely data center relocation such as confirmation of software and hardware support, proper caballing of the power, ensuring enough space and ventilation for racking servers and acquiring extra hard drives and memory. Present like a pro with Cost Saving Benefits Of Implementing Data Center Prerequisites For Data Center Relocation Summary PDF Create beautiful presentations together with your team, using our easy to use presentation slides. Share your ideas in real time and make changes on the fly by downloading our templates. So whether you are in the office, on the go, or in a remote location, you can stay in sync with your team and present your ideas with confidence. With Slidegeeks presentation got a whole lot easier. Grab these presentations today.
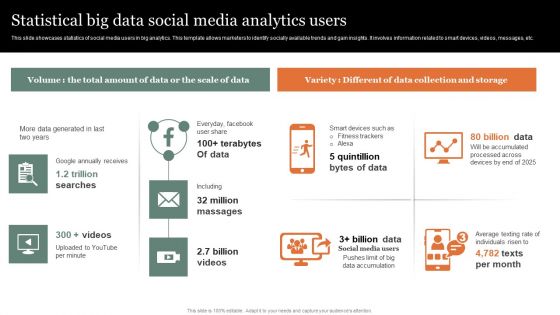
Statistical Big Data Social Media Analytics Users Pictures PDF
Showcasing this set of slides titled Statistical Big Data Social Media Analytics Users Pictures PDF Brochure. The topics addressed in these templates are Statistical, Social, Analytics. All the content presented in this PPT design is completely editable. Download it and make adjustments in color, background, font etc. as per your unique business setting.
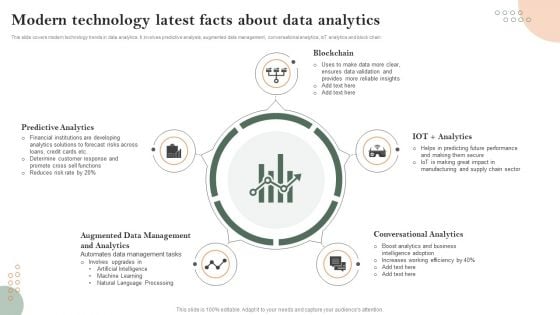
Modern Technology Latest Facts About Data Analytics Template PDF
This slide covers modern technology trends in data analytics. It involves predictive analysis, augmented data management, conversational analytics, IoT analytics and block chain. Persuade your audience using this Modern Technology Latest Facts About Data Analytics Template PDF. This PPT design covers Five stages, thus making it a great tool to use. It also caters to a variety of topics including Predictive Analytics, Blockchain, Conversational Analytics. Download this PPT design now to present a convincing pitch that not only emphasizes the topic but also showcases your presentation skills.
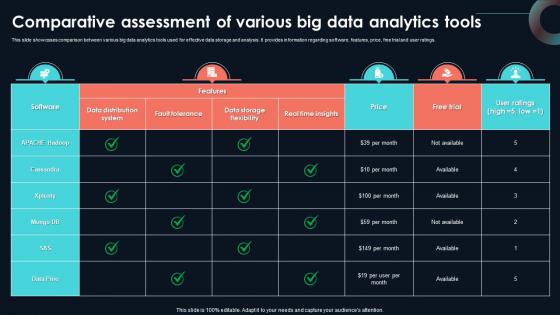
Comparative Assessment Of Various Big Developing Strategic Insights Using Big Data Analytics SS V
This slide showcases comparison between various big data analytics tools used for effective data storage and analysis. It provides information regarding software, features, price, free trial and user ratings. Explore a selection of the finest Comparative Assessment Of Various Big Developing Strategic Insights Using Big Data Analytics SS V here. With a plethora of professionally designed and pre-made slide templates, you can quickly and easily find the right one for your upcoming presentation. You can use our Comparative Assessment Of Various Big Developing Strategic Insights Using Big Data Analytics SS V to effectively convey your message to a wider audience. Slidegeeks has done a lot of research before preparing these presentation templates. The content can be personalized and the slides are highly editable. Grab templates today from Slidegeeks. This slide showcases comparison between various big data analytics tools used for effective data storage and analysis. It provides information regarding software, features, price, free trial and user ratings.
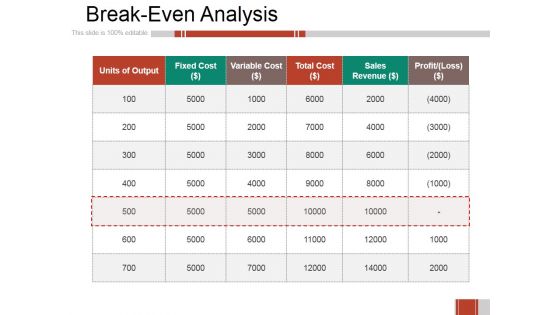
Breakeven Analysis Ppt PowerPoint Presentation Professional Design Templates
This is a breakeven analysis ppt powerpoint presentation professional design templates. This is a six stage process. The stages in this process are units of output, fixed cost, variable cost, total cost, sales revenue.
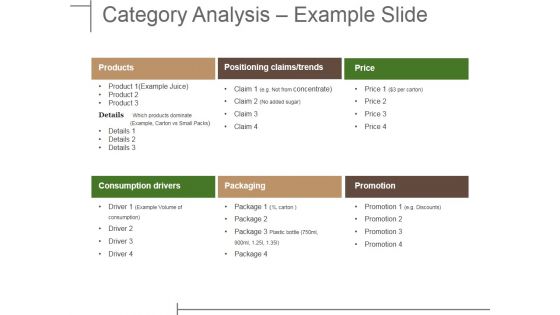
Category Analysis Example Slide Ppt PowerPoint Presentation Ideas Gridlines
This is a category analysis example slide ppt powerpoint presentation ideas gridlines. This is a six stage process. The stages in this process are products, positioning claims trends, price, consumption drivers, packaging, promotion.
Data Interpretation And Analysis Playbook Icons Slide For Data Interpretation And Analysis Playbook Designs PDF
Presenting our innovatively structured data interpretation and analysis playbook icons slide for data interpretation and analysis playbook designs pdf set of slides. The slides contain a hundred percent editable icons. You can replace these icons without any inconvenience. Therefore, pick this set of slides and create a striking presentation.
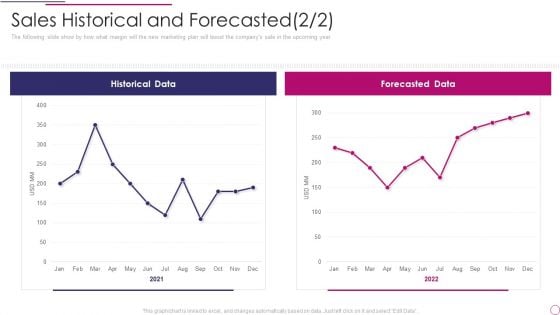
Performance Analysis Of New Product Development Sales Historical And Forecasted Data Rules PDF
The following slide show by how what margin will the new marketing plan will boost the companys sale in the upcoming year. Deliver and pitch your topic in the best possible manner with this performance analysis of new product development sales historical and forecasted data rules pdf. Use them to share invaluable insights on historical data, forecasted data and impress your audience. This template can be altered and modified as per your expectations. So, grab it now.
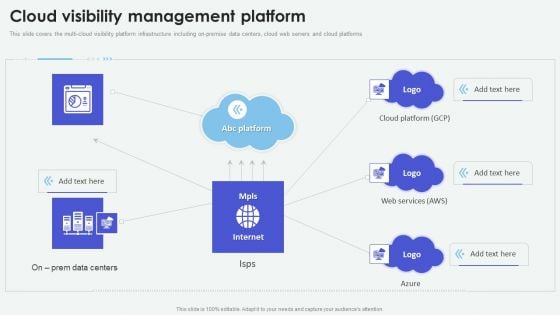
Cloud Based Computing Analysis Cloud Visibility Management Platform Professional PDF
This slide covers the multi-cloud visibility platform infrastructure including on-premise data centers, cloud web servers and cloud platforms. From laying roadmaps to briefing everything in detail, our templates are perfect for you. You can set the stage with your presentation slides. All you have to do is download these easy-to-edit and customizable templates. Cloud Based Computing Analysis Cloud Visibility Management Platform Professional PDF will help you deliver an outstanding performance that everyone would remember and praise you for. Do download this presentation today.
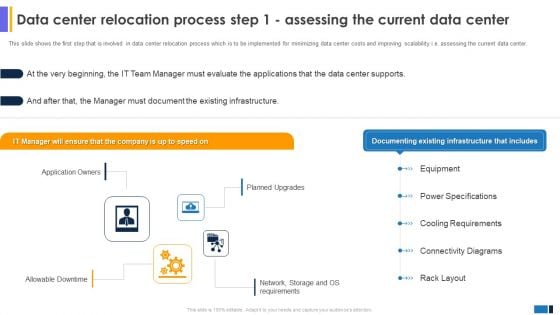
Data Center Relocation Process Step 1 Assessing The Current Data Center Designs PDF
This slide shows the first step that is involved in data center relocation process which is to be implemented for minimizing data center costs and improving scalability i.e. assessing the current data center.Get a simple yet stunning designed Data Center Relocation Process Step 1 Assessing The Current Data Center Designs PDF. It is the best one to establish the tone in your meetings. It is an excellent way to make your presentations highly effective. So, download this PPT today from Slidegeeks and see the positive impacts. Our easy-to-edit Data Center Relocation Process Step 1 Assessing The Current Data Center Designs PDF can be your go-to option for all upcoming conferences and meetings. So, what are you waiting for Grab this template today.
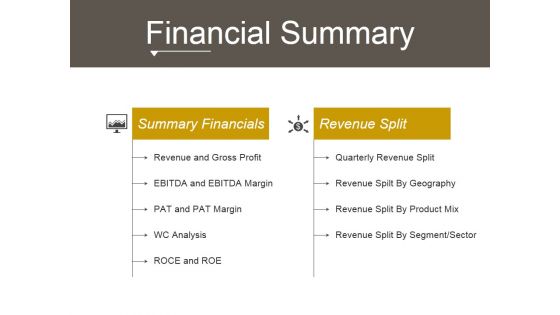
Financial Summary Ppt PowerPoint Presentation Information
This is a financial summary ppt powerpoint presentation information. This is a two stage process. The stages in this process are revenue and gross profit, quarterly revenue split, revenue spilt by geography, revenue split by product mix, revenue split by segment sector.
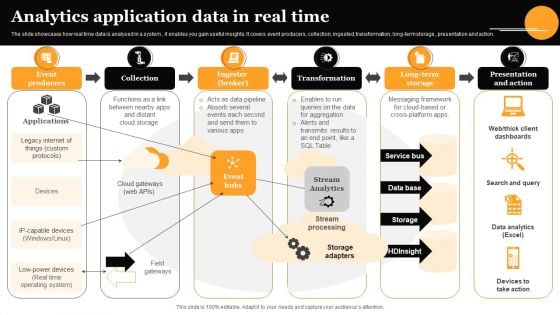
Analytics Application Data In Real Time Elements PDF
The slide showcases how real time data is analysed in a system, it enables you gain useful insights. It covers event producers, collection, ingested, transformation, long-term storage , presentation and action. Showcasing this set of slides titled Analytics Application Data In Real Time Elements PDF. The topics addressed in these templates are Event Producers, Collection, Transformation . All the content presented in this PPT design is completely editable. Download it and make adjustments in color, background, font etc. as per your unique business setting.
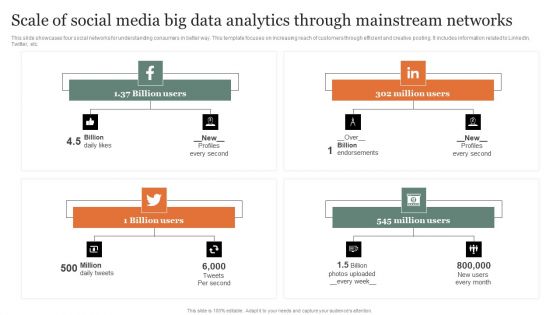
Scale Of Social Media Big Data Analytics Through Mainstream Networks Introduction PDF
This slide showcases four social networks for understanding consumers in better way. This template focuses on increasing reach of customers through efficient and creative posting. It includes information related to LinkedIn, Twitter, etc. Showcasing this set of slides titled Scale Of Social Media Big Data Analytics Through Mainstream Networks Introduction PDF Elements. The topics addressed in these templates are Mainstream Networks, Million Users, Scale. All the content presented in this PPT design is completely editable. Download it and make adjustments in color, background, font etc. as per your unique business setting.
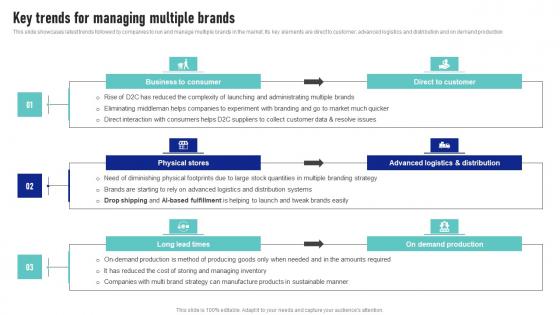
Key Trends For Managing Multiple Brands Launching New Product Brand Diagrams Pdf
This slide showcases latest trends followed by companies to run and manage multiple brands in the market. Its key elements are direct to customer, advanced logistics and distribution and on demand production The Key Trends For Managing Multiple Brands Launching New Product Brand Diagrams Pdf is a compilation of the most recent design trends as a series of slides. It is suitable for any subject or industry presentation, containing attractive visuals and photo spots for businesses to clearly express their messages. This template contains a variety of slides for the user to input data, such as structures to contrast two elements, bullet points, and slides for written information. Slidegeeks is prepared to create an impression. This slide showcases latest trends followed by companies to run and manage multiple brands in the market. Its key elements are direct to customer, advanced logistics and distribution and on demand production

Bivariate Analysis Techniques For Data Visualization Formats PDF
This slide describes the second analysis technique, bivariate analysis for data visualization, which includes three plots line, bar, and scatter. Are you in need of a template that can accommodate all of your creative concepts This one is crafted professionally and can be altered to fit any style. Use it with Google Slides or PowerPoint. Include striking photographs, symbols, depictions, and other visuals. Fill, move around, or remove text boxes as desired. Test out color palettes and font mixtures. Edit and save your work, or work with colleagues. Download Bivariate Analysis Techniques For Data Visualization Formats PDF and observe how to make your presentation outstanding. Give an impeccable presentation to your group and make your presentation unforgettable.
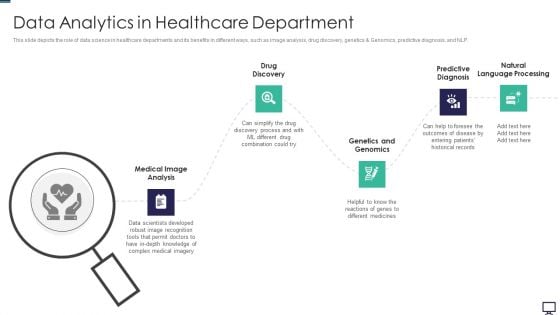
Data Analytics In Healthcare Department Ppt Outline Demonstration
This slide depicts the role of data science in healthcare departments and its benefits in different ways, such as image analysis, drug discovery, genetics and Genomics, predictive diagnosis, and NLP. Presenting data analytics in healthcare department ppt outline demonstration to provide visual cues and insights. Share and navigate important information on five stages that need your due attention. This template can be used to pitch topics like data analytics in healthcare department. In addtion, this PPT design contains high resolution images, graphics, etc, that are easily editable and available for immediate download.
8 Stages Crayons Marketing Process Ppt 5 Best Business Plan Software PowerPoint Slides
We present our 8 stages crayons marketing process ppt 5 best business plan software PowerPoint Slides.Download our Finance PowerPoint Templates because Our PowerPoint Templates and Slides will embellish your thoughts. See them provide the desired motivation to your team. Download and present our Marketing PowerPoint Templates because Our PowerPoint Templates and Slides will let your team Walk through your plans. See their energy levels rise as you show them the way. Use our Business PowerPoint Templates because Our PowerPoint Templates and Slides will Activate the energies of your audience. Get their creative juices flowing with your words. Download and present our Shapes PowerPoint Templates because It will let you Set new benchmarks with our PowerPoint Templates and Slides. They will keep your prospects well above par. Use our Process and Flows PowerPoint Templates because You are well armed with penetrative ideas. Our PowerPoint Templates and Slides will provide the gunpowder you need.Use these PowerPoint slides for presentations relating to Market, isolated, statistics, grow, economy, business graphs, white, bar, business, concept, arrow, line, success, presentation, growing, symbol, diagram, finance, data, stock, analysis, drawing, zigzag line, charts graphs, handwriting, business chart, graph, trend, chart, research, up, frame, growth, sketch, pencil, progress, stats, profit, increase, background, board, successful, conceptual, improvement, analyze. The prominent colors used in the PowerPoint template are Blue, Gray, Black. Use our 8 Stages Crayons Marketing Process Ppt 5 Best Business Plan Software PowerPoint Slides to bullet point your ideas. See them listed out perfectly
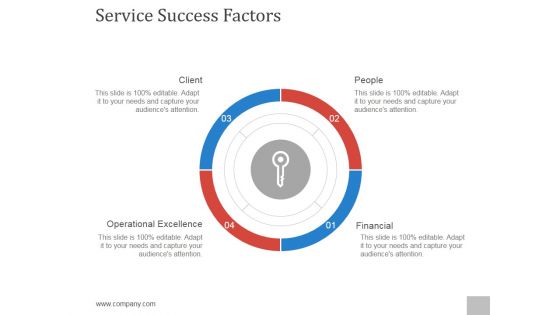
Service Success Factors Template 1 Ppt PowerPoint Presentation Inspiration
This is a service success factors template 1 ppt powerpoint presentation inspiration. This is a four stage process. The stages in this process are client, operational excellence, people, financial, targeting.
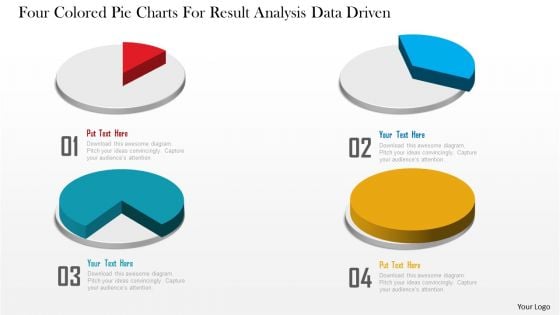
Business Diagram Four Colored Pie Charts For Result Analysis Data Driven PowerPoint Slide
This business diagram displays graphic of pie charts. This business slide is suitable to present and compare business data. Use this diagram to build professional presentations for your viewers.
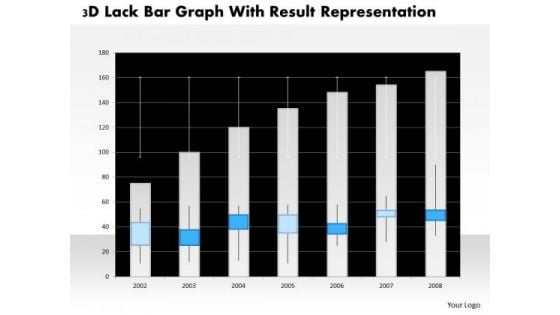
Business Diagram 3d Lack Bar Graph With Result Representation PowerPoint Slide
This business diagram has graphic of 3d lack bar graph. This diagram is a data visualization tool that gives you a simple way to present statistical information. This slide helps your audience examine and interpret the data you present.
Business Diagram Battery Connected With Bulb For Idea Generation PowerPoint Slide
This business slide displays battery icon connected with bulb. This diagram is a data visualization tool that gives you a simple way to present statistical information. This slide helps your audience examine and interpret the data you present.
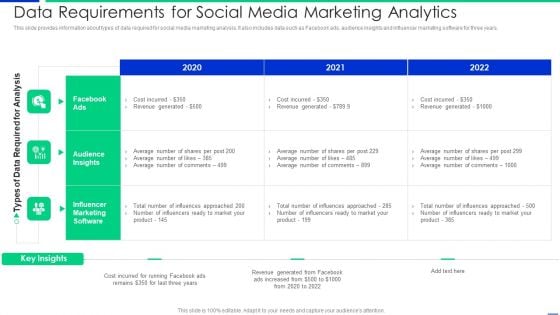
Data Requirements For Social Media Marketing Analytics Template PDF
This slide provides information about types of data required for social media marketing analysis. It also includes data such as Facebook ads, audience insights and influencer marketing software for three years. Showcasing this set of slides titled data requirements for social media marketing analytics template pdf. The topics addressed in these templates are average, marketing, cost. All the content presented in this PPT design is completely editable. Download it and make adjustments in color, background, font etc. as per your unique business setting.
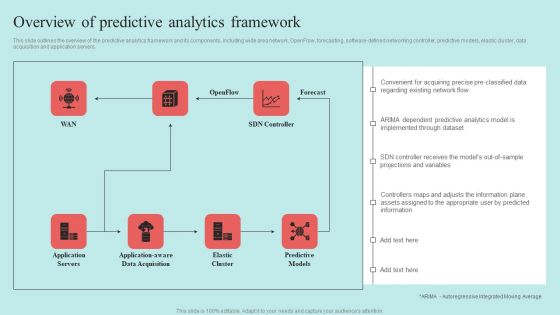
Predictive Data Model Overview Of Predictive Analytics Framework Summary PDF
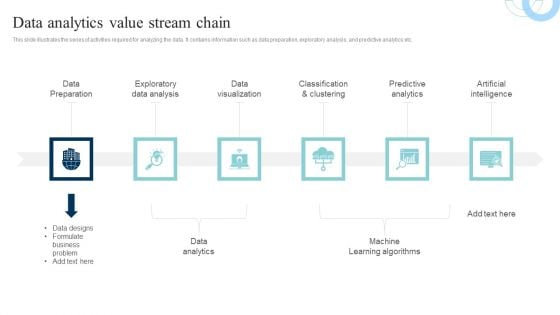
Data Evaluation And Processing Toolkit Data Analytics Value Stream Chain Microsoft PDF
This slide illustrates the series of activities required for analyzing the data. It contains information such as data preparation, exploratory analysis, and predictive analytics etc. Formulating a presentation can take up a lot of effort and time, so the content and message should always be the primary focus. The visuals of the PowerPoint can enhance the presenters message, so our Data Evaluation And Processing Toolkit Data Analytics Value Stream Chain Microsoft PDF was created to help save time. Instead of worrying about the design, the presenter can concentrate on the message while our designers work on creating the ideal templates for whatever situation is needed. Slidegeeks has experts for everything from amazing designs to valuable content, we have put everything into Data Evaluation And Processing Toolkit Data Analytics Value Stream Chain Microsoft PDF.
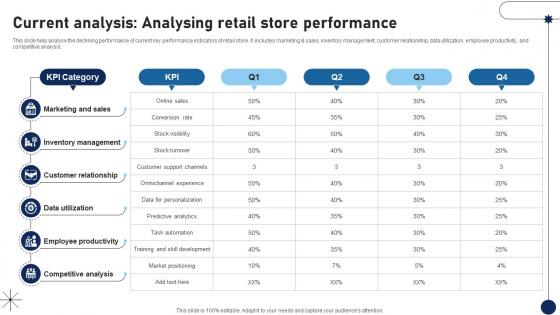
Current Analysis Analysing Retail Store Performance DT SS V
This slide help analyse the declining performance of current key performance indicators of retail store. It includes marketing and sales, inventory management, customer relationship, data utilization, employee productivity, and competitive analysis.Whether you have daily or monthly meetings, a brilliant presentation is necessary. Current Analysis Analysing Retail Store Performance DT SS V can be your best option for delivering a presentation. Represent everything in detail using Current Analysis Analysing Retail Store Performance DT SS V and make yourself stand out in meetings. The template is versatile and follows a structure that will cater to your requirements. All the templates prepared by Slidegeeks are easy to download and edit. Our research experts have taken care of the corporate themes as well. So, give it a try and see the results. This slide help analyse the declining performance of current key performance indicators of retail store. It includes marketing and sales, inventory management, customer relationship, data utilization, employee productivity, and competitive analysis.
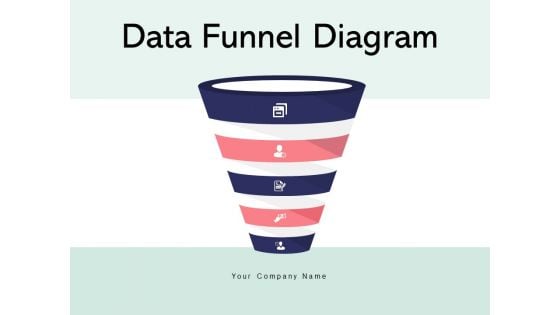
Data Funnel Diagram Interest Analysis Ppt PowerPoint Presentation Complete Deck
Presenting this set of slides with name data funnel diagram interest analysis ppt powerpoint presentation complete deck. The topics discussed in these slides are interest, analysis, arrow, marketing, funnel. This is a completely editable PowerPoint presentation and is available for immediate download. Download now and impress your audience.
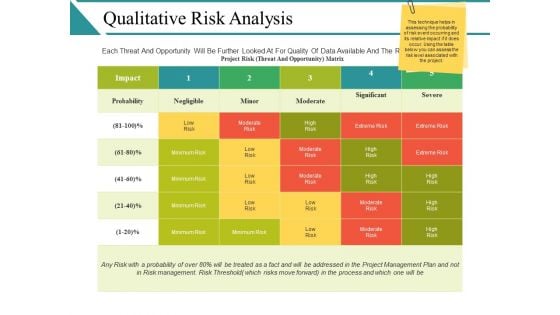
Qualitative Risk Analysis Ppt PowerPoint Presentation Infographics Show
This is a qualitative risk analysis ppt powerpoint presentation infographics show. This is a five stage process. The stages in this process are probability, negligible, minor, moderate, significant.
SAC Planning And Implementation Deployment Options For SAP Analytics Cloud Icons PDF
The purpose of this slide is to provide an information regarding the deployment methods for SAP Analytics Cloud implementation in the business organization. It also contains details of each deployment options key features. Presenting SAC Planning And Implementation Deployment Options For SAP Analytics Cloud Icons PDF to provide visual cues and insights. Share and navigate important information on two stages that need your due attention. This template can be used to pitch topics like Deployment Option Cloud, Most Suitable, Low implementation cost. In addtion, this PPT design contains high resolution images, graphics, etc, that are easily editable and available for immediate download.
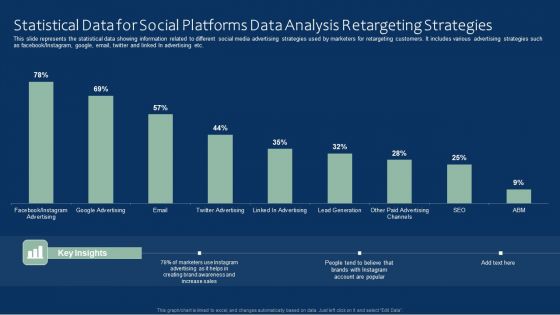
Statistical Data For Social Platforms Data Analysis Retargeting Strategies Inspiration PDF
This slide represents the statistical data showing information related to different social media advertising strategies used by marketers for retargeting customers. It includes various advertising strategies such as facebook or Instagram, google, email, twitter and linked In advertising etc. Showcasing this set of slides titled Statistical Data For Social Platforms Data Analysis Retargeting Strategies Inspiration PDF. The topics addressed in these templates are Social Platforms Data, Statistical Data, Analysis Retargeting Strategies. All the content presented in this PPT design is completely editable. Download it and make adjustments in color, background, font etc. as per your unique business setting.
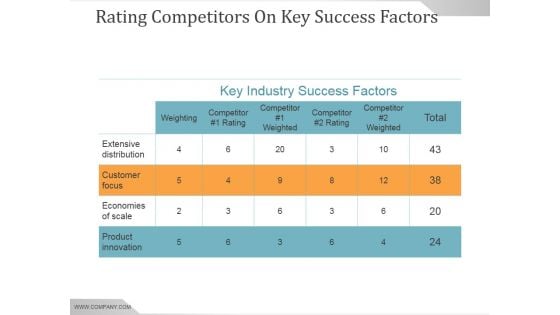
Rating Competitors On Key Success Factors Ppt PowerPoint Presentation Professional
This is a rating competitors on key success factors ppt powerpoint presentation professional. This is a four stage process. The stages in this process are extensive distribution, customer focus, economies of scale, product innovation.
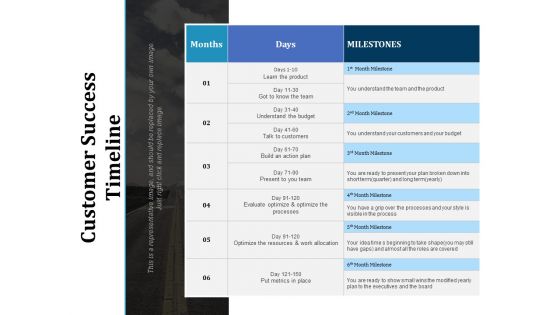
Customer Success Timeline Ppt PowerPoint Presentation Infographic Template Microsoft
This is a customer success timeline ppt powerpoint presentation infographic template microsoft. This is a six stage process. The stages in this process are build an action plan, days, management, planning, strategy.
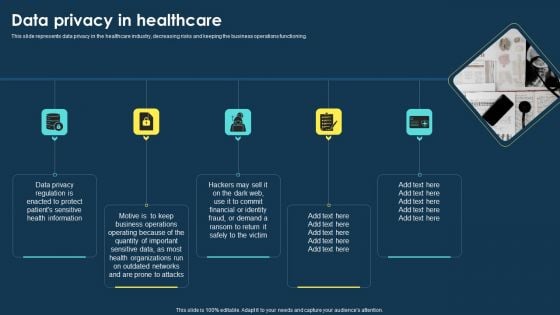
Integrating Data Privacy System Data Privacy In Healthcare Ppt Pictures Information PDF
This slide represents data privacy in the healthcare industry, decreasing risks and keeping the business operations functioning. If you are looking for a format to display your unique thoughts, then the professionally designed Integrating Data Privacy System Data Privacy In Healthcare Ppt Pictures Information PDF is the one for you. You can use it as a Google Slides template or a PowerPoint template. Incorporate impressive visuals, symbols, images, and other charts. Modify or reorganize the text boxes as you desire. Experiment with shade schemes and font pairings. Alter, share or cooperate with other people on your work. Download Integrating Data Privacy System Data Privacy In Healthcare Ppt Pictures Information PDF and find out how to give a successful presentation. Present a perfect display to your team and make your presentation unforgettable.
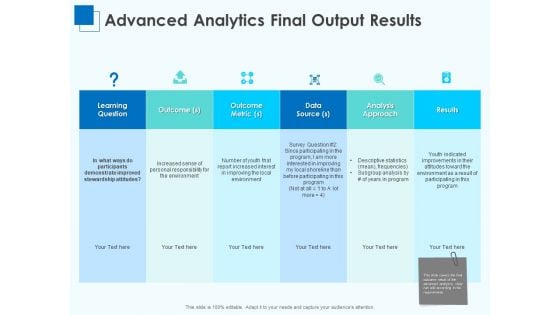
Corporate Intelligence Business Analysis Advanced Analytics Final Output Results Source Template PDF
Deliver an awe-inspiring pitch with this creative corporate intelligence business analysis advanced analytics final output results source template pdf bundle. Topics like learning question, outcome, outcome metric, analysis approach, results, data source can be discussed with this completely editable template. It is available for immediate download depending on the needs and requirements of the user.
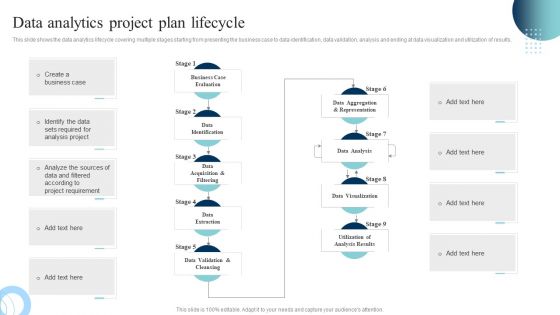
Data Evaluation And Processing Toolkit Data Analytics Project Plan Lifecycle Background PDF
This slide shows the data analytics lifecycle covering multiple stages starting from presenting the business case to data identification, data validation, analysis and ending at data visualization and utilization of results. Are you in need of a template that can accommodate all of your creative concepts This one is crafted professionally and can be altered to fit any style. Use it with Google Slides or PowerPoint. Include striking photographs, symbols, depictions, and other visuals. Fill, move around, or remove text boxes as desired. Test out color palettes and font mixtures. Edit and save your work, or work with colleagues. Download Data Evaluation And Processing Toolkit Data Analytics Project Plan Lifecycle Background PDF and observe how to make your presentation outstanding. Give an impeccable presentation to your group and make your presentation unforgettable.
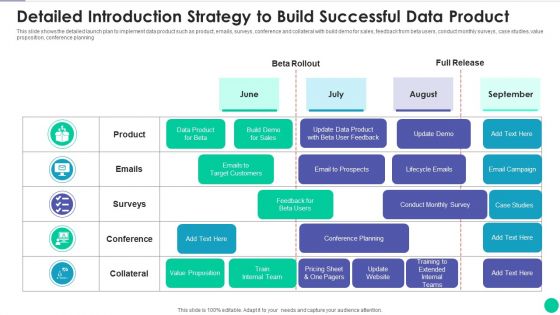
Detailed Introduction Strategy To Build Successful Data Product Diagrams PDF
This slide shows the detailed launch plan to implement data product such as product, emails, surveys, conference and collateral with build demo for sales, feedback from beta users, conduct monthly surveys, case studies, value proposition, conference planning Showcasing this set of slides titled detailed introduction strategy to build successful data product diagrams pdf. The topics addressed in these templates are detailed introduction strategy to build successful data product. All the content presented in this PPT design is completely editable. Download it and make adjustments in color, background, font etc. as per your unique business setting.
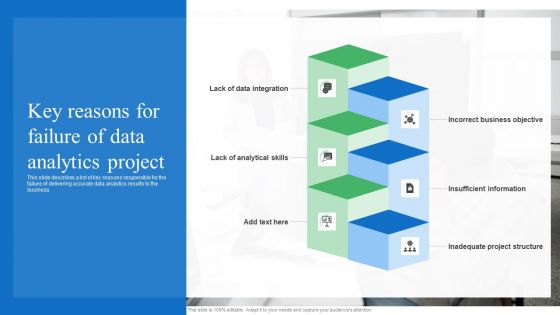
Toolkit For Data Science And Analytics Transition Key Reasons For Failure Of Data Analytics Project Portrait PDF
This slide describes a list of key reasons responsible for the failure of delivering accurate data analytics results to the business. Present like a pro with Toolkit For Data Science And Analytics Transition Key Reasons For Failure Of Data Analytics Project Portrait PDF Create beautiful presentations together with your team, using our easy to use presentation slides. Share your ideas in real time and make changes on the fly by downloading our templates. So whether you are in the office, on the go, or in a remote location, you can stay in sync with your team and present your ideas with confidence. With Slidegeeks presentation got a whole lot easier. Grab these presentations today.
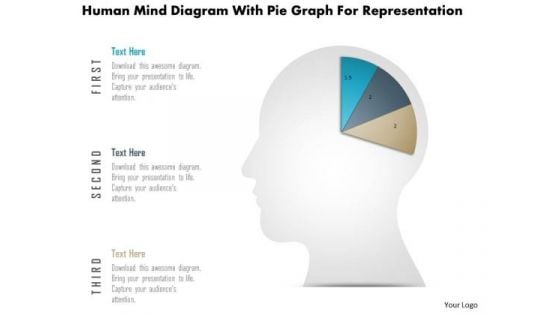
Business Diagram Human Mind Diagram With Pie Graph For Representation PowerPoint Slide
This diagram displays human face graphic divided into sections. This section can be used for data display. Use this diagram to build professional presentations for your viewers.

Business Diagram Six Staged Pie Charts For Text Representation PowerPoint Slide
This slide displays graphic six staged pie charts. Download this diagram to present and compare business data. Use this diagram to display business process workflows in any presentation.
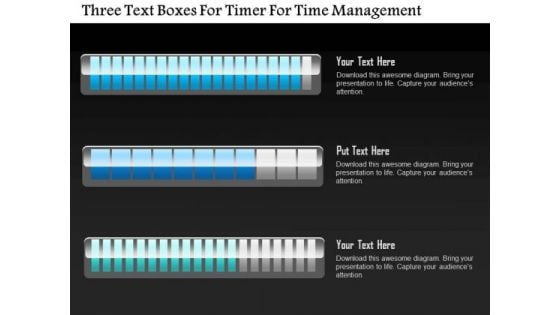
Business Diagram Three Text Boxes For Timer For Time Management PowerPoint Slide
This business diagram displays three text boxes. This diagram contains text boxes for data representation. Use this diagram to display business process workflows in any presentations.
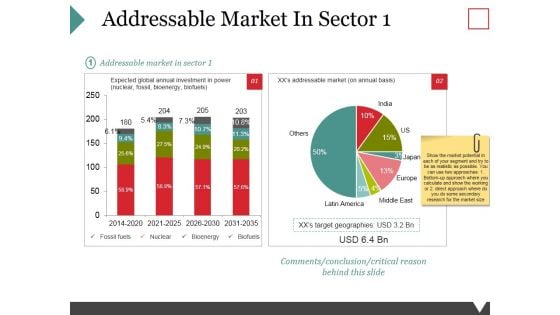
Addressable Market In Sector 1 Ppt PowerPoint Presentation Outline Shapes
This is a addressable market in sector 1 ppt powerpoint presentation outline shapes. This is a two stage process. The stages in this process are fossil fuels, nuclear, bioenergy, biofuels.
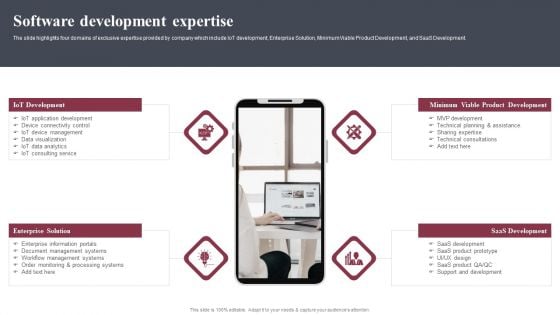
Business Software Development Company Profile Software Development Expertise Themes PDF
The slide highlights four domains of exclusive expertise provided by company which include IoT development, Enterprise Solution, Minimum Viable Product Development, and SaaS Development. Presenting Business Software Development Company Profile Software Development Expertise Themes PDF to provide visual cues and insights. Share and navigate important information on four stages that need your due attention. This template can be used to pitch topics like IoT Development, Enterprise Solution, Minimum Viable, Product Development. In addtion, this PPT design contains high resolution images, graphics, etc, that are easily editable and available for immediate download.
Power Point Arrows Statistical Analysis Of Process Data 2 Steps PowerPoint Templates
We present our power point arrows statistical analysis of process data 2 steps PowerPoint templates.Download and present our Business PowerPoint Templates because It is Aesthetically crafted by artistic young minds. Our PowerPoint Templates and Slides are designed to display your dexterity. Present our Arrows PowerPoint Templates because You can Rise to the occasion with our PowerPoint Templates and Slides. You will bring your audience on their feet in no time. Download and present our Circle Charts PowerPoint Templates because Our PowerPoint Templates and Slides help you pinpoint your timelines. Highlight the reasons for your deadlines with their use. Present our Shapes PowerPoint Templates because You aspire to touch the sky with glory. Let our PowerPoint Templates and Slides provide the fuel for your ascent. Present our Symbol PowerPoint Templates because You have gained great respect for your brilliant ideas. Use our PowerPoint Templates and Slides to strengthen and enhance your reputation.Use these PowerPoint slides for presentations relating to abstract, arrow, art, background, banner, blue, bright, business, circle, color, colorful, concept, conceptual, connection, creative, cycle, design, different, element, empty, flower, form, frame, graphic, green, group, idea, illustration, match, message, order, part, petal, piece, place, red, ring, shape, solution, special, speech, strategy, symbol, template, text, usable, vector, web, website. The prominent colors used in the PowerPoint template are Yellow, Brown, Black. People tell us our power point arrows statistical analysis of process data 2 steps PowerPoint templates will impress their bosses and teams. People tell us our circle PowerPoint templates and PPT Slides are designed by professionals Presenters tell us our power point arrows statistical analysis of process data 2 steps PowerPoint templates are second to none. We assure you our banner PowerPoint templates and PPT Slides will make the presenter successul in his career/life. Presenters tell us our power point arrows statistical analysis of process data 2 steps PowerPoint templates will help you be quick off the draw. Just enter your specific text and see your points hit home. Professionals tell us our background PowerPoint templates and PPT Slides will make the presenter look like a pro even if they are not computer savvy. File it down with our Power Point Arrows Statistical Analysis Of Process Data 2 Steps PowerPoint Templates. Get your thoughts into the shape you desire.
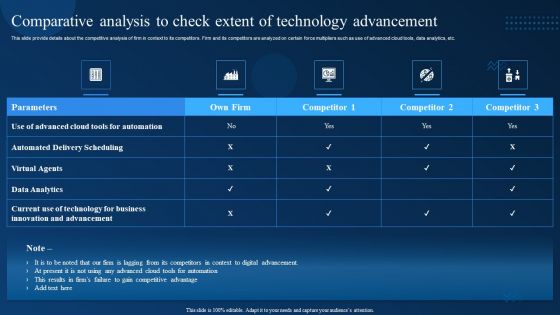
Comparative Analysis To Check Extent Of Technology Advancement Inspiration PDF
This slide provide details about the competitive analysis of firm in context to its competitors. Firm and its competitors are analyzed on certain force multipliers such as use of advanced cloud tools, data analytics, etc. Get a simple yet stunning designed Comparative Analysis To Check Extent Of Technology Advancement Inspiration PDF. It is the best one to establish the tone in your meetings. It is an excellent way to make your presentations highly effective. So, download this PPT today from Slidegeeks and see the positive impacts. Our easy to edit Comparative Analysis To Check Extent Of Technology Advancement Inspiration PDF can be your go to option for all upcoming conferences and meetings. So, what are you waiting for Grab this template today.
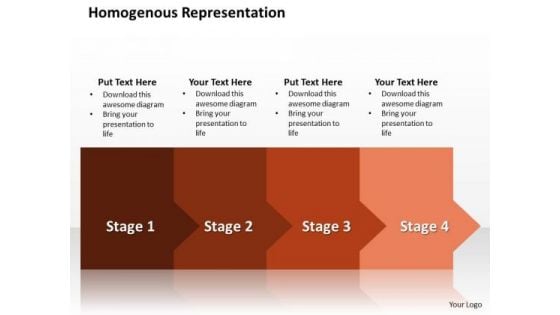
Ppt Homogenous Way To Prevent Banking Losses Four PowerPoint Slide Numbers Templates
PPT homogenous way to prevent banking losses four powerpoint slide numbers Templates-This PowerPoint Diagram shows you the Homogenous way to prevent Banking losses or losses in Business related Activities. It is shown by different shades of Brown color. It consists of four Stages.-PPT homogenous way to prevent banking losses four powerpoint slide numbers Templates-Arrow, Bank, Benefit, Business, Calculate, Calculation, Capitalist, Communication, Company, Concern, Connection, Data, Diagram, Digital, Drawing, Earnings, Economic, Finance, Financial, Flow, Forecast, Gain, Goal, Graph, Growth, Illustration, Increase, Information, Interest, Investing, Management, Market, Money, Move, Network, Objective, Plan, Process, Profit, Progress, Report, Rise, Risk, Shares, Statistics, Stock, System, Technology Pinpoint problems with our Ppt Homogenous Way To Prevent Banking Losses Four PowerPoint Slide Numbers Templates. Download without worries with our money back guaranteee.

Business And Financial Analysis Ppt PowerPoint Presentation Inspiration Design Templates
This is a business and financial analysis ppt powerpoint presentation inspiration design templates. This is a eight stage process. The stages in this process are investment, equipment, land cost, interior cost, employee cost.
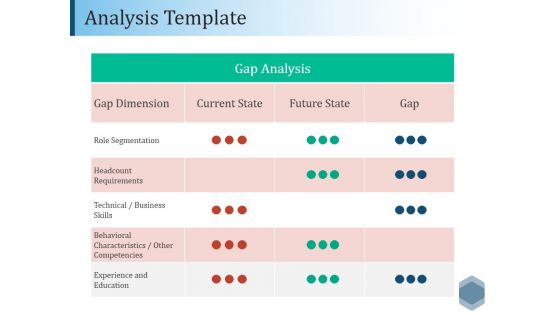
Analysis Template Ppt PowerPoint Presentation Gallery Visual Aids
This is a analysis template ppt powerpoint presentation gallery visual aids. This is a four stage process. The stages in this process are gap dimension, current state, future state, gap.
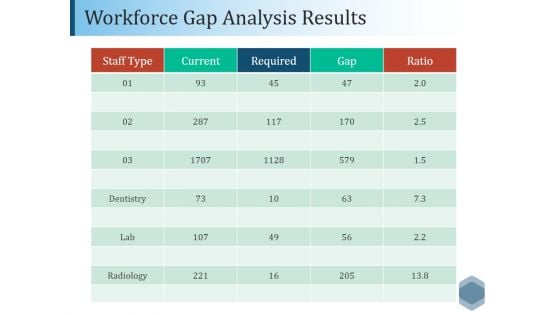
Workforce Gap Analysis Results Ppt PowerPoint Presentation Show Clipart
This is a workforce gap analysis results ppt powerpoint presentation show clipart. This is a five stage process. The stages in this process are staff type, current, required, gap, ratio.
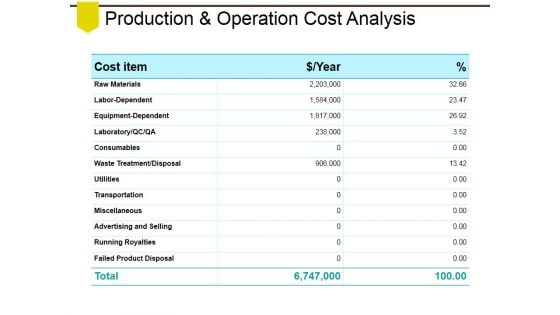
Production And Operation Cost Analysis Ppt PowerPoint Presentation Show Smartart
This is a production and operation cost analysis ppt powerpoint presentation show smartart. This is a three stage process. The stages in this process are raw materials, labor dependent, equipment dependent, consumables, utilities.
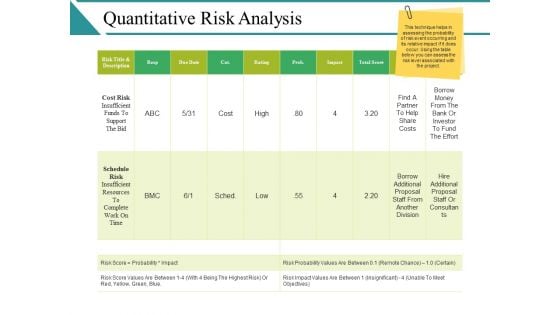
Quantitative Risk Analysis Ppt PowerPoint Presentation Model Influencers
This is a quantitative risk analysis ppt powerpoint presentation model influencers. This is a ten stage process. The stages in this process are cost risk, insufficient funds to support the bid, schedule risk, insufficient resources to complete work on time.


 Continue with Email

 Home
Home


