Progress Meter
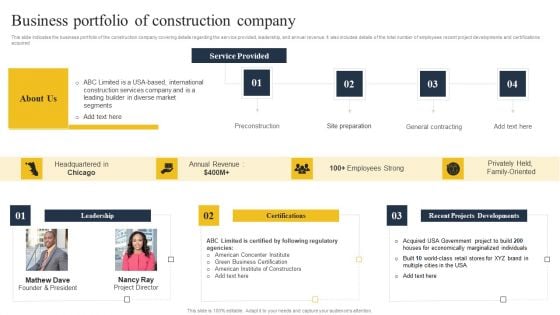
Security Control Techniques For Real Estate Project Business Portfolio Of Construction Company Professional PDF
This slide indicates the business portfolio of the construction company covering details regarding the service provided, leadership, and annual revenue. It also includes details of the total number of employees recent project developments and certifications acquired. Formulating a presentation can take up a lot of effort and time, so the content and message should always be the primary focus. The visuals of the PowerPoint can enhance the presenters message, so our Security Control Techniques For Real Estate Project Business Portfolio Of Construction Company Professional PDF was created to help save time. Instead of worrying about the design, the presenter can concentrate on the message while our designers work on creating the ideal templates for whatever situation is needed. Slidegeeks has experts for everything from amazing designs to valuable content, we have put everything into Security Control Techniques For Real Estate Project Business Portfolio Of Construction Company Professional PDF
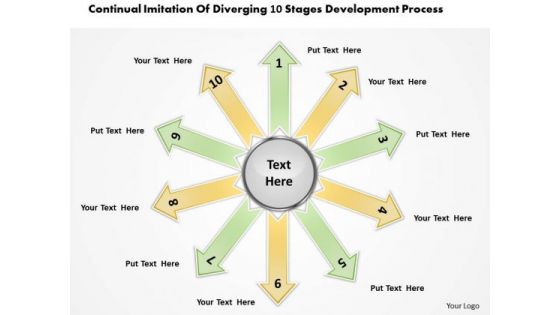
Imitation Of Diverging 10 Stages Development Process Ppt Pie Diagram PowerPoint Templates
We present our imitation of diverging 10 stages development process ppt Pie Diagram PowerPoint templates.Download our Arrows PowerPoint Templates because this layout helps you to see satisfaction spread across the room as they unravel your gifted views. Use our Circle Charts PowerPoint Templates because this Layout can explain the relevance of the different layers and stages in getting down to your core competence, ability and desired result. Use our Shapes PowerPoint Templates because it has inspired a whole new world of medical endeavour. Download our Business PowerPoint Templates because you can Lead your flock steadily to greater heights. Look around at the vast potential of achievement around you. Present our Flow Charts PowerPoint Templates because this is an excellent slide to detail and highlight your thought process, your views and your positive expectations..Use these PowerPoint slides for presentations relating to arrow, arrowheads, badge, banner, blue, button, cerulean, cobalt, colored, colorful, connection, cursor, cyan, design element, designator, icon, indicator, interface, internet, link, load, magenta, marker, matted, menu tool, navigation panel, next, orientation, page site, pictogram, pink, pointer, red, right, satined, sign, signpost, smooth, symbol, . The prominent colors used in the PowerPoint template are Yellow, Green, Gray. Presenters tell us our imitation of diverging 10 stages development process ppt Pie Diagram PowerPoint templates are Attractive. You can be sure our button PowerPoint templates and PPT Slides will make the presenter successul in his career/life. Professionals tell us our imitation of diverging 10 stages development process ppt Pie Diagram PowerPoint templates will impress their bosses and teams. People tell us our button PowerPoint templates and PPT Slides are Elevated. People tell us our imitation of diverging 10 stages development process ppt Pie Diagram PowerPoint templates provide great value for your money. Be assured of finding the best projection to highlight your words. Professionals tell us our blue PowerPoint templates and PPT Slides are Pretty. Give a fillip to your plans with our Imitation Of Diverging 10 Stages Development Process Ppt Pie Diagram PowerPoint Templates. They will get that extra attention you seek.
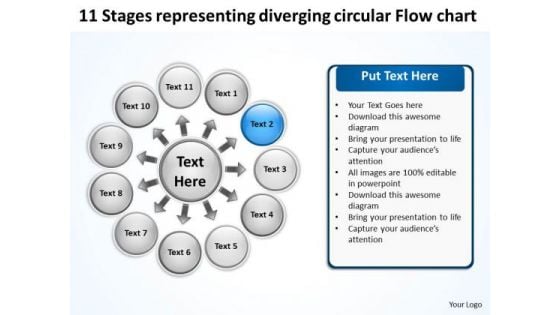
Representing Diverging Circular Flow Chart Process Diagram PowerPoint Templates
We present our representing diverging circular flow chart Process Diagram PowerPoint templates.Use our Ring charts PowerPoint Templates because your group can behave steady in the top bracket. Present our Circle charts PowerPoint Templates because this diagram helps you to harness the opportunities, celebrate your performance till date and focus on greater growth and expansion in coming years. Present our Process and Flows PowerPoint Templates because this slide helps you to give your team an overview of your capability and insight into the minute details of the overall picture highlighting the interdependence at every operational level. Download our Business PowerPoint Templates because you can Flutter your wings and enchant the world. Impress them with the innate attractiveness of your thoughts and words. Download our Marketing PowerPoint Templates because this slide represents the tools of the trade.Use these PowerPoint slides for presentations relating to Button,cerulean, circle, circulation, cobalt,colorful, cyan, cycle, element,emblem, grayshadow, green,icon, indicator, interface, internet, label,link, load, marker, motion, movement,navigationpanel, next, orientation, pagsite, pink, pointer, previous, process, reload, rotation, satined, sign, signpost,smooth, sticker, sticky, symbol. The prominent colors used in the PowerPoint template are Blue, Black, White. Customers tell us our representing diverging circular flow chart Process Diagram PowerPoint templates are Precious. We assure you our cycle PowerPoint templates and PPT Slides are Breathtaking. PowerPoint presentation experts tell us our representing diverging circular flow chart Process Diagram PowerPoint templates are Stunning. People tell us our circulation PowerPoint templates and PPT Slides are Tasteful. We assure you our representing diverging circular flow chart Process Diagram PowerPoint templates are Lush. Use our cyan PowerPoint templates and PPT Slides are Upbeat. Govern your team with our Representing Diverging Circular Flow Chart Process Diagram PowerPoint Templates. Download without worries with our money back guaranteee.
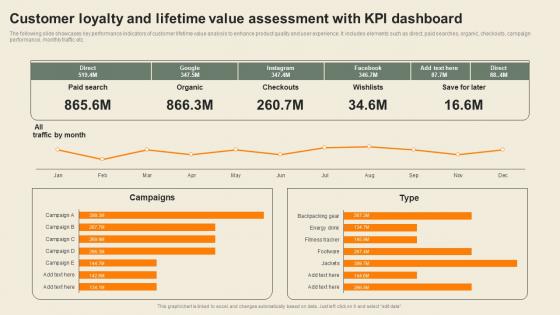
Customer Loyalty And Lifetime Value Usability Of CDP Software Tool Information Pdf
The following slide showcases key performance indicators of customer lifetime value analysis to enhance product quality and user experience. It includes elements such as direct, paid searches, organic, checkouts, campaign performance, monthly traffic etc. Are you in need of a template that can accommodate all of your creative concepts This one is crafted professionally and can be altered to fit any style. Use it with Google Slides or PowerPoint. Include striking photographs, symbols, depictions, and other visuals. Fill, move around, or remove text boxes as desired. Test out color palettes and font mixtures. Edit and save your work, or work with colleagues. Download Customer Loyalty And Lifetime Value Usability Of CDP Software Tool Information Pdf and observe how to make your presentation outstanding. Give an impeccable presentation to your group and make your presentation unforgettable. The following slide showcases key performance indicators of customer lifetime value analysis to enhance product quality and user experience. It includes elements such as direct, paid searches, organic, checkouts, campaign performance, monthly traffic etc.
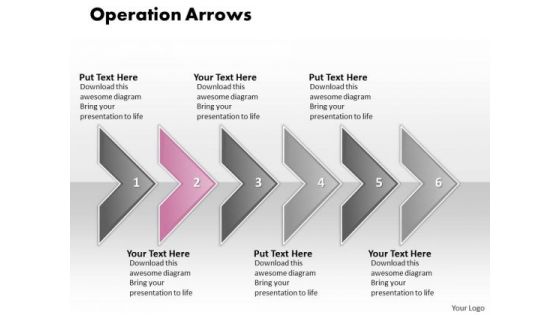
Ppt Operation Of 6 Concepts Through Shapes Arrows PowerPoint Templates
PPT operation of 6 concepts through shapes arrows powerpoint Templates-Develop competitive advantage with our above template which contains a arrow diagram. This can be used to build for presenting different ways for a single process. This power point diagram consists of 6 arrows. Continuous and ongoing process can be shown using this PPT Template.-PPT operation of 6 concepts through shapes arrows powerpoint Templates-Aim, Arrow, Badge, Border, Color, Connection, Curve, Design, Direction, Download, Icon, Illustration, Indicator, Internet, Label, Link, Magenta, Mark, Next, Object, Orientation, Paper, Peeling, Pointer, Rounded, Set, Shadow, Shape, Sign Throw a curveballwith our Ppt Operation Of 6 Concepts Through Shapes Arrows PowerPoint Templates. You'll deliver your best presentation yet.
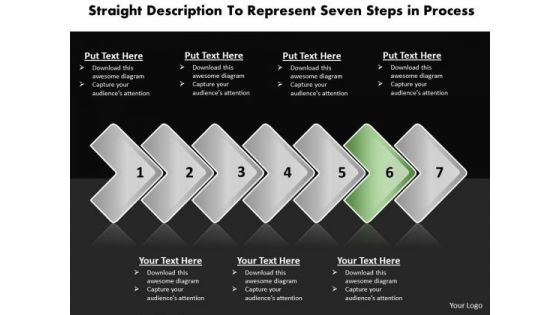
Ppt Straight Explanation To Represent Seven Steps In Process PowerPoint Templates
PPT straight explanation to represent seven steps in process PowerPoint Templates-Develop competitive advantage with our above Diagram which contains a diagram of horizontal arrows. These arrows are indicators of the path you have in mind. Use them to help you organize the logic of your views-PPT straight explanation to represent seven steps in process PowerPoint Templates-above, aiming, arrow, arrowhead, balance, communicate, communication, connection, descriptive, design, designer, direct, direction, dynamic, element, graphic, high, icon, illustration, inform, internet, journey, multimedia, pointer, reflection, set, shape, sign, signal, straight, symbol, top, transportation, travel, vector You possess enterprising ideas. Display them with courage on our Ppt Straight Explanation To Represent Seven Steps In Process PowerPoint Templates.
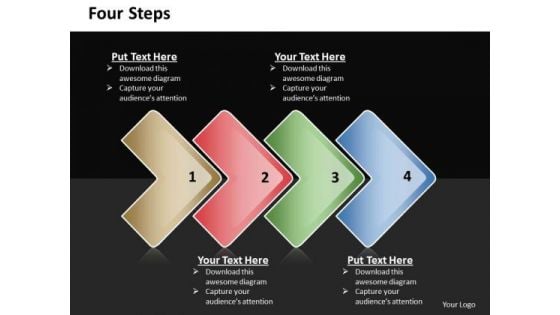
Ppt Direct Description Of 4 Steps Included Procedure PowerPoint Templates
PPT direct description of 4 steps included procedure PowerPoint Templates-Develop competitive advantage with our above template which contains a diagram of pointed arrows. It helps expound on the logic of your detailed thought process to take your company forward. Break it all down to Key Result Areas. Motivate your team to cross all barriers-PPT direct description of 4 steps included procedure PowerPoint Templates-Aim, Arrow, Arrowheads, Badge, Border, Click, Connection, Curve, Design, Direction, Download, Element, Fuchsia, Icon, Illustration, Indicator, Internet, Magenta, Mark, Object, Orientation, Pointer, Shadow, Shape, Sign Our Ppt Direct Description Of 4 Steps Included Procedure PowerPoint Templates are arguably exceptional. Your ideas will be hard to argue against.
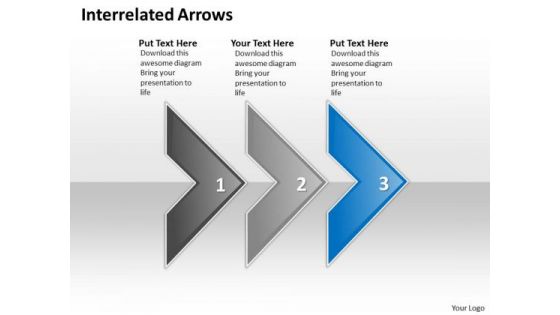
Ppt Interrelated Arrows Three Stages Fashion Design PowerPoint Presentation Templates
PPT interrelated arrows three stages fashion design powerpoint presentation Templates-Aesthetically designed to make a great first impression this template highlights three stages Involved in development process. This PPT image is so perfectly designed to illustrate your ability.-PPT interrelated arrows three stages fashion design powerpoint presentation Templates-Aim, Arrow, Arrowheads, Badge, Border, Click, Connection, Curve, Design, Direction, Download, Element, Fuchsia, Icon, Illustration, Indicator, Internet, Magenta, Mark, Object, Orientation, Pointer, Shadow, Shape, Sign Ecology is a common concern. Express your beliefs with our Ppt Interrelated Arrows Three Stages Fashion Design PowerPoint Presentation Templates.
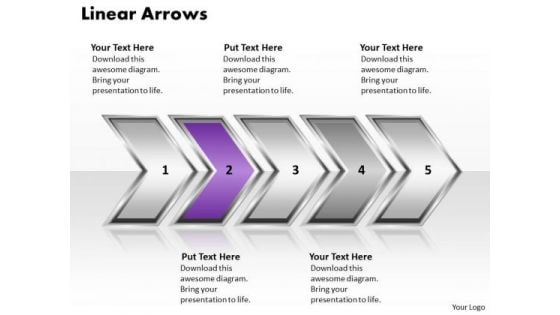
Ppt Linear Demonstration Of Arrows Diagram PowerPoint Slide Text Templates
PPT linear demonstration of arrows diagram powerpoint slide text Templates-This disarm can be used to organize information so that it can be accessed more easily. Pin-point the manner and processes for your team to follow an order. Step by step develop the entire picture and project it onto their minds-PPT linear demonstration of arrows diagram powerpoint slide text Templates-Aim, Arrow, Arrowheads, Badge, Border, Click, Connection, Curve, Design, Direction, Download, Element, Fuchsia, Icon, Illustration, Indicator, Internet, Magenta, Mark, Object, Orientation, Pointer, Shadow, Shape, Sign Search everywhere but find it here. Our Ppt Linear Demonstration Of Arrows Diagram PowerPoint Slide Text Templates catalogue will have it right there.
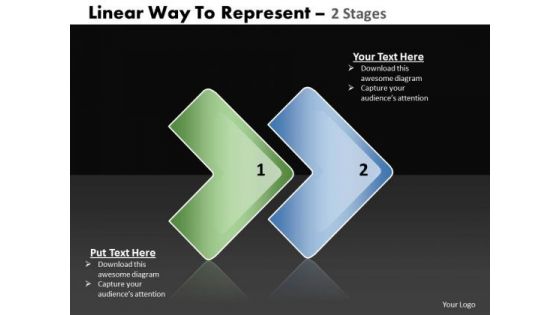
Ppt Linear Way To Show 2 Stages PowerPoint Templates
PPT linear way to show 2 stages PowerPoint Templates-Aesthetically designed to make a great first impression this template highlights two steps Involved in development process. This PPT image is so perfectly designed to illustrate your ability.-PPT linear way to show 2 stages PowerPoint Templates-Aim, Arrow, Arrowheads, Badge, Border, Click, Connection, Curve, Design, Direction, Download, Element, Fuchsia, Icon, Illustration, Indicator, Internet, Magenta, Mark, Object, Orientation, Pointer, Shadow, Shape, Sign Do not leave it all up to fate. Fashion your destiny with our Ppt Linear Way To Show 2 Stages PowerPoint Templates.
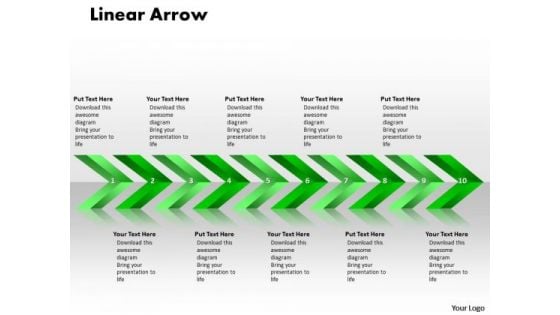
Business Ppt Background Linear Arrows 10 Stages Communication PowerPoint Image
Business PPT Background linear arrows 10 stages communication powerpoint Image-This linear arrow diagram provides a systematic approach to business development process.Strengthen your relationship with your present customers and likely future ones as the occasion has an intrinsic business potential.-Business PPT Background linear arrows 10 stages communication powerpoint Image-Aim, Angle, Arrow, Arrowheads, Badge, Banner, Connection, Curve, Design, Direction, Download, Element, Fuchsia, Icon, Illustration, Indicator, Internet, Label, Link, Magenta, Mark, Marker, Next, Object, Orange, Orientation, Pointer, Shadow, Shape, Signs Symbol Correct the errant with our Business Ppt Background Linear Arrows 10 Stages Communication PowerPoint Image. They will willingly accept your advice.
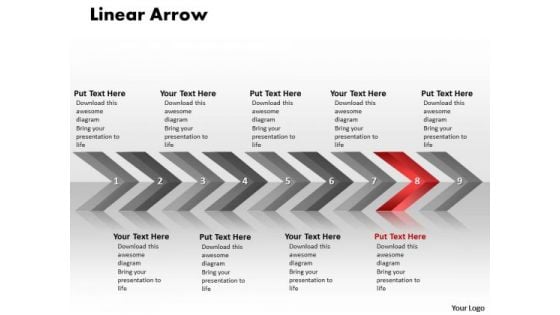
Editable Ppt Theme Linear Arrows 9 States Diagram Project Management PowerPoint Image
editable PPT Theme linear arrows 9 states diagram project management powerpoint Image-This diagram is a simple mapping tool that shows the sequence of actions within a process. Use this diagram to develop the teams vision of where they need to be in the future.-editable PPT Theme linear arrows 9 states diagram project management powerpoint Image-Aim, Angle, Arrow, Arrowheads, Badge, Banner, Connection, Curve, Design, Direction, Download, Element, Fuchsia, Icon, Illustration, Indicator, Internet, Label, Link, Magenta, Mark, Marker, Next, Object, Orange, Orientation, Pointer, Shadow, Shape, Signs Symbol Break out of the cocoon with our Editable Ppt Theme Linear Arrows 9 States Diagram Project Management PowerPoint Image. Let your thoughts take to the air.
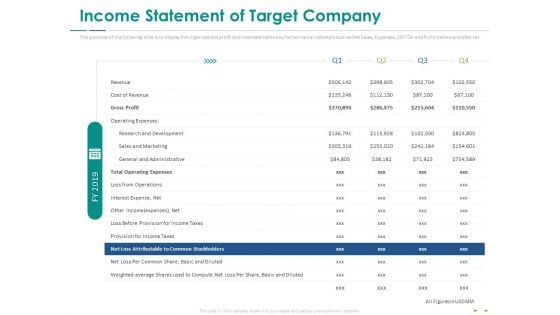
Stock Market Research Report Income Statement Of Target Company Background PDF
The purpose of the following slide is to display the organizations profit and loss statements Key Performance Indicators such as Net Sales, Expenses, EBITDA and Profit before and after tax. Deliver and pitch your topic in the best possible manner with this stock market research report income statement of target company background pdf. Use them to share invaluable insights on revenue, gross profit, operating expenses, research and development, sales and marketing and impress your audience. This template can be altered and modified as per your expectations. So, grab it now.

SWOT Analysis Of SW Care Pharmaceutical Company Weaknesses Formats PDF
This slide shows the weaknesses of SW Care Pharmaceutical Company that it must overcome such as limited drug indication, inefficient financial planning , limited investment in Research and Development, rigid organizational structure etc. Presenting swot analysis of sw care pharmaceutical company weaknesses formats pdf to provide visual cues and insights. Share and navigate important information on four stages that need your due attention. This template can be used to pitch topics like swot analysis of sw care pharmaceutical company weaknesses. In addtion, this PPT design contains high resolution images, graphics, etc, that are easily editable and available for immediate download.
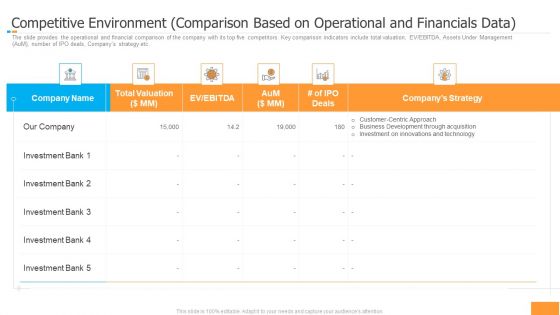
Funding Pitch Book Outline Competitive Environment Comparison Based On Operational And Financials Data Portrait PDF
The slide provides the operational and financial comparison of the company with its top five competitors. Key comparison indicators include total valuation, EV or EBITDA, Assets Under Management AuM, number of IPO deals, Companys strategy etc. Deliver an awe inspiring pitch with this creative funding pitch book outline competitive environment comparison based on operational and financials data portrait pdf bundle. Topics like investment, business, development, technology, innovations can be discussed with this completely editable template. It is available for immediate download depending on the needs and requirements of the user.
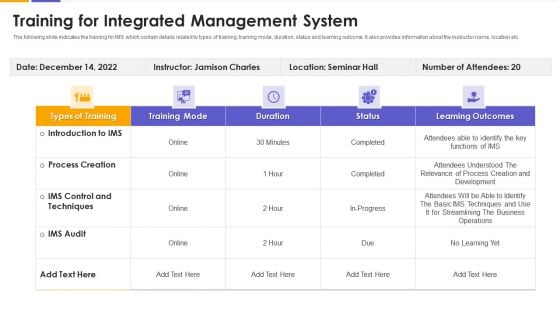
Training For Integrated Management System Background PDF
The following slide indicates the training for IMS which contain details related to types of training, training mode, duration, status and learning outcome. It also provides information about the instructor name, location etc. Pitch your topic with ease and precision using this training for integrated management system background pdf. This layout presents information on techniques, process creation, development. It is also available for immediate download and adjustment. So, changes can be made in the color, design, graphics or any other component to create a unique layout.
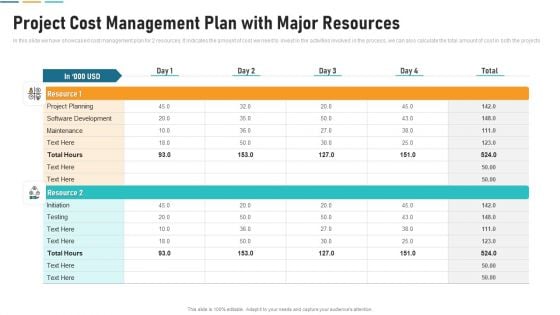
Project Cost Management Plan With Major Resources Introduction PDF
In this slide we have showcased cost management plan for 2 resources. It indicates the amount of cost we need to invest in the activities involved in the process, we can also calculate the total amount of cost in both the projects. Showcasing this set of slides titled project cost management plan with major resources introduction pdf. The topics addressed in these templates are project planning, software development, maintenance. All the content presented in this PPT design is completely editable. Download it and make adjustments in color, background, font etc. as per your unique business setting.
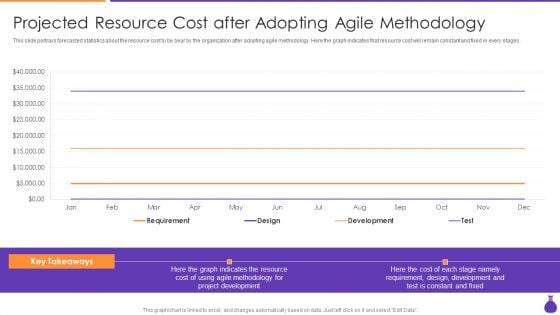
Why Is Agile Cost Effective IT Projected Resource Cost After Adopting Agile Methodology Brochure PDF
This slide portrays forecasted statistics about the resource cost to be bear by the organization after adopting agile methodology. Here the graph indicates that resource cost will remain constant and fixed in every stages. Deliver and pitch your topic in the best possible manner with this Why Is Agile Cost Effective IT Projected Resource Cost After Adopting Agile Methodology Brochure PDF. Use them to share invaluable insights on Requirement, Development, Test, Designs and impress your audience. This template can be altered and modified as per your expectations. So, grab it now.
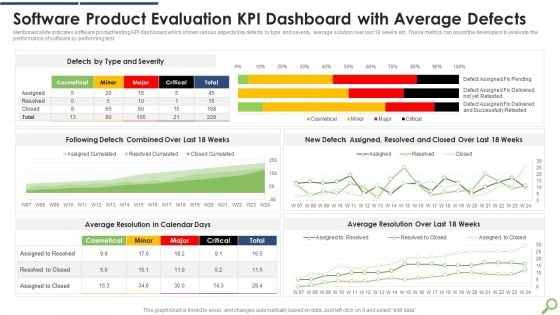
Software Product Evaluation KPI Dashboard With Average Defects Infographics PDF
Mentioned slide indicates software product testing KPI dashboard which shows various aspects like defects by type and severity, average solution over last 18 weeks etc. These metrics can assist the developers to evaluate the performance of software by performing test.Showcasing this set of slides titled Software Product Evaluation KPI Dashboard With Average Defects Infographics PDF The topics addressed in these templates are Software Product, Evaluation Dashboard, Average Defects All the content presented in this PPT design is completely editable. Download it and make adjustments in color, background, font etc. as per your unique business setting.
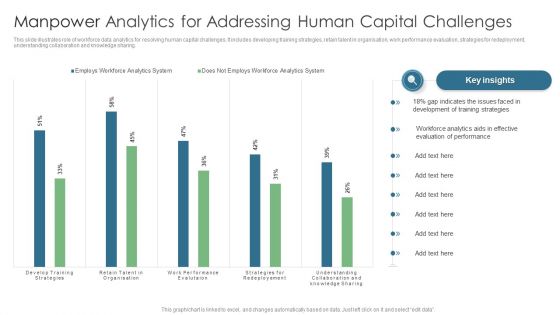
Manpower Analytics For Addressing Human Capital Challenges Diagrams PDF
This slide illustrates role of workforce data analytics for resolving human capital challenges. It includes developing training strategies, retain talent in organisation, work performance evaluation, strategies for redeployment, understanding collaboration and knowledge sharing. Showcasing this set of slides titled Manpower Analytics For Addressing Human Capital Challenges Diagrams PDF. The topics addressed in these templates are Gap Indicates, Training Strategies, Evaluation Performance. All the content presented in this PPT design is completely editable. Download it and make adjustments in color, background, font etc. as per your unique business setting.
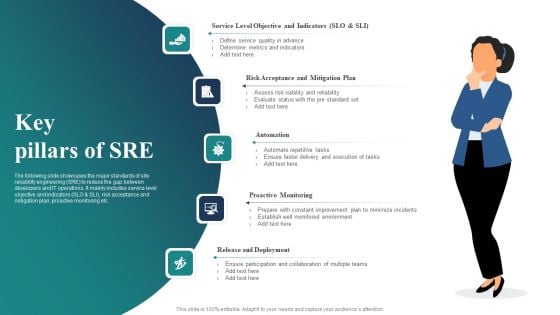
Key Pillars Of SRE Ppt PowerPoint Presentation Gallery Information PDF
The following slide showcases the major standards of site reliability engineering SRE to reduce the gap between developers and IT operations. It mainly includes service level objective and indicators SLO and SLI, risk acceptance and mitigation plan, proactive monitoring etc. Showcasing this set of slides titled Key Pillars Of SRE Ppt PowerPoint Presentation Gallery Information PDF. The topics addressed in these templates are Automation, Proactive Monitoring, Release And Deployment. All the content presented in this PPT design is completely editable. Download it and make adjustments in color, background, font etc. as per your unique business setting.
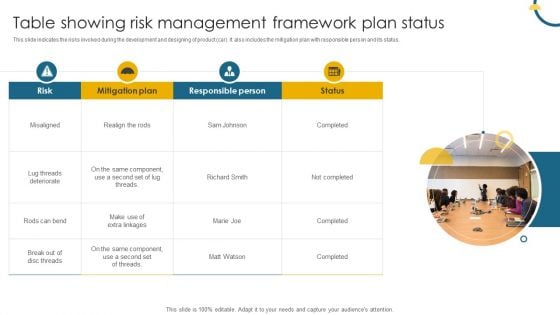
Table Showing Risk Management Framework Plan Status Download PDF
This slide indicates the risks involved during the development and designing of product car. It also includes the mitigation plan with responsible person and its status. Persuade your audience using this Table Showing Risk Management Framework Plan Status Download PDF. This PPT design covers four stages, thus making it a great tool to use. It also caters to a variety of topics including Mitigation Plan, Responsible Person, Risk. Download this PPT design now to present a convincing pitch that not only emphasizes the topic but also showcases your presentation skills.
KPIs And Metrics To Measure Pharmaceutical Drug Of Pharmaceutical Company Icons PDF
Mentioned slide showcases various key performance indicators KPIs which can be used to measure the development of pharmaceutical companies in different years. The key metrics are productivity, competency, quality of care and financial. Showcasing this set of slides titled KPIs And Metrics To Measure Pharmaceutical Drug Of Pharmaceutical Company Icons PDF. The topics addressed in these templates are Productivity, Competency, Quality Of Care. All the content presented in this PPT design is completely editable. Download it and make adjustments in color, background, font etc. as per your unique business setting.

Boutique Financing Hotel Property Business Analysis Dashboard Demonstration PDF
This slide shows dashboard with various indicators used to analyse hotel investment and development. It includes property information, acquisition details and KPIS such as EBITDA , interest, interest coverage ratio, REVPAR and yield. Showcasing this set of slides titled Boutique Financing Hotel Property Business Analysis Dashboard Demonstration PDF. The topics addressed in these templates are Property information, Acquisition information. All the content presented in this PPT design is completely editable. Download it and make adjustments in color, background, font etc. as per your unique business setting.
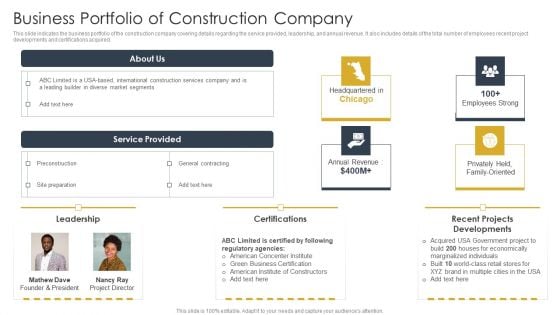
Business Portfolio Of Construction Company Construction Site Safety Plan Clipart Ideas PDF
This slide indicates the business portfolio of the construction company covering details regarding the service provided, leadership, and annual revenue. It also includes details of the total number of employees recent project developments and certifications acquired. If your project calls for a presentation, then Slidegeeks is your go-to partner because we have professionally designed, easy-to-edit templates that are perfect for any presentation. After downloading, you can easily edit Business Portfolio Of Construction Company Construction Site Safety Plan Clipart Ideas PDF and make the changes accordingly. You can rearrange slides or fill them with different images. Check out all the handy templates
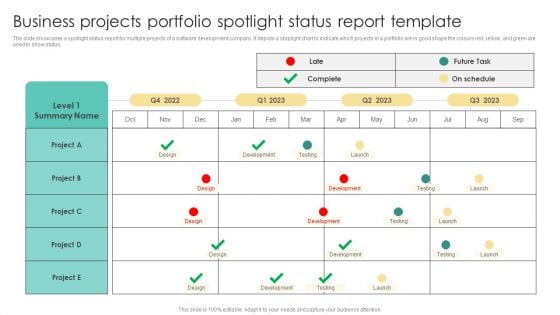
Business Projects Portfolio Spotlight Status Report Template Brochure PDF
The slide showcases a spotlight status report for multiple projects of a software development company. It depicts a stoplight chart to indicate which projects in a portfolio are in good shape the colours red, yellow, and green are used to show status. Showcasing this set of slides titled Business Projects Portfolio Spotlight Status Report Template Brochure PDF. The topics addressed in these templates are Business Projects Portfolio, Spotlight Status, Report Template. All the content presented in this PPT design is completely editable. Download it and make adjustments in color, background, font etc. as per your unique business setting.
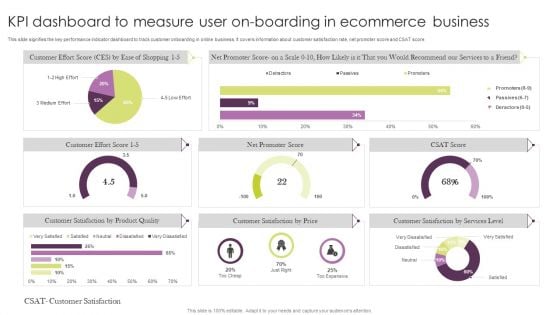
KPI Dashboard To Measure User On Boarding In Ecommerce Business Microsoft PDF
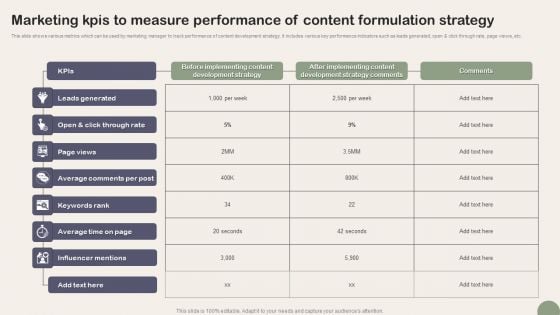
Marketing Kpis To Measure Performance Of Content Formulation Strategy Download PDF
This slide shows various metrics which can be used by marketing manager to track performance of content development strategy. It includes various key performance indicators such as leads generated, open and click through rate, page views, etc. Showcasing this set of slides titled Marketing Kpis To Measure Performance Of Content Formulation Strategy Download PDF. The topics addressed in these templates are Leads Generated, Page Views, Average Comments Per Post. All the content presented in this PPT design is completely editable. Download it and make adjustments in color, background, font etc. as per your unique business setting.

Vendor Performance Analysis And Administration Key Steps Of Supplier Evaluation Process Structure PDF
The following slide showcases various steps for evaluating vendor performance to streamline business operations and optimize costs. It includes steps such as identify performance indicators, develop an evaluation ranking, identify appropriate methods, determine deficiencies, optimize weak links and conduct routine evaluation. There are so many reasons you need a Vendor Performance Analysis And Administration Key Steps Of Supplier Evaluation Process Structure PDF. The first reason is you cannot spend time making everything from scratch, Thus, Slidegeeks has made presentation templates for you too. You can easily download these templates from our website easily.
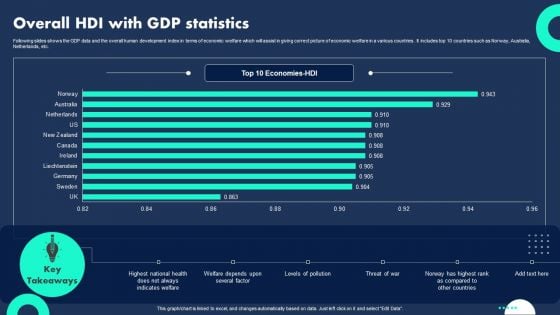
Overall HDI With Gdp Statistics Professional PDF
Following slides shows the GDP data and the overall human development index in terms of economic welfare which will assist in giving correct picture of economic welfare in a various countries . It includes top 10 countries such as Norway, Australia, Netherlands, etc. Showcasing this set of slides titled Overall HDI With Gdp Statistics Professional PDF. The topics addressed in these templates are Indicates Welfare, Welfare Depends, Levels Pollution. All the content presented in this PPT design is completely editable. Download it and make adjustments in color, background, font etc. as per your unique business setting.
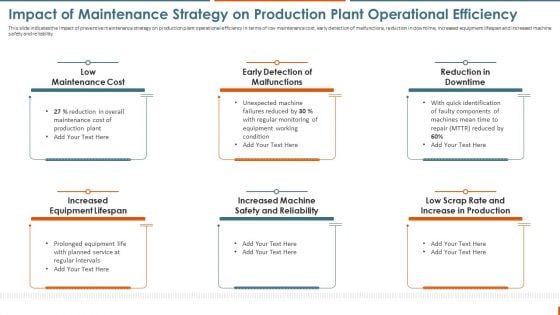
Maintenance Administration Impact Of Maintenance Strategy On Production Topics PDF
This slide indicates the impact of preventive maintenance strategy on production plant operational efficiency in terms of low maintenance cost, early detection of malfunctions, reduction in downtime, increased equipment lifespan and increased machine safety and reliability. Get a simple yet stunning designed Maintenance Administration Impact Of Maintenance Strategy On Production Topics PDF. It is the best one to establish the tone in your meetings. It is an excellent way to make your presentations highly effective. So, download this PPT today from Slidegeeks and see the positive impacts. Our easy-to-edit Maintenance Administration Impact Of Maintenance Strategy On Production Topics PDF can be your go-to option for all upcoming conferences and meetings. So, what are you waiting for Grab this template today.
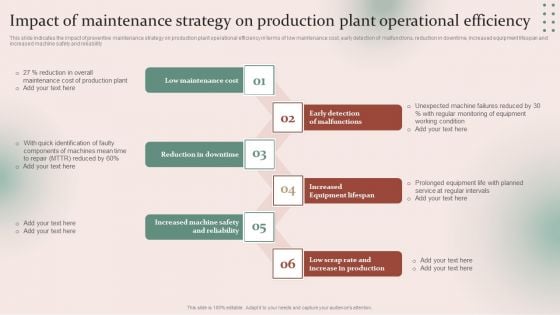
Strategies For Effective Manufacturing Impact Of Maintenance Strategy On Production Plant Rules PDF
This slide indicates the impact of preventive maintenance strategy on production plant operational efficiency in terms of low maintenance cost, early detection of malfunctions, reduction in downtime, increased equipment lifespan and increased machine safety and reliability. Take your projects to the next level with our ultimate collection of Strategies For Effective Manufacturing Impact Of Maintenance Strategy On Production Plant Rules PDF. Slidegeeks has designed a range of layouts that are perfect for representing task or activity duration, keeping track of all your deadlines at a glance. Tailor these designs to your exact needs and give them a truly corporate look with your own brand colors theyll make your projects stand out from the rest.
Machine Repairing And Servicing Impact Of Maintenance Strategy On Production Plant Icons PDF
This slide indicates the impact of preventive maintenance strategy on production plant operational efficiency in terms of low maintenance cost, early detection of malfunctions, reduction in downtime, increased equipment lifespan and increased machine safety and reliability. Do you have to make sure that everyone on your team knows about any specific topic I yes, then you should give Machine Repairing And Servicing Impact Of Maintenance Strategy On Production Plant Icons PDF a try. Our experts have put a lot of knowledge and effort into creating this impeccable Machine Repairing And Servicing Impact Of Maintenance Strategy On Production Plant Icons PDF. You can use this template for your upcoming presentations, as the slides are perfect to represent even the tiniest detail. You can download these templates from the Slidegeeks website and these are easy to edit. So grab these today.
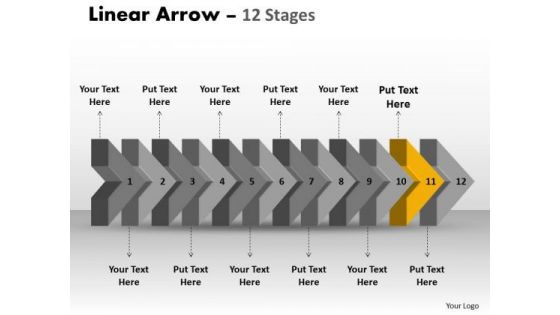
Ppt Theme 3d Illustration Of Straightaway Arrow Flow PowerPoint Diagram 12 Image
We present our PPT Theme 3d illustration of straightaway arrow flow PowerPoint diagram 12 Image. Use our Arrows PowerPoint Templates because, they enhance the essence of your viable ideas. Use our Symbol PowerPoint Templates because, the structure of our templates allows you to effectively highlight the key issues concerning the growth of your business. Use our Business PowerPoint Templates because, they pinpoint the core values of your organization. Use our Process and Flows PowerPoint Templates because, you understand the ailment and how to fight it. Use our Marketing PowerPoint Templates because; discuss each path to the smallest detail. Use these PowerPoint slides for presentations relating to Aim, Angle, Arrow, Arrowheads, Badge, Banner, Connection, Curve, Design, Direction, Download, Element, Fuchsia, Icon, Illustration, Indicator, Internet, Label, Link, Magenta, Mark, Marker, Next, Object, Orientation, Pointer, Shadow, Shape, Signs, Symbol. The prominent colors used in the PowerPoint template are Yellow, Gray, and Black Create the aroma with our Ppt Theme 3d Illustration Of Straightaway Arrow Flow PowerPoint Diagram 12 Image. Draw the crowds to your views.
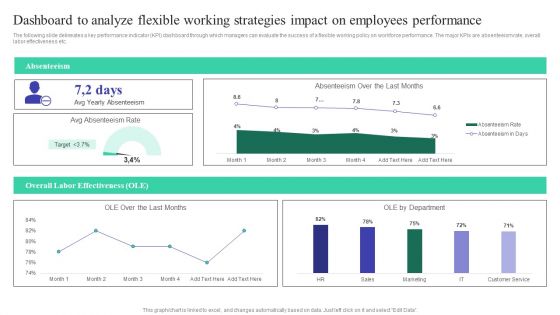
Dashboard To Analyze Flexible Working Strategies Impact On Employees Performance Professional PDF
The following slide delineates a key performance indicator KPI dashboard through which managers can evaluate the success of a flexible working policy on workforce performance. The major KPIs are absenteeism rate, overall labor effectiveness etc. If you are looking for a format to display your unique thoughts, then the professionally designed Dashboard To Analyze Flexible Working Strategies Impact On Employees Performance Professional PDF is the one for you. You can use it as a Google Slides template or a PowerPoint template. Incorporate impressive visuals, symbols, images, and other charts. Modify or reorganize the text boxes as you desire. Experiment with shade schemes and font pairings. Alter, share or cooperate with other people on your work. Download Dashboard To Analyze Flexible Working Strategies Impact On Employees Performance Professional PDF and find out how to give a successful presentation. Present a perfect display to your team and make your presentation unforgettable.
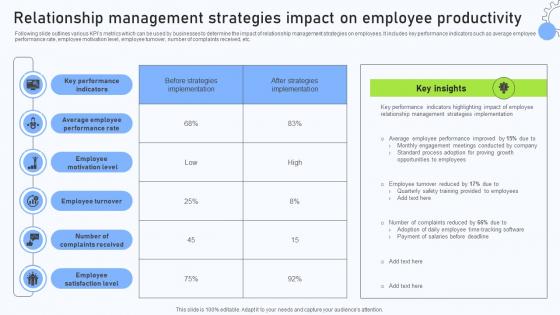
Relationship Management Strategies Impact On Employee Productivity
Following slide outlines various KPIs metrics which can be used by businesses to determine the impact of relationship management strategies on employees. It includes key performance indicators such as average employee performance rate, employee motivation level, employee turnover, number of complaints received, etc. If you are looking for a format to display your unique thoughts, then the professionally designed Relationship Management Strategies Impact On Employee Productivity is the one for you. You can use it as a Google Slides template or a PowerPoint template. Incorporate impressive visuals, symbols, images, and other charts. Modify or reorganize the text boxes as you desire. Experiment with shade schemes and font pairings. Alter, share or cooperate with other people on your work. Download Relationship Management Strategies Impact On Employee Productivity and find out how to give a successful presentation. Present a perfect display to your team and make your presentation unforgettable. Following slide outlines various KPIs metrics which can be used by businesses to determine the impact of relationship management strategies on employees. It includes key performance indicators such as average employee performance rate, employee motivation level, employee turnover, number of complaints received, etc.

Key Statistics Associated With Global E Commerce Smartphones Industry Report PPT Presentation IR SS V
The slide presents a comprehensive overview of the e commerce electronics market in order to give stakeholders useful information that will help them make strategic decisions. The statistics for the global markets are covered in the slide indicating the potential for any new business, product, or service. If you are looking for a format to display your unique thoughts, then the professionally designed Key Statistics Associated With Global E Commerce Smartphones Industry Report PPT Presentation IR SS V is the one for you. You can use it as a Google Slides template or a PowerPoint template. Incorporate impressive visuals, symbols, images, and other charts. Modify or reorganize the text boxes as you desire. Experiment with shade schemes and font pairings. Alter, share or cooperate with other people on your work. Download Key Statistics Associated With Global E Commerce Smartphones Industry Report PPT Presentation IR SS V and find out how to give a successful presentation. Present a perfect display to your team and make your presentation unforgettable. The slide presents a comprehensive overview of the e commerce electronics market in order to give stakeholders useful information that will help them make strategic decisions. The statistics for the global markets are covered in the slide indicating the potential for any new business, product, or service.
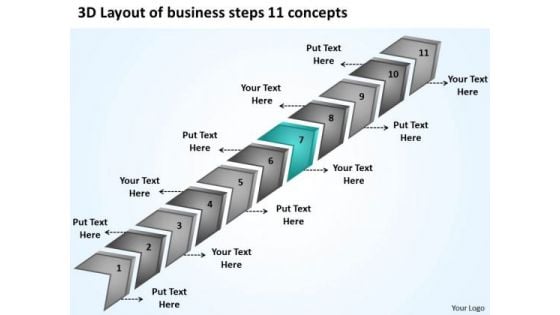
PowerPoint Templates Download Steps 11 Concepts Making Business Plan Slides
We present our powerpoint templates download steps 11 concepts making business plan Slides.Download and present our Business PowerPoint Templates because you have had a great year or so business wise. It is time to celebrate the efforts of your team. Use our Arrows PowerPoint Templates because spreading the light of knowledge around you will clear the doubts and enlighten the questioning minds with your brilliance and ability. Use our Shapes PowerPoint Templates because this diagram has the unique ability to drive home your ideas and show how they mesh to guarantee success. Use our Signs PowerPoint Templates because they are the indicators of the path you have in mind. Use our Process and Flows PowerPoint Templates because you can Bullet-point your thoughts and ideas to profitably accomplish every step of every stage along the way.Use these PowerPoint slides for presentations relating to Age, Ancient, Antique, Arrows, Art, Artistic, Background, Colorful, Colors, Contemporary, Decoration, Design, Dirt, Dynamic, Edge, Element, Frame, Future, Grunge, Illustration, Linear, Lines, Modern, Pattern, Place, Pointer, Poster, Texture, Vintage. The prominent colors used in the PowerPoint template are Green, Gray, Black. We assure you our powerpoint templates download steps 11 concepts making business plan Slides are Luxuriant. We assure you our Colorful PowerPoint templates and PPT Slides are Fun. Customers tell us our powerpoint templates download steps 11 concepts making business plan Slides are Stylish. Presenters tell us our Art PowerPoint templates and PPT Slides are Colorful. You can be sure our powerpoint templates download steps 11 concepts making business plan Slides are Efficient. The feedback we get is that our Arrows PowerPoint templates and PPT Slides are Second to none. Your ideas will never go out of fashion. Our PowerPoint Templates Download Steps 11 Concepts Making Business Plan Slides will keep them contemporary.
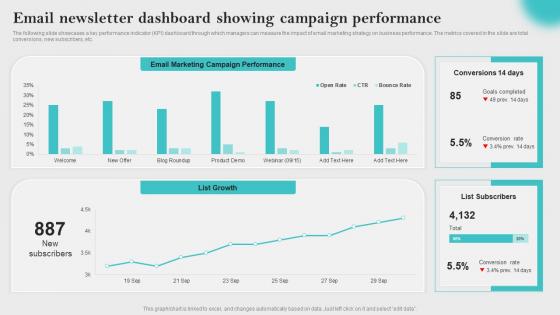
Email Newsletter Dashboard Innovative Business Promotion Ideas Sample Pdf
The following slide showcases a key performance indicator KPI dashboard through which managers can measure the impact of email marketing strategy on business performance. The metrics covered in the slide are total conversions, new subscribers, etc. Formulating a presentation can take up a lot of effort and time, so the content and message should always be the primary focus. The visuals of the PowerPoint can enhance the presenters message, so our Email Newsletter Dashboard Innovative Business Promotion Ideas Sample Pdf was created to help save time. Instead of worrying about the design, the presenter can concentrate on the message while our designers work on creating the ideal templates for whatever situation is needed. Slidegeeks has experts for everything from amazing designs to valuable content, we have put everything into Email Newsletter Dashboard Innovative Business Promotion Ideas Sample Pdf The following slide showcases a key performance indicator KPI dashboard through which managers can measure the impact of email marketing strategy on business performance. The metrics covered in the slide are total conversions, new subscribers, etc.
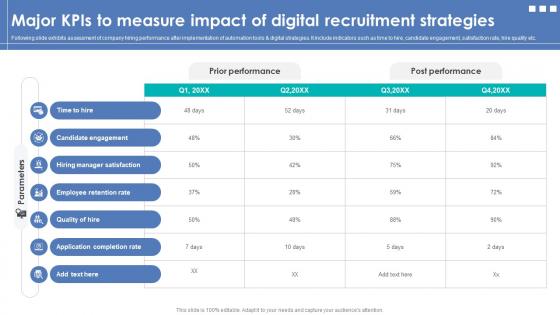
Integrating Automation For Effective Business Major Kpis To Measure Impact Of Digital Recruitment
Following slide exhibits assessment of company hiring performance after implementation of automation tools and digital strategies. It include indicators such as time to hire, candidate engagement, satisfaction rate, hire quality etc. Formulating a presentation can take up a lot of effort and time, so the content and message should always be the primary focus. The visuals of the PowerPoint can enhance the presenters message, so our Integrating Automation For Effective Business Major Kpis To Measure Impact Of Digital Recruitment was created to help save time. Instead of worrying about the design, the presenter can concentrate on the message while our designers work on creating the ideal templates for whatever situation is needed. Slidegeeks has experts for everything from amazing designs to valuable content, we have put everything into Integrating Automation For Effective Business Major Kpis To Measure Impact Of Digital Recruitment. Following slide exhibits assessment of company hiring performance after implementation of automation tools and digital strategies. It include indicators such as time to hire, candidate engagement, satisfaction rate, hire quality etc.
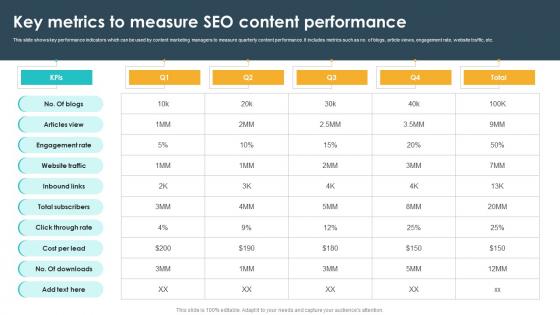
Key Metrics To Measure Seo Content Performance Seo Content Plan To Drive Strategy SS V
This slide shows key performance indicators which can be used by content marketing managers to measure quarterly content performance. It includes metrics such as no. of blogs, article views, engagement rate, website traffic, etc. Formulating a presentation can take up a lot of effort and time, so the content and message should always be the primary focus. The visuals of the PowerPoint can enhance the presenters message, so our Key Metrics To Measure Seo Content Performance Seo Content Plan To Drive Strategy SS V was created to help save time. Instead of worrying about the design, the presenter can concentrate on the message while our designers work on creating the ideal templates for whatever situation is needed. Slidegeeks has experts for everything from amazing designs to valuable content, we have put everything into Key Metrics To Measure Seo Content Performance Seo Content Plan To Drive Strategy SS V This slide shows key performance indicators which can be used by content marketing managers to measure quarterly content performance. It includes metrics such as no. of blogs, article views, engagement rate, website traffic, etc.

KPI Measuring After Implementing Restaurant Marketing Strategies Create An Effective Restaurant
The following slide showcases various key performance indicators KPIs through which marketers can evaluate the success of traditional marketing performance. The metrics mentioned in slide are customer acquisition cost CAC, cross-sells, referrals, sales per square foot, repeat purchase rate, foot traffic, average order value, etc. Formulating a presentation can take up a lot of effort and time, so the content and message should always be the primary focus. The visuals of the PowerPoint can enhance the presenters message, so our KPI Measuring After Implementing Restaurant Marketing Strategies Create An Effective Restaurant was created to help save time. Instead of worrying about the design, the presenter can concentrate on the message while our designers work on creating the ideal templates for whatever situation is needed. Slidegeeks has experts for everything from amazing designs to valuable content, we have put everything into KPI Measuring After Implementing Restaurant Marketing Strategies Create An Effective Restaurant. The following slide showcases various key performance indicators KPIs through which marketers can evaluate the success of traditional marketing performance. The metrics mentioned in slide are customer acquisition cost CAC, cross-sells, referrals, sales per square foot, repeat purchase rate, foot traffic, average order value, etc.
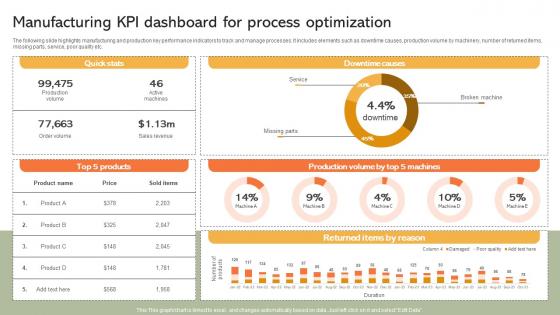
Manufacturing KPI Dashboard For Process Implementing Manufacturing Strategy SS V
The following slide highlights manufacturing and production key performance indicators to track and manage processes. It includes elements such as downtime causes, production volume by machinery, number of returned items, missing parts, service, poor quality etc. Formulating a presentation can take up a lot of effort and time, so the content and message should always be the primary focus. The visuals of the PowerPoint can enhance the presenters message, so our Manufacturing KPI Dashboard For Process Implementing Manufacturing Strategy SS V was created to help save time. Instead of worrying about the design, the presenter can concentrate on the message while our designers work on creating the ideal templates for whatever situation is needed. Slidegeeks has experts for everything from amazing designs to valuable content, we have put everything into Manufacturing KPI Dashboard For Process Implementing Manufacturing Strategy SS V The following slide highlights manufacturing and production key performance indicators to track and manage processes. It includes elements such as downtime causes, production volume by machinery, number of returned items, missing parts, service, poor quality etc.
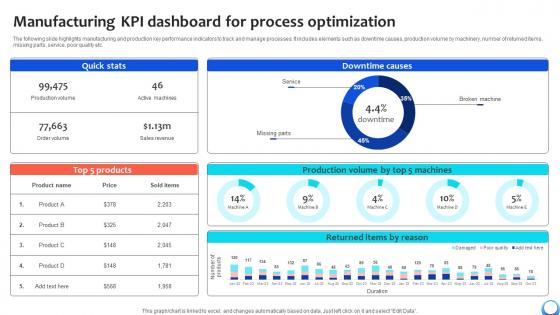
Manufacturing KPI Dashboard For Process Optimization Automating Production Process Strategy SS V
The following slide highlights manufacturing and production key performance indicators to track and manage processes. It includes elements such as downtime causes, production volume by machinery, number of returned items, missing parts, service, poor quality etc. Formulating a presentation can take up a lot of effort and time, so the content and message should always be the primary focus. The visuals of the PowerPoint can enhance the presenters message, so our Manufacturing KPI Dashboard For Process Optimization Automating Production Process Strategy SS V was created to help save time. Instead of worrying about the design, the presenter can concentrate on the message while our designers work on creating the ideal templates for whatever situation is needed. Slidegeeks has experts for everything from amazing designs to valuable content, we have put everything into Manufacturing KPI Dashboard For Process Optimization Automating Production Process Strategy SS V The following slide highlights manufacturing and production key performance indicators to track and manage processes. It includes elements such as downtime causes, production volume by machinery, number of returned items, missing parts, service, poor quality etc.
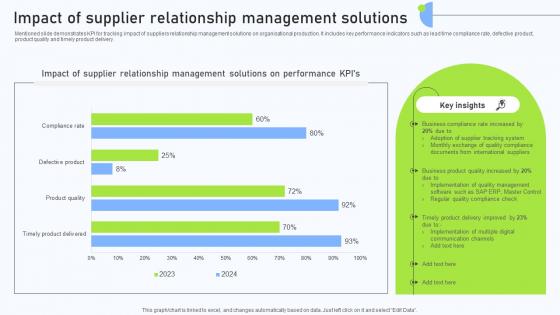
Relationship Management Automation Impact Of Supplier Relationship Management
Mentioned slide demonstrates KPI for tracking impact of suppliers relationship management solutions on organisational production. It includes key performance indicators such as lead time compliance rate, defective product, product quality and timely product delivery. Formulating a presentation can take up a lot of effort and time, so the content and message should always be the primary focus. The visuals of the PowerPoint can enhance the presenters message, so our Relationship Management Automation Impact Of Supplier Relationship Management was created to help save time. Instead of worrying about the design, the presenter can concentrate on the message while our designers work on creating the ideal templates for whatever situation is needed. Slidegeeks has experts for everything from amazing designs to valuable content, we have put everything into Relationship Management Automation Impact Of Supplier Relationship Management Mentioned slide demonstrates KPI for tracking impact of suppliers relationship management solutions on organisational production. It includes key performance indicators such as lead time compliance rate, defective product, product quality and timely product delivery.

Immersive Training For Practical Post Training Impact Of Simulation Training On Decision DTE SS V
This slide includes key performance indicators that the company has a positive impact on due to effective training programs such as team collaboration rate, error rate, etc. Formulating a presentation can take up a lot of effort and time, so the content and message should always be the primary focus. The visuals of the PowerPoint can enhance the presenters message, so our Immersive Training For Practical Post Training Impact Of Simulation Training On Decision DTE SS V was created to help save time. Instead of worrying about the design, the presenter can concentrate on the message while our designers work on creating the ideal templates for whatever situation is needed. Slidegeeks has experts for everything from amazing designs to valuable content, we have put everything into Immersive Training For Practical Post Training Impact Of Simulation Training On Decision DTE SS V. This slide includes key performance indicators that the company has a positive impact on due to effective training programs such as team collaboration rate, error rate, etc.
3d Linear Flow Navigation Arrow 2 Stages Ppt Working Chart PowerPoint Slides
We present our 3d linear flow navigation arrow 2 stages ppt working chart PowerPoint Slides. Use our Arrows PowerPoint Templates because; Highlight the key components of your entire manufacturing/ business process. Use our Symbol PowerPoint Templates because, guaranteed to focus the minds of your team. Use our Shapes PowerPoint Templates because, they are indicators of the path you have in mind. Use our Business PowerPoint Templates because, Shine the light on these thoughts and motivate your team to improve the quality of celebration for all around you. Use our Process and Flows PowerPoint Templates because, You sure have something unique, so use this template to expound on it and be rest assured that soon there will be an enthusiastic response and a purposeful Aye- Aye Sir. Use these PowerPoint slides for presentations relating to abstract, arrow, arrows business, chart, design, development, diagram, direction, element, flow, flowchart, graph, linear, management, model, motion, organization, plan, process, program, section, segment, set, sign, solution, strategy, symbol, technology. The prominent colors used in the PowerPoint template are Blue, Gray, and Black Escape from the humdrum with our 3d Linear Flow Navigation Arrow 2 Stages Ppt Working Chart PowerPoint Slides. Put in the element of excitement in your talk.
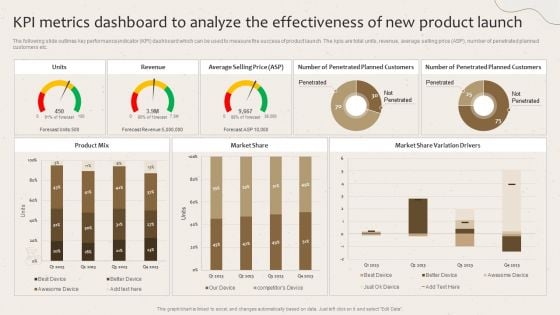
Kpi Metrics Dashboard To Analyze The Effectiveness Of New Product Launch Launching New Beverage Product Diagrams PDF
The following slide outlines key performance indicator KPI dashboard which can be used to measure the success of product launch. The kpis are total units, revenue, average selling price ASP, number of penetrated planned customers etc. Create an editable Kpi Metrics Dashboard To Analyze The Effectiveness Of New Product Launch Launching New Beverage Product Diagrams PDF that communicates your idea and engages your audience. Whether you are presenting a business or an educational presentation, pre-designed presentation templates help save time. Kpi Metrics Dashboard To Analyze The Effectiveness Of New Product Launch Launching New Beverage Product Diagrams PDF is highly customizable and very easy to edit, covering many different styles from creative to business presentations. Slidegeeks has creative team members who have crafted amazing templates. So, go and get them without any delay.
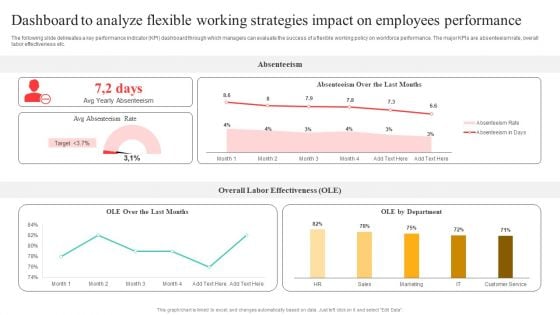
Flexible Working Policies And Guidelines Dashboard To Analyze Flexible Working Strategies Information PDF
The following slide delineates a key performance indicator KPI dashboard through which managers can evaluate the success of a flexible working policy on workforce performance. The major KPIs are absenteeism rate, overall labor effectiveness etc. Create an editable Flexible Working Policies And Guidelines Dashboard To Analyze Flexible Working Strategies Information PDF that communicates your idea and engages your audience. Whether youre presenting a business or an educational presentation, pre designed presentation templates help save time. Flexible Working Policies And Guidelines Dashboard To Analyze Flexible Working Strategies Information PDF is highly customizable and very easy to edit, covering many different styles from creative to business presentations. Slidegeeks has creative team members who have crafted amazing templates. So, go and get them without any delay.
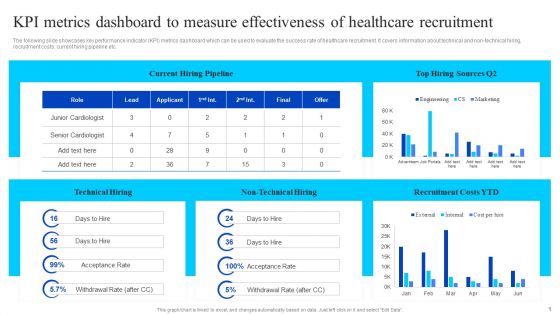
KPI Metrics Dashboard To Measure Effectiveness Of Healthcare Recruitment Microsoft PDF
The following slide showcases key performance indicator KPI metrics dashboard which can be used to evaluate the success rate of healthcare recruitment. It covers information about technical and non-technical hiring, recruitment costs, current hiring pipeline etc. Whether you have daily or monthly meetings, a brilliant presentation is necessary. KPI Metrics Dashboard To Measure Effectiveness Of Healthcare Recruitment Microsoft PDF can be your best option for delivering a presentation. Represent everything in detail using KPI Metrics Dashboard To Measure Effectiveness Of Healthcare Recruitment Microsoft PDF and make yourself stand out in meetings. The template is versatile and follows a structure that will cater to your requirements. All the templates prepared by Slidegeeks are easy to download and edit. Our research experts have taken care of the corporate themes as well. So, give it a try and see the results.
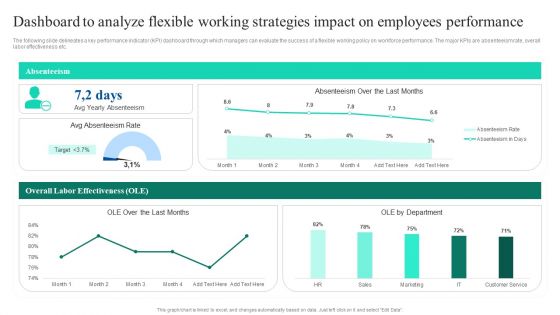
Adopting Flexible Work Policy Dashboard To Analyze Flexible Working Strategies Impact Template PDF
The following slide delineates a key performance indicator KPI dashboard through which managers can evaluate the success of a flexible working policy on workforce performance. The major KPIs are absenteeism rate, overall labor effectiveness etc. Do you have to make sure that everyone on your team knows about any specific topic I yes, then you should give Adopting Flexible Work Policy Dashboard To Analyze Flexible Working Strategies Impact Template PDF a try. Our experts have put a lot of knowledge and effort into creating this impeccable Adopting Flexible Work Policy Dashboard To Analyze Flexible Working Strategies Impact Template PDF. You can use this template for your upcoming presentations, as the slides are perfect to represent even the tiniest detail. You can download these templates from the Slidegeeks website and these are easy to edit. So grab these today.
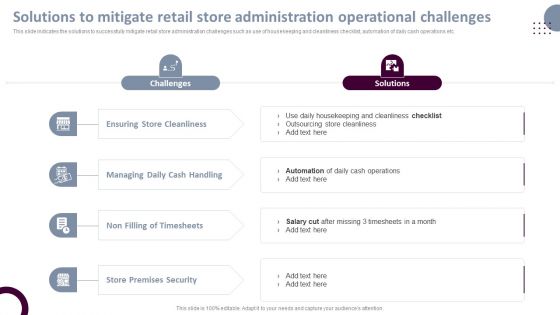
Retail Store Operations Solutions To Mitigate Retail Store Administration Elements PDF
This slide indicates the solutions to successfully mitigate retail store administration challenges such as use of housekeeping and cleanliness checklist, automation of daily cash operations etc. Explore a selection of the finest Retail Store Operations Solutions To Mitigate Retail Store Administration Elements PDF here. With a plethora of professionally designed and pre-made slide templates, you can quickly and easily find the right one for your upcoming presentation. You can use our Retail Store Operations Solutions To Mitigate Retail Store Administration Elements PDF to effectively convey your message to a wider audience. Slidegeeks has done a lot of research before preparing these presentation templates. The content can be personalized and the slides are highly editable. Grab templates today from Slidegeeks.
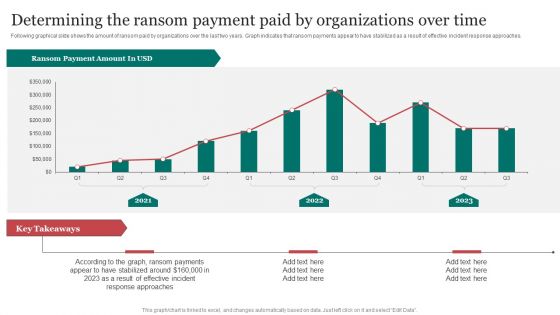
Determining The Ransom Payment Paid By Organizations Over Time Information PDF
Following graphical slide shows the amount of ransom paid by organizations over the last two years. Graph indicates that ransom payments appear to have stabilized as a result of effective incident response approaches.If you are looking for a format to display your unique thoughts, then the professionally designed Determining The Ransom Payment Paid By Organizations Over Time Information PDF is the one for you. You can use it as a Google Slides template or a PowerPoint template. Incorporate impressive visuals, symbols, images, and other charts. Modify or reorganize the text boxes as you desire. Experiment with shade schemes and font pairings. Alter, share or cooperate with other people on your work. Download Determining The Ransom Payment Paid By Organizations Over Time Information PDF and find out how to give a successful presentation. Present a perfect display to your team and make your presentation unforgettable.
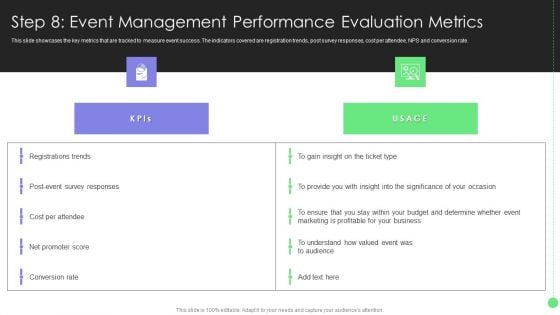
Comprehensive Guide For Launch Step 8 Event Management Performance Evaluation Formats PDF
This slide showcases the key metrics that are tracked to measure event success. The indicators covered are registration trends, post survey responses, cost per attendee, NPS and conversion rate. Get a simple yet stunning designed Comprehensive Guide For Launch Step 8 Event Management Performance Evaluation Formats PDF. It is the best one to establish the tone in your meetings. It is an excellent way to make your presentations highly effective. So, download this PPT today from Slidegeeks and see the positive impacts. Our easy-to-edit Comprehensive Guide For Launch Step 8 Event Management Performance Evaluation Formats PDFcan be your go-to option for all upcoming conferences and meetings. So, what are you waiting for Grab this template today.

Evaluating The Impact Of Marketing Strategies Market Share Topics PDF
The following slide outlines a comprehensive line chart indicating the market share of our company and the most successful competitor. Information covered in this slide is related to four quarters. Do you have to make sure that everyone on your team knows about any specific topic I yes, then you should give Evaluating The Impact Of Marketing Strategies Market Share Topics PDF a try. Our experts have put a lot of knowledge and effort into creating this impeccable Evaluating The Impact Of Marketing Strategies Market Share Topics PDF. You can use this template for your upcoming presentations, as the slides are perfect to represent even the tiniest detail. You can download these templates from the Slidegeeks website and these are easy to edit. So grab these today.
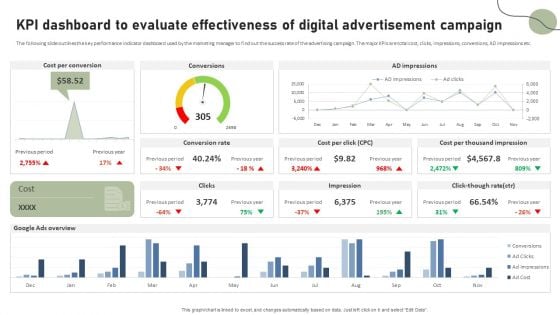
KPI Dashboard To Evaluate Effectiveness Of Digital Advertisement Campaign Pictures PDF
The following slide outlines the key performance indicator dashboard used by the marketing manager to find out the success rate of the advertising campaign. The major KPIs are total cost, clicks, impressions, conversions, AD impressions etc. Do you have to make sure that everyone on your team knows about any specific topic I yes, then you should give KPI Dashboard To Evaluate Effectiveness Of Digital Advertisement Campaign Pictures PDF a try. Our experts have put a lot of knowledge and effort into creating this impeccable KPI Dashboard To Evaluate Effectiveness Of Digital Advertisement Campaign Pictures PDF. You can use this template for your upcoming presentations, as the slides are perfect to represent even the tiniest detail. You can download these templates from the Slidegeeks website and these are easy to edit. So grab these today.
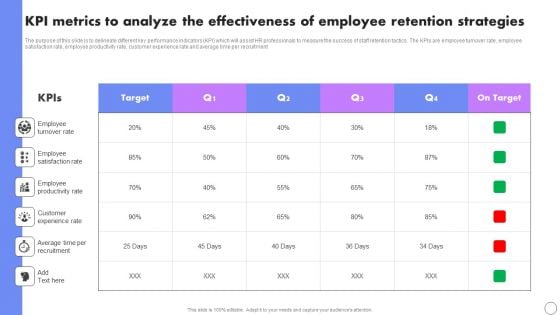
KPI Metrics To Analyze The Effectiveness Of Employee Retention Strategies Portrait PDF
The purpose of this slide is to delineate different key performance indicators KPI which will assist HR professionals to measure the success of staff retention tactics. The KPIs are employee turnover rate, employee satisfaction rate, employee productivity rate, customer experience rate and average time per recruitment Get a simple yet stunning designed KPI Metrics To Analyze The Effectiveness Of Employee Retention Strategies Portrait PDF. It is the best one to establish the tone in your meetings. It is an excellent way to make your presentations highly effective. So, download this PPT today from Slidegeeks and see the positive impacts. Our easy-to-edit KPI Metrics To Analyze The Effectiveness Of Employee Retention Strategies Portrait PDF can be your go-to option for all upcoming conferences and meetings. So, what are you waiting for Grab this template today.
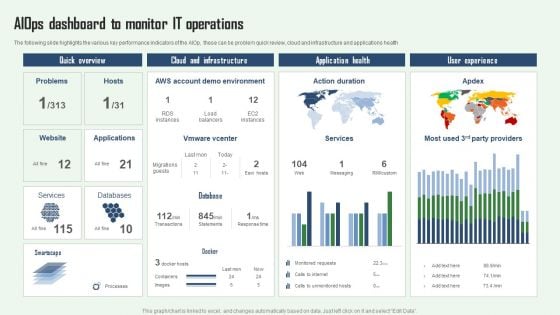
Aiops Dashboard To Monitor IT Operations Aiops Integration Summary Report Clipart PDF
The following slide highlights the various key performance indicators of the AIOp, these can be problem quick review, cloud and infrastructure and applications health. If you are looking for a format to display your unique thoughts, then the professionally designed Aiops Dashboard To Monitor IT Operations Aiops Integration Summary Report Clipart PDF is the one for you. You can use it as a Google Slides template or a PowerPoint template. Incorporate impressive visuals, symbols, images, and other charts. Modify or reorganize the text boxes as you desire. Experiment with shade schemes and font pairings. Alter, share or cooperate with other people on your work. Download Aiops Dashboard To Monitor IT Operations Aiops Integration Summary Report Clipart PDF and find out how to give a successful presentation. Present a perfect display to your team and make your presentation unforgettable.
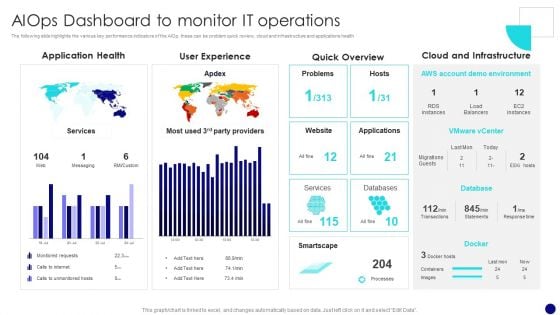
Information Technology Operations Administration With ML Aiops Dashboard To Monitor Diagrams PDF
The following slide highlights the various key performance indicators of the AIOp, these can be problem quick review, cloud and infrastructure and applications health. If you are looking for a format to display your unique thoughts, then the professionally designed Information Technology Operations Administration With ML Aiops Dashboard To Monitor Diagrams PDF is the one for you. You can use it as a Google Slides template or a PowerPoint template. Incorporate impressive visuals, symbols, images, and other charts. Modify or reorganize the text boxes as you desire. Experiment with shade schemes and font pairings. Alter, share or cooperate with other people on your work. Download Information Technology Operations Administration With ML Aiops Dashboard To Monitor Diagrams PDF and find out how to give a successful presentation. Present a perfect display to your team and make your presentation unforgettable.
Impact Of Customer Churn On Organization Performance Icons PDF
Mentioned slide outlines the impact of a higher attrition rate on the companys financial performance. It contains information about major financial key performance indicators KPIs such as monthly recurring revenue MRR, customer lifetime value CLV, and customer acquisition cost CAC. If you are looking for a format to display your unique thoughts, then the professionally designed Impact Of Customer Churn On Organization Performance Icons PDF is the one for you. You can use it as a Google Slides template or a PowerPoint template. Incorporate impressive visuals, symbols, images, and other charts. Modify or reorganize the text boxes as you desire. Experiment with shade schemes and font pairings. Alter, share or cooperate with other people on your work. Download Impact Of Customer Churn On Organization Performance Icons PDF and find out how to give a successful presentation. Present a perfect display to your team and make your presentation unforgettable.


 Continue with Email

 Home
Home


