Progress Meter

Operational Strategy For ML In IT Sector Aiops Dashboard To Monitor IT Operations Diagrams PDF
The following slide highlights the various key performance indicators of the AIOps, these can be problem quick review, cloud and infrastructure and applications health If you are looking for a format to display your unique thoughts, then the professionally designed Operational Strategy For ML In IT Sector Aiops Dashboard To Monitor IT Operations Diagrams PDF is the one for you. You can use it as a Google Slides template or a PowerPoint template. Incorporate impressive visuals, symbols, images, and other charts. Modify or reorganize the text boxes as you desire. Experiment with shade schemes and font pairings. Alter, share or cooperate with other people on your work. Download Operational Strategy For ML In IT Sector Aiops Dashboard To Monitor IT Operations Diagrams PDF and find out how to give a successful presentation. Present a perfect display to your team and make your presentation unforgettable.
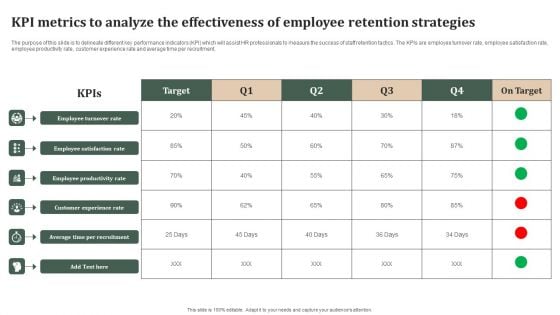
KPI Metrics To Analyze The Effectiveness Of Employee Retention Strategies Topics PDF
The purpose of this slide is to delineate different key performance indicators KPI which will assist HR professionals to measure the success of staff retention tactics. The KPIs are employee turnover rate, employee satisfaction rate, employee productivity rate, customer experience rate and average time per recruitment. Are you in need of a template that can accommodate all of your creative concepts This one is crafted professionally and can be altered to fit any style. Use it with Google Slides or PowerPoint. Include striking photographs, symbols, depictions, and other visuals. Fill, move around, or remove text boxes as desired. Test out color palettes and font mixtures. Edit and save your work, or work with colleagues. Download KPI Metrics To Analyze The Effectiveness Of Employee Retention Strategies Topics PDF and observe how to make your presentation outstanding. Give an impeccable presentation to your group and make your presentation unforgettable.
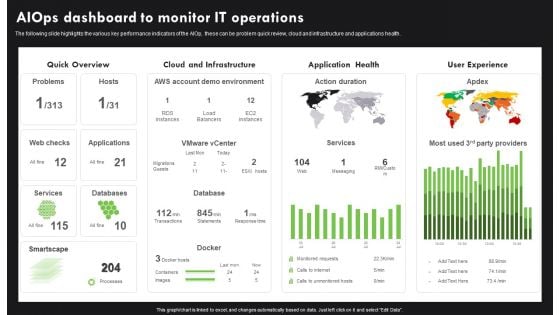
AI Deployment In IT Process Aiops Dashboard To Monitor IT Operations Infographics PDF
The following slide highlights the various key performance indicators of the AIOp, these can be problem quick review, cloud and infrastructure and applications health. If you are looking for a format to display your unique thoughts, then the professionally designed AI Deployment In IT Process Aiops Dashboard To Monitor IT Operations Infographics PDF is the one for you. You can use it as a Google Slides template or a PowerPoint template. Incorporate impressive visuals, symbols, images, and other charts. Modify or reorganize the text boxes as you desire. Experiment with shade schemes and font pairings. Alter, share or cooperate with other people on your work. Download AI Deployment In IT Process Aiops Dashboard To Monitor IT Operations Infographics PDF and find out how to give a successful presentation. Present a perfect display to your team and make your presentation unforgettable.
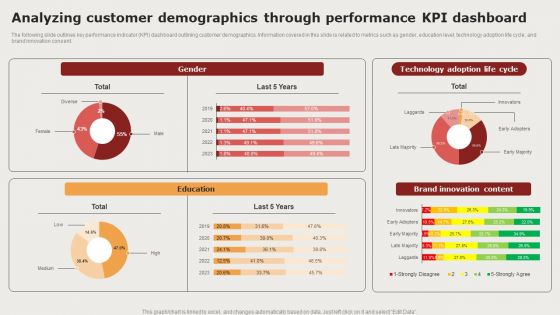
Creating Positioning Techniques For Market Research Analyzing Customer Demographics Through Performance Background PDF
The following slide outlines key performance indicator KPI dashboard outlining customer demographics. Information covered in this slide is related to metrics such as gender, education level, technology adoption life cycle, and brand innovation consent. If you are looking for a format to display your unique thoughts, then the professionally designed Creating Positioning Techniques For Market Research Analyzing Customer Demographics Through Performance Background PDF is the one for you. You can use it as a Google Slides template or a PowerPoint template. Incorporate impressive visuals, symbols, images, and other charts. Modify or reorganize the text boxes as you desire. Experiment with shade schemes and font pairings. Alter, share or cooperate with other people on your work. Download Creating Positioning Techniques For Market Research Analyzing Customer Demographics Through Performance Background PDF and find out how to give a successful presentation. Present a perfect display to your team and make your presentation unforgettable.
Digital Marketing Campaign Performance Tracking Kpis Ppt Infographic Template Information PDF
This slide shows the key performance indicators to measure the success or failure of the marketing campaign held by the organization. It includes metrics such as click through rate, conversion rate, return on marketing investment, revenue generated, total customer acquisition etc. Boost your pitch with our creative Digital Marketing Campaign Performance Tracking Kpis Ppt Infographic Template Information PDF. Deliver an awe-inspiring pitch that will mesmerize everyone. Using these presentation templates you will surely catch everyones attention. You can browse the ppts collection on our website. We have researchers who are experts at creating the right content for the templates. So you do not have to invest time in any additional work. Just grab the template now and use them.
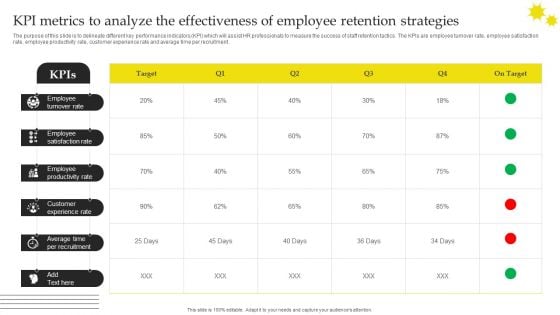
Effective Strategies For Retaining Healthcare Staff KPI Metrics To Analyze The Effectiveness Of Employee Inspiration PDF
The purpose of this slide is to delineate different key performance indicators KPI which will assist HR professionals to measure the success of staff retention tactics. The KPIs are employee turnover rate, employee satisfaction rate, employee productivity rate, customer experience rate and average time per recruitment . Explore a selection of the finest Effective Strategies For Retaining Healthcare Staff KPI Metrics To Analyze The Effectiveness Of Employee Inspiration PDF here. With a plethora of professionally designed and pre made slide templates, you can quickly and easily find the right one for your upcoming presentation. You can use our Effective Strategies For Retaining Healthcare Staff KPI Metrics To Analyze The Effectiveness Of Employee Inspiration PDF to effectively convey your message to a wider audience. Slidegeeks has done a lot of research before preparing these presentation templates. The content can be personalized and the slides are highly editable. Grab templates today from Slidegeeks.
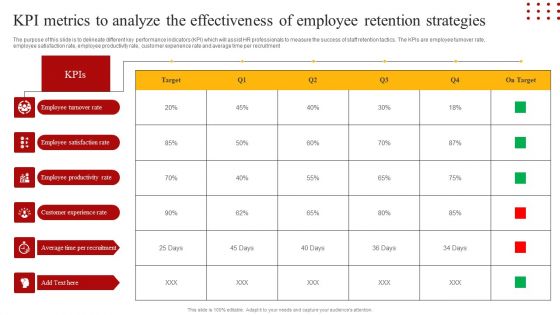
Staff Retention Techniques To Minimize Hiring Expenses KPI Metrics To Analyze The Effectiveness Of Employee Formats PDF
The purpose of this slide is to delineate different key performance indicators KPI which will assist HR professionals to measure the success of staff retention tactics. The KPIs are employee turnover rate, employee satisfaction rate, employee productivity rate, customer experience rate and average time per recruitment Get a simple yet stunning designed Staff Retention Techniques To Minimize Hiring Expenses KPI Metrics To Analyze The Effectiveness Of Employee Formats PDF. It is the best one to establish the tone in your meetings. It is an excellent way to make your presentations highly effective. So, download this PPT today from Slidegeeks and see the positive impacts. Our easy to edit Staff Retention Techniques To Minimize Hiring Expenses KPI Metrics To Analyze The Effectiveness Of Employee Formats PDF can be your go to option for all upcoming conferences and meetings. So, what are you waiting for Grab this template today.
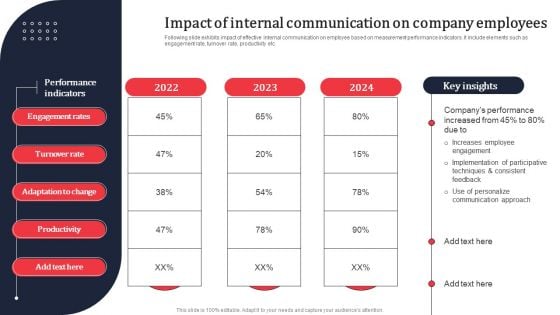
Impact Of Internal Communication On Company Employees Ppt PowerPoint Presentation File Example PDF
Following slide exhibits impact of effective internal communication on employee based on measurement performance indicators. It include elements such as engagement rate, turnover rate, productivity etc. If you are looking for a format to display your unique thoughts, then the professionally designed Impact Of Internal Communication On Company Employees Ppt PowerPoint Presentation File Example PDF is the one for you. You can use it as a Google Slides template or a PowerPoint template. Incorporate impressive visuals, symbols, images, and other charts. Modify or reorganize the text boxes as you desire. Experiment with shade schemes and font pairings. Alter, share or cooperate with other people on your work. Download Impact Of Internal Communication On Company Employees Ppt PowerPoint Presentation File Example PDF and find out how to give a successful presentation. Present a perfect display to your team and make your presentation unforgettable.
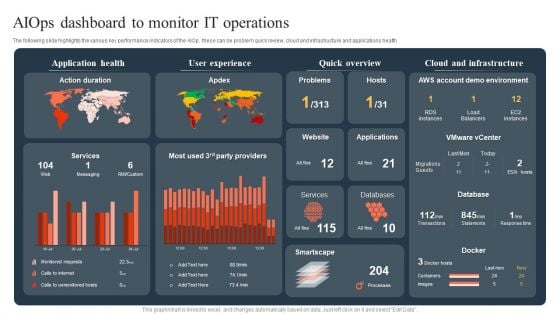
Ml And Big Data In Information Technology Processes Aiops Dashboard To Monitor IT Operations Sample PDF
The following slide highlights the various key performance indicators of the AIOp, these can be problem quick review, cloud and infrastructure and applications health If you are looking for a format to display your unique thoughts, then the professionally designed Ml And Big Data In Information Technology Processes Aiops Dashboard To Monitor IT Operations Sample PDF is the one for you. You can use it as a Google Slides template or a PowerPoint template. Incorporate impressive visuals, symbols, images, and other charts. Modify or reorganize the text boxes as you desire. Experiment with shade schemes and font pairings. Alter, share or cooperate with other people on your work. Download Ml And Big Data In Information Technology Processes Aiops Dashboard To Monitor IT Operations Sample PDF and find out how to give a successful presentation. Present a perfect display to your team and make your presentation unforgettable.
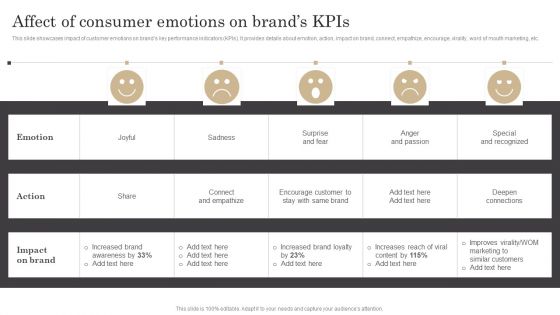
Affect Of Consumer Emotions On Brands Kpis Ppt Summary PDF
This slide showcases impact of customer emotions on brands key performance indicators KPIs. It provides details about emotion, action, impact on brand, connect, empathize, encourage, virality, word of mouth marketing, etc. If you are looking for a format to display your unique thoughts, then the professionally designed Affect Of Consumer Emotions On Brands Kpis Ppt Summary PDF is the one for you. You can use it as a Google Slides template or a PowerPoint template. Incorporate impressive visuals, symbols, images, and other charts. Modify or reorganize the text boxes as you desire. Experiment with shade schemes and font pairings. Alter, share or cooperate with other people on your work. Download Affect Of Consumer Emotions On Brands Kpis Ppt Summary PDF and find out how to give a successful presentation. Present a perfect display to your team and make your presentation unforgettable.
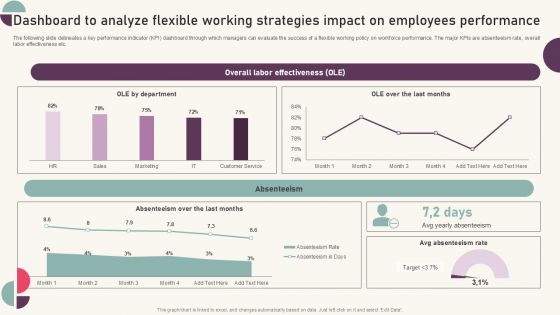
Tactics For Establishing Sustainable Hybrid Work Environment Dashboard To Analyze Flexible Working Strategies Topics PDF
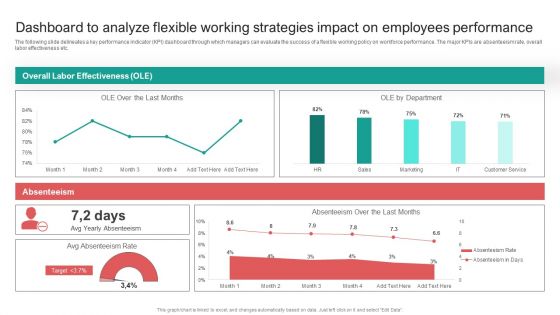
Dashboard To Analyze Flexible Working Strategies Impact On Employees Performance Infographics PDF
The following slide delineates a key performance indicator KPI dashboard through which managers can evaluate the success of a flexible working policy on workforce performance. The major KPIs are absenteeism rate, overall labor effectiveness etc. Presenting this PowerPoint presentation, titled Dashboard To Analyze Flexible Working Strategies Impact On Employees Performance Infographics PDF, with topics curated by our researchers after extensive research. This editable presentation is available for immediate download and provides attractive features when used. Download now and captivate your audience. Presenting this Dashboard To Analyze Flexible Working Strategies Impact On Employees Performance Infographics PDF. Our researchers have carefully researched and created these slides with all aspects taken into consideration. This is a completely customizable Dashboard To Analyze Flexible Working Strategies Impact On Employees Performance Infographics PDF that is available for immediate downloading. Download now and make an impact on your audience. Highlight the attractive features available with our PPTs.
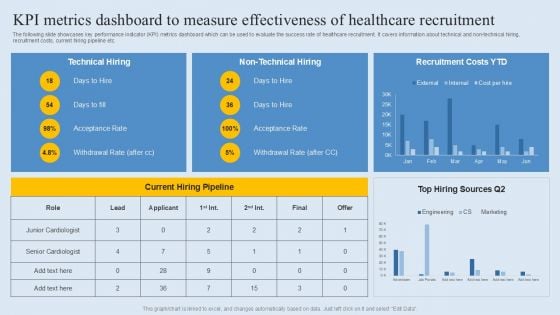
KPI Metrics Dashboard To Measure Effectiveness Of Healthcare Recruitment Demonstration PDF
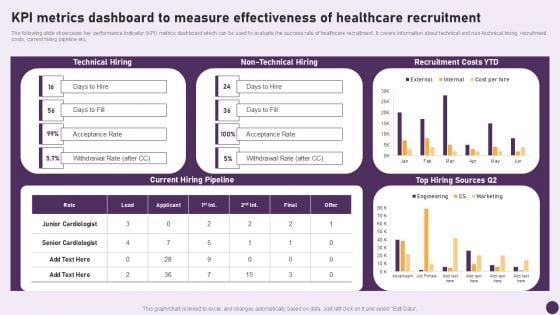
Guide To Healthcare Services Administration KPI Metrics Dashboard To Measure Effectiveness Healthcare Information PDF
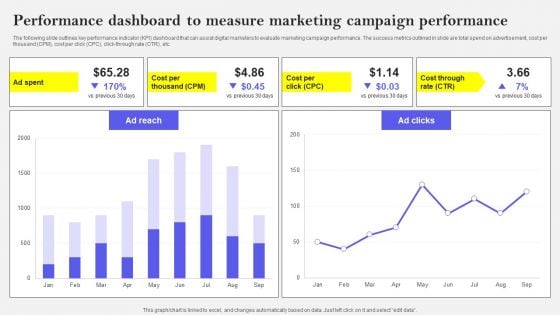
Performance Dashboard To Measure Marketing Campaign Performance Brochure PDF
The following slide outlines key performance indicator KPI dashboard that can assist digital marketers to evaluate marketing campaign performance. The success metrics outlined in slide are total spend on advertisement, cost per thousand CPM, cost per click CPC, click-through rate CTR, etc. Want to ace your presentation in front of a live audience Our Performance Dashboard To Measure Marketing Campaign Performance Brochure PDF can help you do that by engaging all the users towards you.. Slidegeeks experts have put their efforts and expertise into creating these impeccable powerpoint presentations so that you can communicate your ideas clearly. Moreover, all the templates are customizable, and easy-to-edit and downloadable. Use these for both personal and commercial use.
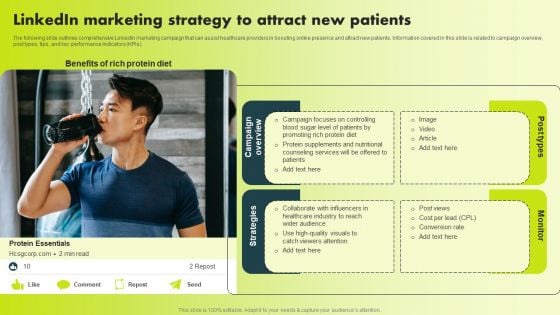
Linkedin Marketing Strategy To Attract New Patients Guidelines PDF
The following slide outlines comprehensive LinkedIn marketing campaign that can assist healthcare providers in boosting online presence and attract new patients. Information covered in this slide is related to campaign overview, post types, tips, and key performance indicators KPIs. If you are looking for a format to display your unique thoughts, then the professionally designed Linkedin Marketing Strategy To Attract New Patients Guidelines PDF is the one for you. You can use it as a Google Slides template or a PowerPoint template. Incorporate impressive visuals, symbols, images, and other charts. Modify or reorganize the text boxes as you desire. Experiment with shade schemes and font pairings. Alter, share or cooperate with other people on your work. Download Linkedin Marketing Strategy To Attract New Patients Guidelines PDF and find out how to give a successful presentation. Present a perfect display to your team and make your presentation unforgettable.

Dollars Falling In A Piggy Bank Finance PowerPoint Templates And PowerPoint Themes 1012
Dollars Falling In A Piggy Bank Finance PowerPoint Templates And PowerPoint Themes 1012-Use this Graphical PowerPoint Template showing Dollar Bills falling in Pink Piggy bank. It indicates Savings, investments, reserves, nest egg, funds, hoard, stash, money etc. Clear thinking is your strength. Transmit your thoughts to your eager team. Adjust the above image in your PPT presentations to visually support your content in your Investment PPT slideshows.-Dollars Falling In A Piggy Bank Finance PowerPoint Templates And PowerPoint Themes 1012-This PowerPoint template can be used for presentations relating to-Dollars falling in a piggy bank finance, symbol, money, finance, shapes, business Prepare your brigade with our Dollars Falling In A Piggy Bank Finance PowerPoint Templates And PowerPoint Themes 1012. Get them ready for the battle for success.
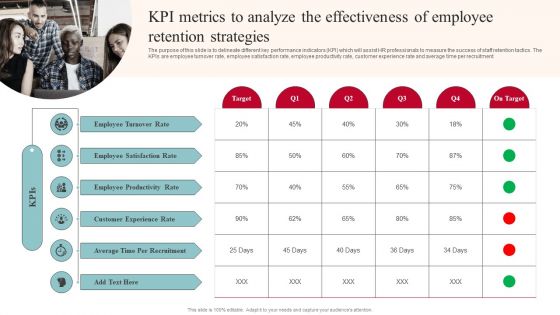
KPI Metrics To Analyze The Effectiveness Of Employee Retention Strategies Sample PDF
The purpose of this slide is to delineate different key performance indicators KPI which will assist HR professionals to measure the success of staff retention tactics. The KPIs are employee turnover rate, employee satisfaction rate, employee productivity rate, customer experience rate and average time per recruitment This KPI Metrics To Analyze The Effectiveness Of Employee Retention Strategies Sample PDF is perfect for any presentation, be it in front of clients or colleagues. It is a versatile and stylish solution for organizing your meetings. The KPI Metrics To Analyze The Effectiveness Of Employee Retention Strategies Sample PDF features a modern design for your presentation meetings. The adjustable and customizable slides provide unlimited possibilities for acing up your presentation. Slidegeeks has done all the homework before launching the product for you. So, do not wait, grab the presentation templates today
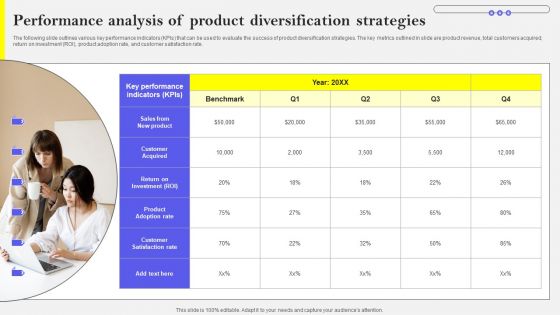
Performance Analysis Of Product Diversification Strategies Summary PDF
The following slide outlines various key performance indicators KPIs that can be used to evaluate the success of product diversification strategies. The key metrics outlined in slide are product revenue, total customers acquired, return on investment ROI, product adoption rate, and customer satisfaction rate. Slidegeeks is one of the best resources for PowerPoint templates. You can download easily and regulate Performance Analysis Of Product Diversification Strategies Summary PDF for your personal presentations from our wonderful collection. A few clicks is all it takes to discover and get the most relevant and appropriate templates. Use our Templates to add a unique zing and appeal to your presentation and meetings. All the slides are easy to edit and you can use them even for advertisement purposes.
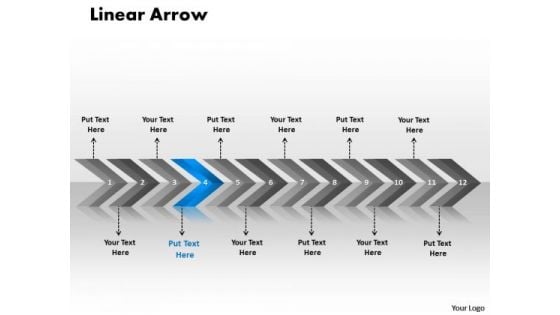
Business Ppt Linear Arrows 12 Power Point Stages Management PowerPoint 5 Image
Business PPT linear arrows 12 power point stages management powerpoint 5 Image-Use this diagram to arrange steps in such a manner that the preceding phase must be cleared before moving to next phase. Expound on better diagnostic processes for a more accurate analysis and control of the ailment to increase chances of a permanent cure.-Business PPT linear arrows 12 power point stages management powerpoint 5 Image-Aim, Angle, Arrow, Arrowheads, Badge, Banner, Connection, Curve, Design, Direction, Download, Element, Fuchsia, Icon, Illustration, Indicator, Internet, Label, Link, Magenta, Mark, Marker, Next, Object, Orange, Orientation, Pointer, Shadow, Shape, Signs Symbol Execute plans with our Business Ppt Linear Arrows 12 Power Point Stages Management PowerPoint 5 Image. Download without worries with our money back guaranteee.
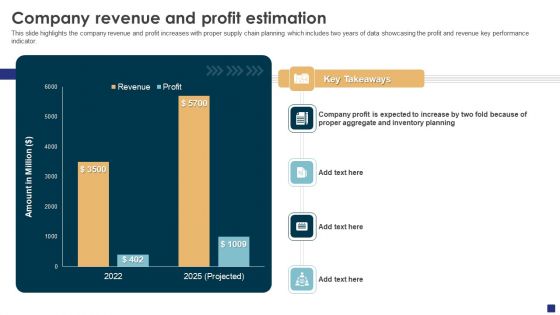
Comprehensive Guide To Ecommerce Company Revenue And Profit Estimation Topics PDF
This slide highlights the company revenue and profit increases with proper supply chain planning which includes two years of data showcasing the profit and revenue key performance indicator. Get a simple yet stunning designed Comprehensive Guide To Ecommerce Company Revenue And Profit Estimation Topics PDF. It is the best one to establish the tone in your meetings. It is an excellent way to make your presentations highly effective. So, download this PPT today from Slidegeeks and see the positive impacts. Our easy-to-edit Comprehensive Guide To Ecommerce Company Revenue And Profit Estimation Topics PDF can be your go-to option for all upcoming conferences and meetings. So, what are you waiting for Grab this template today.

Incident Response Techniques Deployement Impact Of Cybersecurity Incidents On Organization Clipart PDF
This slide represents the impact of events which indicates that organizations data has been compromised for unlawful activities. It includes impact of cyber security events such as increased costs, operational disruption, reputational damage etc. Do you have to make sure that everyone on your team knows about any specific topic I yes, then you should give Incident Response Techniques Deployement Cyber Security Incident Management Team Structure Diagrams PDF a try. Our experts have put a lot of knowledge and effort into creating this impeccable Incident Response Techniques Deployement Cyber Security Incident Management Team Structure Diagrams PDF. You can use this template for your upcoming presentations, as the slides are perfect to represent even the tiniest detail. You can download these templates from the Slidegeeks website and these are easy to edit. So grab these today.
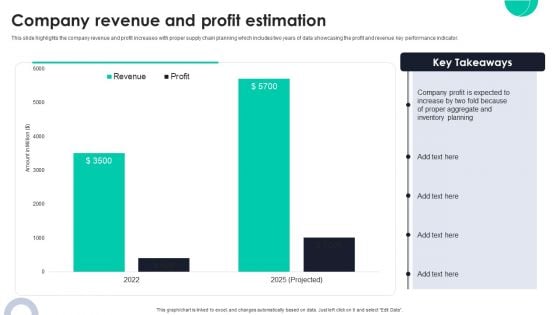
Company Revenue And Profit Estimation Ppt PowerPoint Presentation File Ideas PDF
This slide highlights the company revenue and profit increases with proper supply chain planning which includes two years of data showcasing the profit and revenue key performance indicator. Do you have to make sure that everyone on your team knows about any specific topic I yes, then you should give Company Revenue And Profit Estimation Ppt PowerPoint Presentation File Ideas PDF a try. Our experts have put a lot of knowledge and effort into creating this impeccable Company Revenue And Profit Estimation Ppt PowerPoint Presentation File Ideas PDF. You can use this template for your upcoming presentations, as the slides are perfect to represent even the tiniest detail. You can download these templates from the Slidegeeks website and these are easy to edit. So grab these today.
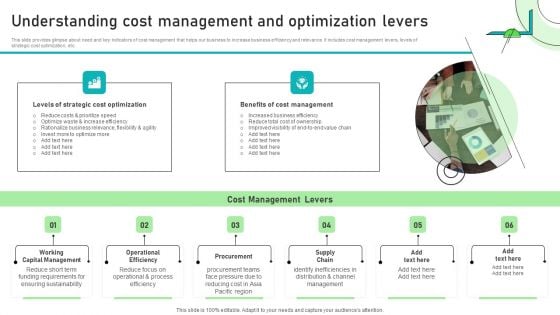
Adjusting Financial Strategies And Planning Understanding Cost Management And Optimization Levers Information PDF
This slide provides glimpse about need and key indicators of cost management that helps our business to increase business efficiency and relevance. It includes cost management levers, levels of strategic cost optimization, etc. Present like a pro with Adjusting Financial Strategies And Planning Understanding Cost Management And Optimization Levers Information PDF Create beautiful presentations together with your team, using our easy to use presentation slides. Share your ideas in real time and make changes on the fly by downloading our templates. So whether you are in the office, on the go, or in a remote location, you can stay in sync with your team and present your ideas with confidence. With Slidegeeks presentation got a whole lot easier. Grab these presentations today.
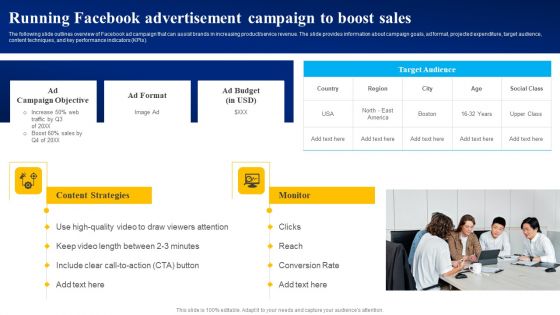
Running Facebook Advertisement Campaign To Boost Sales Ppt PowerPoint Presentation File Portfolio PDF
The following slide outlines overview of Facebook ad campaign that can assist brands in increasing product or service revenue. The slide provides information about campaign goals, ad format, projected expenditure, target audience, content techniques, and key performance indicators KPIs. The Running Facebook Advertisement Campaign To Boost Sales Ppt PowerPoint Presentation File Portfolio PDF is a compilation of the most recent design trends as a series of slides. It is suitable for any subject or industry presentation, containing attractive visuals and photo spots for businesses to clearly express their messages. This template contains a variety of slides for the user to input data, such as structures to contrast two elements, bullet points, and slides for written information. Slidegeeks is prepared to create an impression.
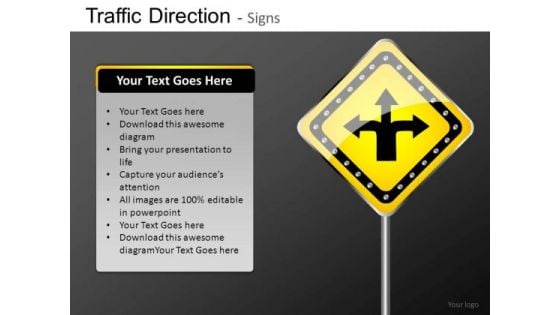
Ppt Slides Choices Of Directions Road Signs PowerPoint Templates
PPT_Slides_Choices_of_Directions_Road_Signs_PowerPoint_templates-These high quality powerpoint pre-designed slides and powerpoint templates have been carefully created by our professional team to help you impress your audience. All slides have been created and are 100% editable in powerpoint. Each and every property of any graphic - color, size, orientation, shading, outline etc. can be modified to help you build an effective powerpoint presentation. Any text can be entered at any point in the powerpoint template or slide. Simply DOWNLOAD, TYPE and PRESENT! These PowerPoint presentation slides can be used to represent themes relating to --advisory, arrow, billboard, board, career, choice, clear, crossroads, custom, decide, decision, different, direction, editable, empty, explore, guide, guidepost, idea, indicator, information, isolated, message, motivation, notice, pointer, pointing, pole, post, resizable, road, roadsign, route, scalable, select, show, sign, signage, signpost, sky, stick, stylized, success, trafficator, travel, turn, vector, warning, way-PPT_Slides_Choices_of_Directions_Road_Signs_PowerPoint_templates Our Ppt Slides Choices Of Directions Road Signs PowerPoint Templates are academically capable. They make learning a lot more fun.
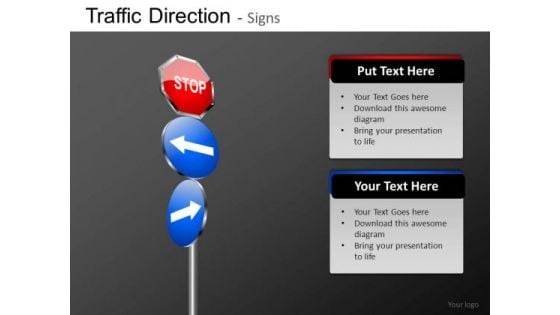
Ppt Slides Stop Sign Arrows Direction Road Signs PowerPoint Templates
PPT_Slides_Stop_Sign_Arrows_Direction_Road_Signs_PowerPoint_templates-These high quality powerpoint pre-designed slides and powerpoint templates have been carefully created by our professional team to help you impress your audience. All slides have been created and are 100% editable in powerpoint. Each and every property of any graphic - color, size, orientation, shading, outline etc. can be modified to help you build an effective powerpoint presentation. Any text can be entered at any point in the powerpoint template or slide. Simply DOWNLOAD, TYPE and PRESENT! These PowerPoint presentation slides can be used to represent themes relating to --advisory, arrow, billboard, board, career, choice, clear, crossroads, custom, decide, decision, different, direction, editable, empty, explore, guide, guidepost, idea, indicator, information, isolated, message, motivation, notice, pointer, pointing, pole, post, resizable, road, roadsign, route, scalable, select, show, sign, signage, signpost, sky, stick, stylized, success, trafficator, travel, turn, vector, warning, way-PPT_Slides_Stop_Sign_Arrows_Direction_Road_Signs_PowerPoint_templates Stitch together the fabric of your thoughts. Thread through with our Ppt Slides Stop Sign Arrows Direction Road Signs PowerPoint Templates.
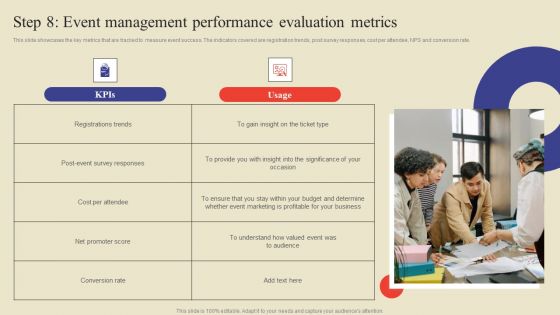
Step 8 Event Management Performance Evaluation Metrics Ppt Layouts Inspiration PDF
This slide showcases the key metrics that are tracked to measure event success. The indicators covered are registration trends, post survey responses, cost per attendee, NPS and conversion rate. Do you have an important presentation coming up Are you looking for something that will make your presentation stand out from the rest Look no further than Step 8 Event Management Performance Evaluation Metrics Ppt Layouts Inspiration PDF. With our professional designs, you can trust that your presentation will pop and make delivering it a smooth process. And with Slidegeeks, you can trust that your presentation will be unique and memorable. So why wait Grab Step 8 Event Management Performance Evaluation Metrics Ppt Layouts Inspiration PDF today and make your presentation stand out from the rest.
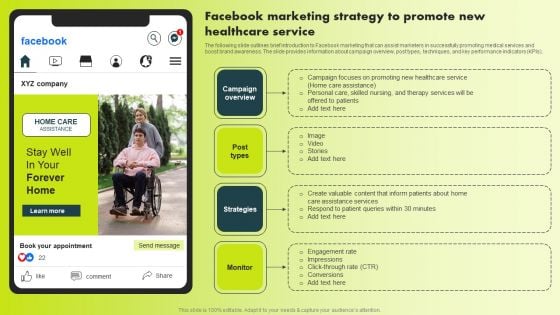
Facebook Marketing Strategy To Promote New Healthcare Service Sample PDF
The following slide outlines brief introduction to Facebook marketing that can assist marketers in successfully promoting medical services and boost brand awareness. The slide provides information about campaign overview, post types, techniques, and key performance indicators KPIs. This Facebook Marketing Strategy To Promote New Healthcare Service Sample PDF from Slidegeeks makes it easy to present information on your topic with precision. It provides customization options, so you can make changes to the colors, design, graphics, or any other component to create a unique layout. It is also available for immediate download, so you can begin using it right away. Slidegeeks has done good research to ensure that you have everything you need to make your presentation stand out. Make a name out there for a brilliant performance.
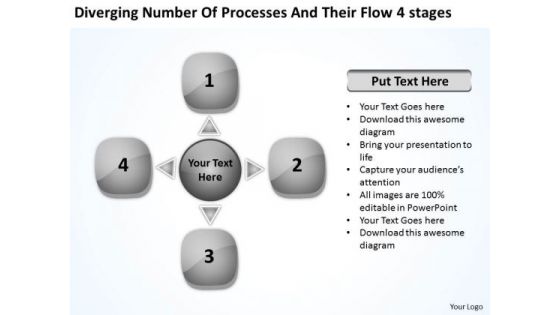
Number Of Processes And Their Stages Cycle Motion Chart PowerPoint Templates
We present our number of processes and their stages Cycle Motion Chart PowerPoint templates.Download our Symbol PowerPoint Templates because they are the indicators of the path you have in mind. Download and present our Arrows PowerPoint Templates because you can get advantage to prioritise your ideas. Present our Business PowerPoint Templates because you too have got the framework of your companys growth in place. Download our Shapes PowerPoint Templates because knowledge is power goes the popular saying. Download and present our Process and Flows PowerPoint Templates because the ideas and plans are on your finger tips.Use these PowerPoint slides for presentations relating to Abstract, Arrows, Blank, Business, Central, Centralized, Chart, Circle, Circular, Circulation, Concept, Conceptual, Converging, Design, Diagram, Empty, Executive, Five, Icon, Idea, Illustration, Management, Map, Mapping, Organization, Outwards, Pointing, Procedure, Process, Relationship, Strategy, Template. The prominent colors used in the PowerPoint template are White, Gray, Black. Use our number of processes and their stages Cycle Motion Chart PowerPoint templates are Festive. We assure you our Centralized PowerPoint templates and PPT Slides are Beautiful. People tell us our number of processes and their stages Cycle Motion Chart PowerPoint templates provide great value for your money. Be assured of finding the best projection to highlight your words. PowerPoint presentation experts tell us our Blank PowerPoint templates and PPT Slides are Colorful. PowerPoint presentation experts tell us our number of processes and their stages Cycle Motion Chart PowerPoint templates are Endearing. Use our Blank PowerPoint templates and PPT Slides are Stunning. Consolidate successes with our Number Of Processes And Their Stages Cycle Motion Chart PowerPoint Templates. Download without worries with our money back guaranteee.
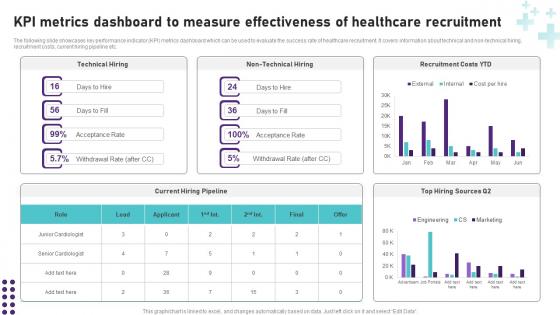
KPI Metrics Dashboard To Measure Healthcare Operational Areas Healthcare Brochure PDF
Retrieve professionally designed KPI Metrics Dashboard To Measure Healthcare Operational Areas Healthcare Brochure PDF to effectively convey your message and captivate your listeners. Save time by selecting pre-made slideshows that are appropriate for various topics, from business to educational purposes. These themes come in many different styles, from creative to corporate, and all of them are easily adjustable and can be edited quickly. Access them as PowerPoint templates or as Google Slides themes. You do not have to go on a hunt for the perfect presentation because Slidegeeks got you covered from everywhere. The following slide showcases key performance indicator KPI metrics dashboard which can be used to evaluate the success rate of healthcare recruitment. It covers information about technical and non-technical hiring, recruitment costs, current hiring pipeline etc.
Flow Ppt Theme Linear Arrows 12 Phase Diagram Time Management PowerPoint 3 Image
flow PPT Theme linear arrows 12 phase diagram time management powerpoint 3 Image-Develop competitive advantage with our above template which contains a series of directional arrows that show what path to follow. Develop your marketing strategy and communicate your enthusiasm and motivation to raise the bar.-flow PPT Theme linear arrows 12 phase diagram time management powerpoint 3 Image-Aim, Angle, Arrow, Arrowheads, Badge, Banner, Connection, Curve, Design, Direction, Download, Element, Fuchsia, Icon, Illustration, Indicator, Internet, Label, Link, Magenta, Mark, Marker, Next, Object, Orange, Orientation, Pointer, Shadow, Shape, Signs Symbol No matter how far flung your clientele is. Connect with them all through our Flow Ppt Theme Linear Arrows 12 Phase Diagram Time Management PowerPoint 3 Image.
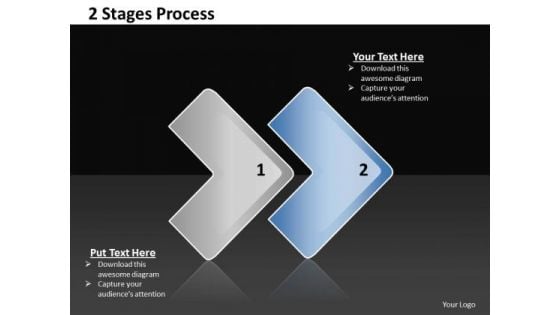
Ppt Linear Way To Represent 2 Phase Diagram PowerPoint Templates
PPT linear way to represent 2 phase diagram PowerPoint Templates-Create dynamic Microsoft office PPT Presentations with our professional Diagrams containing a graphic of two phases represented by two designable arrows placed horizontally. Heighten the anticipation of your audience with this slide showing two curved arrows. You can apply other 3D Styles and shapes to the slide to enhance your presentations.-PPT linear way to represent 2 phase diagram PowerPoint Templates-Aim, Arrow, Arrowheads, Badge, Border, Click, Connection, Curve, Design, Direction, Download, Element, Fuchsia, Icon, Illustration, Indicator, Internet, Magenta, Mark, Object, Orientation, Pointer, Shadow, Shape, Sign Trim the fat with our Ppt Linear Way To Represent 2 Phase Diagram PowerPoint Templates. Get right down to the meat of the matter.
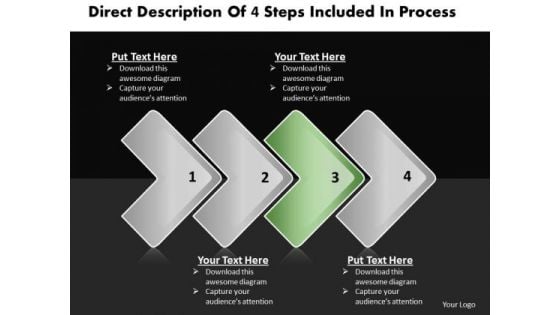
Ppt Staright Description Of Process Business PowerPoint Templates
PPT staright description of process Business PowerPoint Templates-Display the direction of the specific activities involved and how to put these in a proper manner for achieving the desired goal. This image clearly defines the concept of Vertical Process and models. Adjust the above image in your PPT presentations to visually support your content in your Business PPT slideshows. You can apply other 3D Styles and shapes to the slide to enhance your presentations. -PPT staright description of process Business PowerPoint Templates-Aim, Arrow, Arrowheads, Badge, Border, Click, Connection, Curve, Design, Direction, Download, Element, Fuchsia, Icon, Illustration, Indicator, Internet, Magenta, Mark, Object, Orientation, Pointer, Shadow, Shape, Sign Recieve compliments with our Ppt Staright Description Of Process Business PowerPoint Templates. The audience will eulogise you.
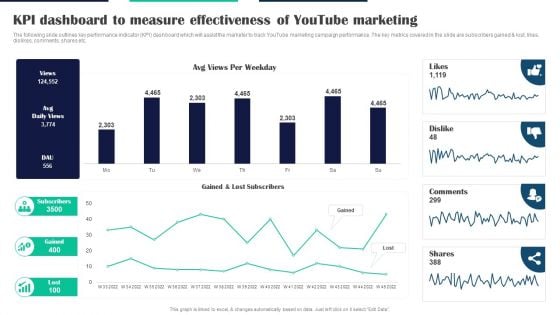
Executing Video Promotional KPI Dashboard To Measure Effectiveness Of Youtube Marketing Professional PDF
The following slide outlines key performance indicator KPI dashboard which will assist the marketer to track YouTube marketing campaign performance. The key metrics covered in the slide are subscribers gained and lost, likes, dislikes, comments, shares etc. Formulating a presentation can take up a lot of effort and time, so the content and message should always be the primary focus. The visuals of the PowerPoint can enhance the presenters message, so our Executing Video Promotional KPI Dashboard To Measure Effectiveness Of Youtube Marketing Professional PDF was created to help save time. Instead of worrying about the design, the presenter can concentrate on the message while our designers work on creating the ideal templates for whatever situation is needed. Slidegeeks has experts for everything from amazing designs to valuable content, we have put everything into Executing Video Promotional KPI Dashboard To Measure Effectiveness Of Youtube Marketing Professional PDF
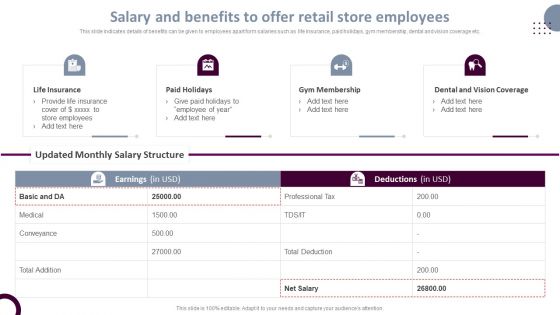
Retail Store Operations Salary And Benefits To Offer Retail Store Employees Information PDF
This slide indicates details of benefits can be given to employees apart form salaries such as life insurance, paid holidays, gym membership, dental and vision coverage etc. Formulating a presentation can take up a lot of effort and time, so the content and message should always be the primary focus. The visuals of the PowerPoint can enhance the presenters message, so our Retail Store Operations Salary And Benefits To Offer Retail Store Employees Information PDF was created to help save time. Instead of worrying about the design, the presenter can concentrate on the message while our designers work on creating the ideal templates for whatever situation is needed. Slidegeeks has experts for everything from amazing designs to valuable content, we have put everything into Retail Store Operations Salary And Benefits To Offer Retail Store Employees Information PDF

Estimating Business Overall Kpi Metrics Dashboard Highlighting Organization Revenue Clipart PDF
The following slide outlines key performance indicator KPI dashboard showcasing various financial metrics of the organization. The key metrics are gross revenue, product revenue, service revenue, gross profit, net profit etc. Formulating a presentation can take up a lot of effort and time, so the content and message should always be the primary focus. The visuals of the PowerPoint can enhance the presenters message, so our Estimating Business Overall Kpi Metrics Dashboard Highlighting Organization Revenue Clipart PDF was created to help save time. Instead of worrying about the design, the presenter can concentrate on the message while our designers work on creating the ideal templates for whatever situation is needed. Slidegeeks has experts for everything from amazing designs to valuable content, we have put everything into Estimating Business Overall Kpi Metrics Dashboard Highlighting Organization Revenue Clipart PDF.
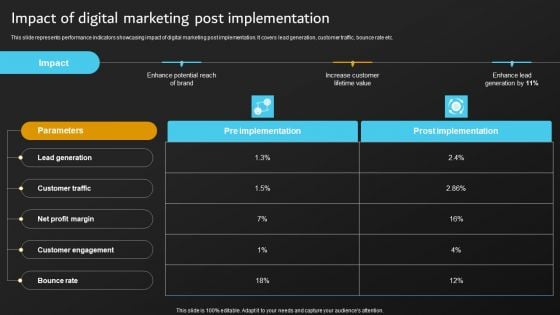
Implementation Of Digital Marketing Impact Of Digital Marketing Post Implementation Professional PDF
This slide represents performance indicators showcasing impact of digital marketing post implementation. It covers lead generation, customer traffic, bounce rate etc. Formulating a presentation can take up a lot of effort and time, so the content and message should always be the primary focus. The visuals of the PowerPoint can enhance the presenters message, so our Implementation Of Digital Marketing Impact Of Digital Marketing Post Implementation Professional PDF was created to help save time. Instead of worrying about the design, the presenter can concentrate on the message while our designers work on creating the ideal templates for whatever situation is needed. Slidegeeks has experts for everything from amazing designs to valuable content, we have put everything into Implementation Of Digital Marketing Impact Of Digital Marketing Post Implementation Professional PDF.
Clinical Trial Phases With Number Of Participating Institutions Clinical Research Trial Phases Icons PDF
This slide indicates the information regarding the multiple stages of the clinical trial process such as the number of participants, the cost involved, and the time required to complete each phase. Formulating a presentation can take up a lot of effort and time, so the content and message should always be the primary focus. The visuals of the PowerPoint can enhance the presenters message, so our Clinical Trial Phases With Number Of Participating Institutions Clinical Research Trial Phases Icons PDF was created to help save time. Instead of worrying about the design, the presenter can concentrate on the message while our designers work on creating the ideal templates for whatever situation is needed. Slidegeeks has experts for everything from amazing designs to valuable content, we have put everything into Clinical Trial Phases With Number Of Participating Institutions Clinical Research Trial Phases Icons PDF
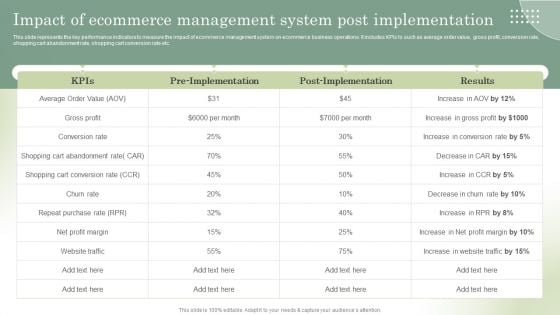
Optimizing Online Stores Impact Of Ecommerce Management System Post Microsoft PDF
This slide represents the key performance indicators to measure the impact of ecommerce management system on ecommerce business operations. It includes KPIs to such as average order value, gross profit, conversion rate, shopping cart abandonment rate, shopping cart conversion rate etc. Formulating a presentation can take up a lot of effort and time, so the content and message should always be the primary focus. The visuals of the PowerPoint can enhance the presenters message, so our Optimizing Online Stores Impact Of Ecommerce Management System Post Microsoft PDF was created to help save time. Instead of worrying about the design, the presenter can concentrate on the message while our designers work on creating the ideal templates for whatever situation is needed. Slidegeeks has experts for everything from amazing designs to valuable content, we have put everything into Optimizing Online Stores Impact Of Ecommerce Management System Post Microsoft PDF.
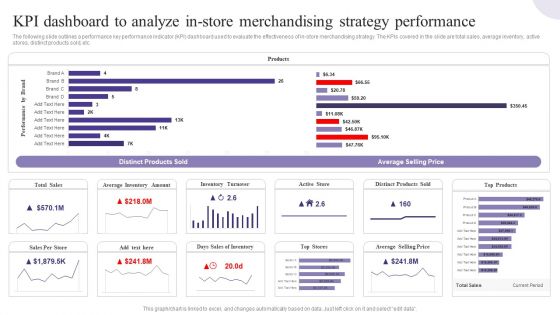
KPI Dashboard To Analyze In Store Merchandising Strategy Performance Introduction PDF
The following slide outlines a performance key performance indicator KPI dashboard used to evaluate the effectiveness of in-store merchandising strategy. The KPIs covered in the slide are total sales, average inventory, active stores, distinct products sold, etc. Formulating a presentation can take up a lot of effort and time, so the content and message should always be the primary focus. The visuals of the PowerPoint can enhance the presenters message, so our KPI Dashboard To Analyze In Store Merchandising Strategy Performance Introduction PDF was created to help save time. Instead of worrying about the design, the presenter can concentrate on the message while our designers work on creating the ideal templates for whatever situation is needed. Slidegeeks has experts for everything from amazing designs to valuable content, we have put everything into KPI Dashboard To Analyze In Store Merchandising Strategy Performance Introduction PDF.
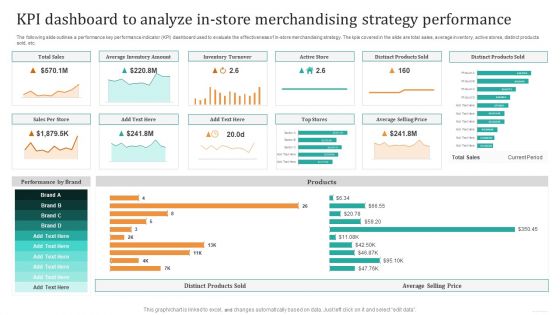
KPI Dashboard To Analyze In Store Merchandising Strategy Performance Pictures PDF
The following slide outlines a performance key performance indicator KPI dashboard used to evaluate the effectiveness of in-store merchandising strategy. The KPIs covered in the slide are total sales, average inventory, active stores, distinct products sold, etc. Formulating a presentation can take up a lot of effort and time, so the content and message should always be the primary focus. The visuals of the PowerPoint can enhance the presenters message, so our KPI Dashboard To Analyze In Store Merchandising Strategy Performance Pictures PDF was created to help save time. Instead of worrying about the design, the presenter can concentrate on the message while our designers work on creating the ideal templates for whatever situation is needed. Slidegeeks has experts for everything from amazing designs to valuable content, we have put everything into KPI Dashboard To Analyze In Store Merchandising Strategy Performance Pictures PDF.
Analysis Plan For E Commerce Promotion Tactics Content Performance Tracking Dashboard For Social Media Channels Icons PDF
This slide indicates the content performance tracking dashboard for social media channels providing information regarding the total number of posts, engagement rate, audience sentiments and multiple hashtags performance. Formulating a presentation can take up a lot of effort and time, so the content and message should always be the primary focus. The visuals of the PowerPoint can enhance the presenters message, so our Analysis Plan For E Commerce Promotion Tactics Content Performance Tracking Dashboard For Social Media Channels Icons PDF was created to help save time. Instead of worrying about the design, the presenter can concentrate on the message while our designers work on creating the ideal templates for whatever situation is needed. Slidegeeks has experts for everything from amazing designs to valuable content, we have put everything into Analysis Plan For E Commerce Promotion Tactics Content Performance Tracking Dashboard For Social Media Channels Icons PDF
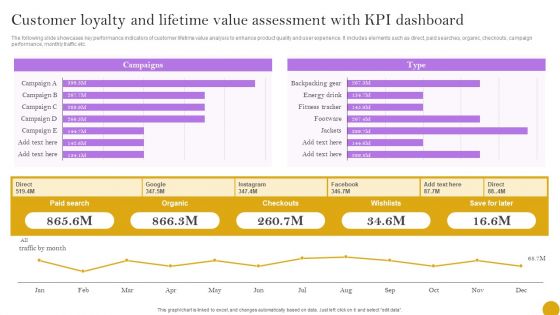
Comprehensive Customer Data Platform Guide Optimizing Promotional Initiatives Customer Loyalty And Lifetime Value Brochure PDF
The following slide showcases key performance indicators of customer lifetime value analysis to enhance product quality and user experience. It includes elements such as direct, paid searches, organic, checkouts, campaign performance, monthly traffic etc. Explore a selection of the finest Comprehensive Customer Data Platform Guide Optimizing Promotional Initiatives Customer Loyalty And Lifetime Value Brochure PDF here. With a plethora of professionally designed and pre made slide templates, you can quickly and easily find the right one for your upcoming presentation. You can use our Comprehensive Customer Data Platform Guide Optimizing Promotional Initiatives Customer Loyalty And Lifetime Value Brochure PDF to effectively convey your message to a wider audience. Slidegeeks has done a lot of research before preparing these presentation templates. The content can be personalized and the slides are highly editable. Grab templates today from Slidegeeks.

Percent Change In Workplace Productivity Ppt Summary Slide Portrait
Following slide illustrates informational stats about percent change in workplace productivity. Here the graph indicates that workplace productivity gets decreased by 1.6 percent in 2022 as compared to 2023 stats. Formulating a presentation can take up a lot of effort and time, so the content and message should always be the primary focus. The visuals of the PowerPoint can enhance the presenters message, so our Percent Change In Workplace Productivity Ppt Summary Slide Portrait was created to help save time. Instead of worrying about the design, the presenter can concentrate on the message while our designers work on creating the ideal templates for whatever situation is needed. Slidegeeks has experts for everything from amazing designs to valuable content, we have put everything into Percent Change In Workplace Productivity Ppt Summary Slide Portrait.
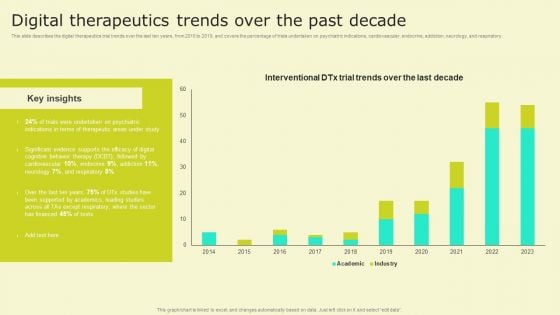
Digital Health Interventions Digital Therapeutics Trends Over The Past Decade Rules PDF
This slide describes the digital therapeutics trial trends over the last ten years, from 2010 to 2019, and covers the percentage of trials undertaken on psychiatric indications, cardiovascular, endocrine, addiction, neurology, and respiratory. Formulating a presentation can take up a lot of effort and time, so the content and message should always be the primary focus. The visuals of the PowerPoint can enhance the presenters message, so our Digital Health Interventions Digital Therapeutics Trends Over The Past Decade Rules PDF was created to help save time. Instead of worrying about the design, the presenter can concentrate on the message while our designers work on creating the ideal templates for whatever situation is needed. Slidegeeks has experts for everything from amazing designs to valuable content, we have put everything into Digital Health Interventions Digital Therapeutics Trends Over The Past Decade Rules PDF
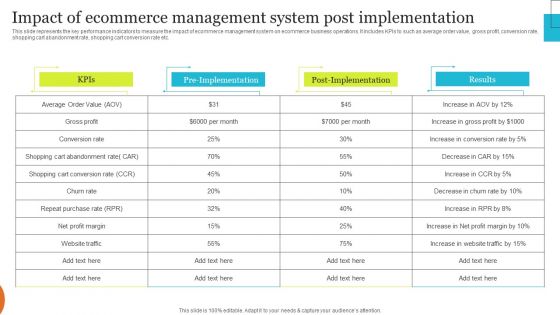
Implementing Effective Ecommerce Managemnet Platform Impact Of Ecommerce Management System Introduction PDF
This slide represents the key performance indicators to measure the impact of ecommerce management system on ecommerce business operations. It includes KPIs to such as average order value, gross profit, conversion rate, shopping cart abandonment rate, shopping cart conversion rate etc. Formulating a presentation can take up a lot of effort and time, so the content and message should always be the primary focus. The visuals of the PowerPoint can enhance the presenters message, so our Implementing Effective Ecommerce Managemnet Platform Impact Of Ecommerce Management System Introduction PDF was created to help save time. Instead of worrying about the design, the presenter can concentrate on the message while our designers work on creating the ideal templates for whatever situation is needed. Slidegeeks has experts for everything from amazing designs to valuable content, we have put everything into Implementing Effective Ecommerce Managemnet Platform Impact Of Ecommerce Management System Introduction PDF
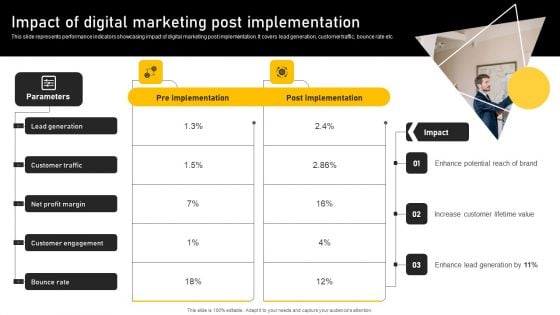
Online Ads Strategic Plan For Effective Marketing Impact Of Digital Marketing Post Implementation Pictures PDF
This slide represents performance indicators showcasing impact of digital marketing post implementation. It covers lead generation, customer traffic, bounce rate etc. Formulating a presentation can take up a lot of effort and time, so the content and message should always be the primary focus. The visuals of the PowerPoint can enhance the presenters message, so our Online Ads Strategic Plan For Effective Marketing How Advertisers Calculate CPC For Marketing Campaign Brochure PDF was created to help save time. Instead of worrying about the design, the presenter can concentrate on the message while our designers work on creating the ideal templates for whatever situation is needed. Slidegeeks has experts for everything from amazing designs to valuable content, we have put everything into Online Ads Strategic Plan For Effective Marketing How Advertisers Calculate CPC For Marketing Campaign Brochure PDF
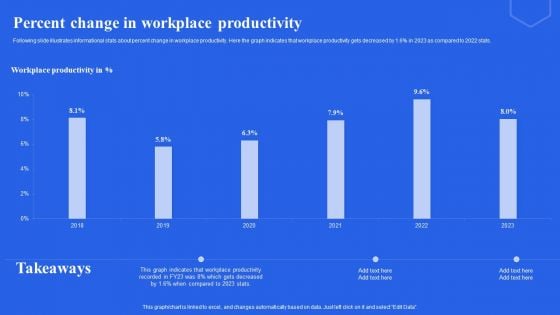
Percent Change In Workplace Productivity Ppt Pictures Slideshow PDF
Following slide illustrates informational stats about percent change in workplace productivity. Here the graph indicates that workplace productivity gets decreased by 1.6 percent in 2023 as compared to 2022 stats. Formulating a presentation can take up a lot of effort and time, so the content and message should always be the primary focus. The visuals of the PowerPoint can enhance the presenters message, so our Percent Change In Workplace Productivity Ppt Pictures Slideshow PDF was created to help save time. Instead of worrying about the design, the presenter can concentrate on the message while our designers work on creating the ideal templates for whatever situation is needed. Slidegeeks has experts for everything from amazing designs to valuable content, we have put everything into Percent Change In Workplace Productivity Ppt Pictures Slideshow PDF

Image Of Snowy Hut Trees Around It PowerPoint Templates Ppt Backgrounds For Slides 1212
We present our Image Of Snowy Hut Trees Around It PowerPoint Templates PPT Backgrounds For Slides 1212.Use our Christmas PowerPoint Templates because this slide depicts the festive and holy season to remind your team of your commitment to your faith. Download our Signs PowerPoint Templates because this Slide offers an excellent background to build up the various stages of your business process. Present our New year PowerPoint Templates because this is a time to reflect and retrospect on successes and failures. Download and present our Holidays PowerPoint Templates because they are the indicators of the path you have in mind. Download our Festival PowerPoint Templates because these slides are the triggers of our growth.Use these PowerPoint slides for presentations relating to Snow hut around tree, christmas, signs, holidays, new year, festival. The prominent colors used in the PowerPoint template are Green, White, Red. Use our Image Of Snowy Hut Trees Around It PowerPoint Templates PPT Backgrounds For Slides 1212 are second to none. Presenters tell us our tree PowerPoint templates and PPT Slides are Luxuriant. People tell us our Image Of Snowy Hut Trees Around It PowerPoint Templates PPT Backgrounds For Slides 1212 are Luxuriant. You can be sure our new PowerPoint templates and PPT Slides are Luxuriant. Professionals tell us our Image Of Snowy Hut Trees Around It PowerPoint Templates PPT Backgrounds For Slides 1212 are Glamorous. Professionals tell us our christmas PowerPoint templates and PPT Slides are Zippy. Be a father figure to your young team. Give them the benefit of experience with our Image Of Snowy Hut Trees Around It PowerPoint Templates Ppt Backgrounds For Slides 1212.
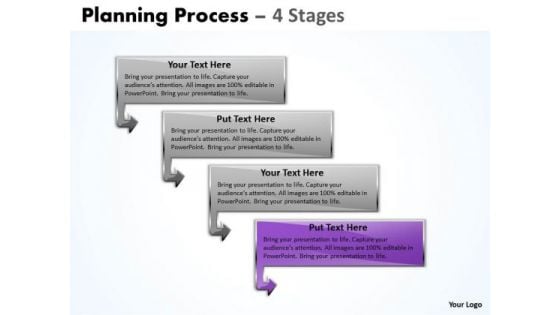
Marketing Ppt Grouping Of 4 Process Operations Management PowerPoint 5 Graphic
We present our marketing PPT grouping of 4 Process operations management power point 5 Graphic. Use our Advertising PowerPoint Templates because, you have what it takes to grow. Use our Shapes PowerPoint Templates because; now use this template to enlighten your team and colleagues on the critical factors involved. Use our Marketing PowerPoint Templates because, It has inspired a whole new world of medical endeavor. Use our Finance PowerPoint Templates because, Display your ideas and highlight the ability to accelerate the growth of your company and you. Use our Business PowerPoint Templates because, they are indicators of the path you have in mind. Use these PowerPoint slides for presentations relating to accent, advertisement, arrow, badge, banner, business, button, collection, color, decoration, design, flow, graph, horizontal, instruction, isolated, label, manual, menu, message, navigation, process, retail, sale, set, shape, symbol, variation, vector,. The prominent colors used in the PowerPoint template are Purple, Gray, and Black Dont ignore the perils of a boring presentation. Liven it up with our Marketing Ppt Grouping Of 4 Process Operations Management PowerPoint 5 Graphic. Make sure your presentation gets the attention it deserves.
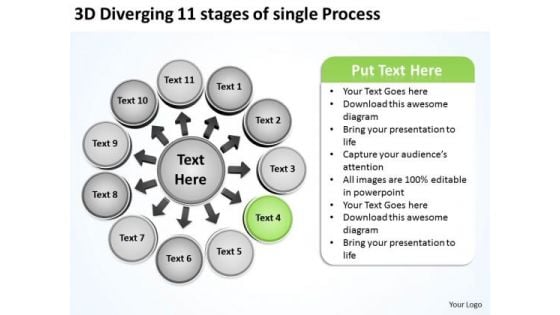
3d Diverging 11 Stages Of Single Process Business Circular Flow Arrow Chart PowerPoint Slides
We present our 3d diverging 11 stages of single process business Circular Flow Arrow Chart PowerPoint Slides.Use our Business PowerPoint Templates because you too have got the framework of your companys growth in place. Download our Circle charts PowerPoint Templates because you should Emphasise the process of your business or corporate growth. Download our Arrows PowerPoint Templates because colours generate instant reactions in our brains. Use our Shapes PowerPoint Templates because it Creates a winner with your passion and dream. Use our Flow charts PowerPoint Templates because they are the indicators of the path you have in mind.Use these PowerPoint slides for presentations relating to Abstract, arrow, arrow, circle, business, concept, career, center, stage, chart, circle circle, connection, contrast, cycle, diagram, direction, flow flowchart, future, graph, icon, illustration, isolate, isolated, job, life, loop, money, motion network, recycle, refresh, ring, rotation, sick, sign, symbol, simply, target, wealth. The prominent colors used in the PowerPoint template are Green, Gray, White. People tell us our 3d diverging 11 stages of single process business Circular Flow Arrow Chart PowerPoint Slides are No-nonsense. PowerPoint presentation experts tell us our center PowerPoint templates and PPT Slides provide great value for your money. Be assured of finding the best projection to highlight your words. Presenters tell us our 3d diverging 11 stages of single process business Circular Flow Arrow Chart PowerPoint Slides are Glamorous. PowerPoint presentation experts tell us our circle PowerPoint templates and PPT Slides are Spiffy. People tell us our 3d diverging 11 stages of single process business Circular Flow Arrow Chart PowerPoint Slides are specially created by a professional team with vast experience. They diligently strive to come up with the right vehicle for your brilliant Ideas. People tell us our stage PowerPoint templates and PPT Slides are Youthful. However faint their hopes may be. Buck them up with our 3d Diverging 11 Stages Of Single Process Business Circular Flow Arrow Chart PowerPoint Slides.
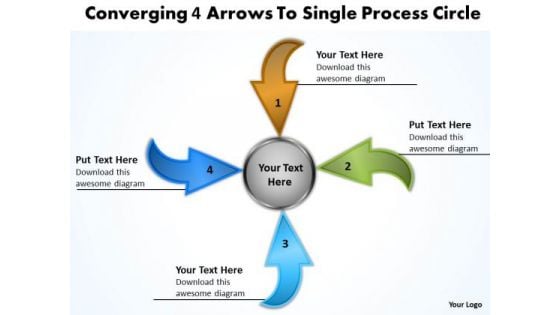
Converging 4 Arrows To Single Process Circle Pie Diagram PowerPoint Templates
We present our converging 4 arrows to single process circle Pie Diagram PowerPoint templates.Download and present our Arrows PowerPoint Templates because you will be able to Highlight your ideas broad-based on strong fundamentals and illustrate how they step by step acheive the set growth factor. Use our Circle Charts PowerPoint Templates because you can present your opinions in this field using our impressive templates. Download our Shapes PowerPoint Templates because displaying your ideas and highlighting your ability will accelerate the growth of your company and yours. Download and present our Business PowerPoint Templates because your ideas too are pinpointedly focused on you goals. Present our Flow Charts PowerPoint Templates because you can Unravel the desired and essential elements of your overall strategy.Use these PowerPoint slides for presentations relating to arrow, arrowheads, badge, banner, blue, button, cerulean, cobalt, colored, colorful, connection, cursor, cyan, design element, designator, directional, download, emblem, gray shadow, green, icon, indicator, interface, internet, link, load, magenta, marker, matted, menu tool, navigation panel, next, orientation, page site, pictogram, pink, pointer, red, right, satined, sign, signpost, smooth, symbol, upload, vector illustration, web, web 2.0, white background. The prominent colors used in the PowerPoint template are Blue, Brown, Green. Presenters tell us our converging 4 arrows to single process circle Pie Diagram PowerPoint templates are Nostalgic. You can be sure our banner PowerPoint templates and PPT Slides are Radiant. Professionals tell us our converging 4 arrows to single process circle Pie Diagram PowerPoint templates are Stylish. People tell us our colored PowerPoint templates and PPT Slides will generate and maintain the level of interest you desire. They will create the impression you want to imprint on your audience. People tell us our converging 4 arrows to single process circle Pie Diagram PowerPoint templates are Handsome. Professionals tell us our banner PowerPoint templates and PPT Slides are Efficient. Carry your thoughts on our Converging 4 Arrows To Single Process Circle Pie Diagram PowerPoint Templates. They will take them that much further.

Ppt Linear Arrow Change Management Process PowerPoint Presentation 6 Stages Templates
PPT linear arrow change management process powerpoint presentation 6 stages Templates-Arrow timeline PowerPoint Diagram is a Diagram with a timeline design diagram that you can download for PowerPoint presentations. This arrow timeline PowerPoint Diagram contains a diagram created with shapes that represents a basic arrow. This arrow Diagram contains a year timeline ready to be used for business projects or education timeline for PowerPoint. You can use this PPT Diagram as a pointer mark or timeline for business development project using business timelines with a blue arrow and bubbles for each year.-PPT linear arrow change management process powerpoint presentation 6 stages Templates-Aim, Arrow, Arrowheads, Badge, Border, Click, Connection, Curve, Design, Direction, Download, Element, Fuchsia, Icon, Illustration, Indicator, Internet, Magenta, Mark, Object, Orientation, Pointer, Shadow, Shape, Sign Educate them on the basics of fatherhood . Prepare them well with our Ppt Linear Arrow Change Management Process PowerPoint Presentation 6 Stages Templates.
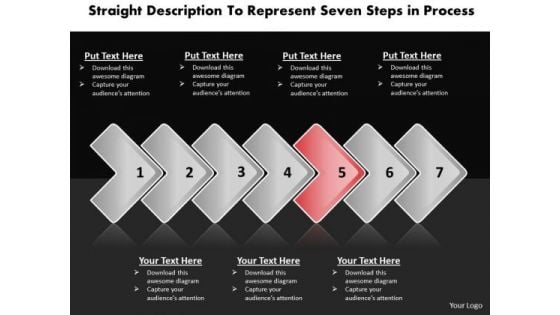
Ppt Description To Represent Seven Steps In Process PowerPoint Templates
PPT description to represent seven steps in process PowerPoint Templates-Often you have to represent an organization using a simple organizational hierarchy, but by using this PowerPoint Diagram you will give your Presentation a new look and will make it more interesting to watch. It is a useful captivating tool enables you to define your message in your Marketing PPT presentations. You can edit text, color, shade and style as per you need.-PPT description to represent seven steps in process PowerPoint Templates-Aim, Arrow, Arrowheads, Badge, Border, Click, Connection, Curve, Design, Direction, Download, Element, Fuchsia, Icon, Illustration, Indicator, Internet, Magenta, Mark, Object, Orientation, Pointer, Shadow, Shape, Sign Affiliate our Ppt Description To Represent Seven Steps In Process PowerPoint Templates to your thoughts. They will develop an affinity for them.
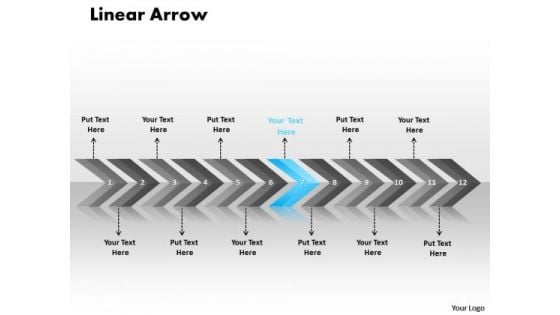
Marketing Ppt Linear Arrows 12 Power Point Stages Communication Skills PowerPoint 8 Image
marketing PPT linear arrows 12 power point stages communication skills powerpoint 8 Image-Develop competitive advantage with our above template which contains a diagram of pointed arrows. It helps expound on the logic of your detailed thought process to take your company forward. Break it all down to Key Result Areas. Motivate your team to cross all barriers-marketing PPT linear arrows 12 power point stages communication skills powerpoint 8 Image-Aim, Angle, Arrow, Arrowheads, Badge, Banner, Connection, Curve, Design, Direction, Download, Element, Fuchsia, Icon, Illustration, Indicator, Internet, Label, Link, Magenta, Mark, Marker, Next, Object, Orange, Orientation, Pointer, Shadow, Shape, Signs Symbol Energise your thoughts to fever pitch. Get them bubbling over with our Marketing Ppt Linear Arrows 12 Power Point Stages Communication Skills PowerPoint 8 Image.
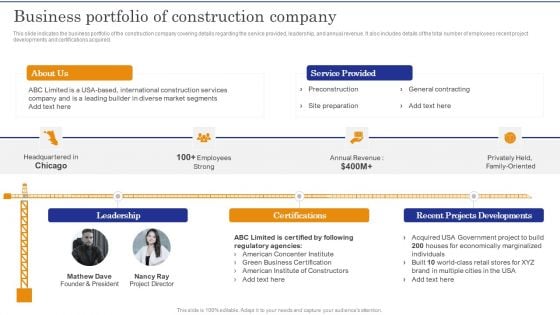
Construction Site Safety Measure Business Portfolio Of Construction Company Professional PDF
This slide indicates the business portfolio of the construction company covering details regarding the service provided, leadership, and annual revenue. It also includes details of the total number of employees recent project developments and certifications acquired.Crafting an eye catching presentation has never been more straightforward. Let your presentation shine with this tasteful yet straightforward Construction Site Safety Measure Business Portfolio Of Construction Company Professional PDF template. It offers a minimalistic and classy look that is great for making a statement. The colors have been employed intelligently to add a bit of playfulness while still remaining professional. Construct the ideal Construction Site Safety Measure Business Portfolio Of Construction Company Professional PDF that effortlessly grabs the attention of your audience Begin now and be certain to wow your customers.
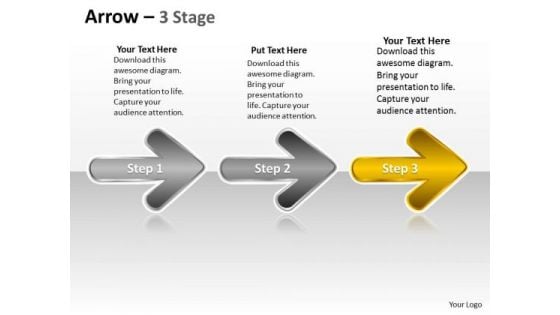
Ppt Series Of Continual Free Custom Presentation PowerPoint Charts Plan 4 Image
We present our PPT series of continual free custom presentation PowerPoint charts plan 4 Image. Use our Symbol PowerPoint Templates because, Brilliant ideas are your forte. Use our Shapes PowerPoint Templates because, Focus on each one and investigate which one would be the best fit for your needs. Use our Signs PowerPoint Templates because; Focus the light on the path to sure shot success. Use our Business PowerPoint Templates because; now imprint them on the minds of your audience via our slides. Use our Arrows PowerPoint Templates because; educate your staff on the means to provide the required support for speedy recovery. Use these PowerPoint slides for presentations relating to arrow, arrowheads, badge, banner, cerulean, colored, colorful, connection, design element, designator, directional, download, emblem, indicator, interface, internet, magenta, marker, matted, menu tool, navigation panel, next, orientation, page site, pictogram, pointer, sign. The prominent colors used in the PowerPoint template are Yellow, Gray, and White Subscribe to our Ppt Series Of Continual Free Custom Presentation PowerPoint Charts Plan 4 Image and receive success. Be assured of finding the best projection to highlight your words.
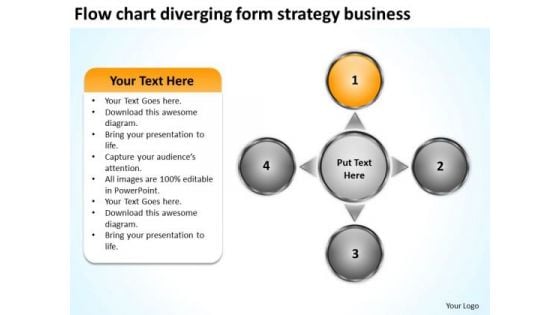
Form Strategy Business PowerPoint Presentations Cycle Arrow Process Templates
We present our form strategy business powerpoint presentations Cycle Arrow Process templates.Download our Circle Charts PowerPoint Templates because honesty is the best policy has an ardent follower in you. Use our Arrows PowerPoint Templates because they are the indicators of the path you have in mind. Download our Business PowerPoint Templates because your fledgling career is in the chrysallis stage. Nurture it and watch it grow into a beautiful butterfly. Download our Shapes PowerPoint Templates because you will be able to Highlight your ideas broad-based on strong fundamentals and illustrate how they step by step acheive the set growth factor. Download and present our Flow Charts PowerPoint Templates because you have an idea of which you are sure.Use these PowerPoint slides for presentations relating to Analysis, Analyze, Background, Blank, Business, Businessman, Center, Central, Chart, Component, Concept, Connect, Core, Decentralize, Diagram, Disperse, Disseminate, Distribute, Divide, Education, Element, Empty, Expand, Flow, Gist, Group, Industry, Link, Management, Manager, Part, Plan, Process, Scatter, Separate, Spread, Strategy, Support, Surround, Template, Transfer. The prominent colors used in the PowerPoint template are Orange, Gray, Black. We assure you our form strategy business powerpoint presentations Cycle Arrow Process templates are Quaint. We assure you our Center PowerPoint templates and PPT Slides are designed by a team of presentation professionals. Customers tell us our form strategy business powerpoint presentations Cycle Arrow Process templates are the best it can get when it comes to presenting. Presenters tell us our Center PowerPoint templates and PPT Slides are Perfect. You can be sure our form strategy business powerpoint presentations Cycle Arrow Process templates are Energetic. The feedback we get is that our Central PowerPoint templates and PPT Slides are Stunning. Our Form Strategy Business PowerPoint Presentations Cycle Arrow Process Templates can be bewitching. Put your audience under your spell.
Folder Icon Date Transferring Concept Computer PowerPoint Templates Ppt Backgrounds For Slides 1212
We present our Folder Icon Date Transferring Concept Computer PowerPoint Templates PPT Backgrounds For Slides 1212.Use our Technology PowerPoint Templates because you require care and diligence to function well. Use our Computer PowerPoint Templates because you know Coincidentally it will always point to the top. Present our Communication PowerPoint Templates because they are the indicators of the path you have in mind. Present our Internet PowerPoint Templates because it illustrates the symbols of human growth. Download our Marketing PowerPoint Templates because customer satisfaction is a mantra of the marketplace. Building a loyal client base is an essential element of your business.Use these PowerPoint slides for presentations relating to Download and upload folders, internet, computer, technology, communication, marketing. The prominent colors used in the PowerPoint template are Green, Blue, Yellow. Professionals tell us our Folder Icon Date Transferring Concept Computer PowerPoint Templates PPT Backgrounds For Slides 1212 are Beautiful. Use our internet PowerPoint templates and PPT Slides are Excellent. We assure you our Folder Icon Date Transferring Concept Computer PowerPoint Templates PPT Backgrounds For Slides 1212 provide great value for your money. Be assured of finding the best projection to highlight your words. We assure you our communication PowerPoint templates and PPT Slides will make you look like a winner. Presenters tell us our Folder Icon Date Transferring Concept Computer PowerPoint Templates PPT Backgrounds For Slides 1212 are Elevated. PowerPoint presentation experts tell us our communication PowerPoint templates and PPT Slides have awesome images to get your point across. Our Folder Icon Date Transferring Concept Computer PowerPoint Templates Ppt Backgrounds For Slides 1212 are more than just a facelift. They actually add to the depth of your views.


 Continue with Email

 Home
Home


