Project Phases
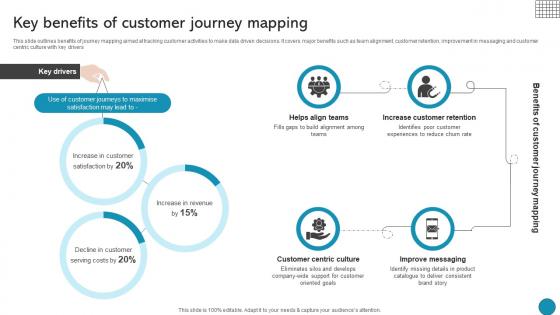
Key Benefits Of Customer Journey Mapping Driving Business Success Integrating Product
This slide outlines benefits of journey mapping aimed at tracking customer activities to make data driven decisions. It covers major benefits such as team alignment, customer retention, improvement in messaging and customer centric culture with key drivers Take your projects to the next level with our ultimate collection of Key Benefits Of Customer Journey Mapping Driving Business Success Integrating Product. Slidegeeks has designed a range of layouts that are perfect for representing task or activity duration, keeping track of all your deadlines at a glance. Tailor these designs to your exact needs and give them a truly corporate look with your own brand colors they will make your projects stand out from the rest This slide outlines benefits of journey mapping aimed at tracking customer activities to make data driven decisions. It covers major benefits such as team alignment, customer retention, improvement in messaging and customer centric culture with key drivers
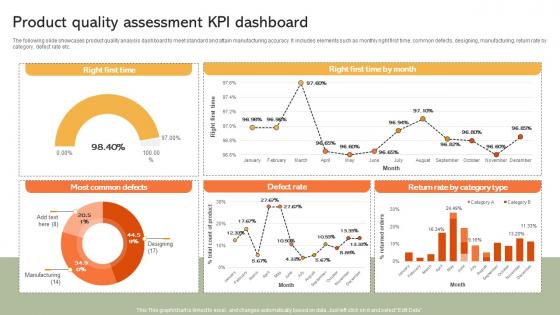
Product Quality Assessment KPI Dashboard Implementing Manufacturing Strategy SS V
The following slide showcases product quality analysis dashboard to meet standard and attain manufacturing accuracy. It includes elements such as monthly right first time, common defects, designing, manufacturing, return rate by category, defect rate etc. Take your projects to the next level with our ultimate collection of Product Quality Assessment KPI Dashboard Implementing Manufacturing Strategy SS V. Slidegeeks has designed a range of layouts that are perfect for representing task or activity duration, keeping track of all your deadlines at a glance. Tailor these designs to your exact needs and give them a truly corporate look with your own brand colors they will make your projects stand out from the rest The following slide showcases product quality analysis dashboard to meet standard and attain manufacturing accuracy. It includes elements such as monthly right first time, common defects, designing, manufacturing, return rate by category, defect rate etc.
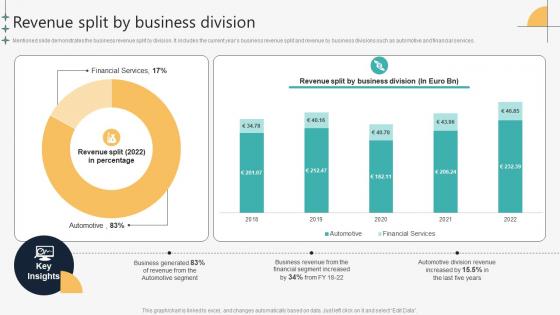
Revenue Split By Business Division Automotive Manufacturing Company Profile CP SS V
Mentioned slide demonstrates the business revenue split by division. It includes the current years business revenue split and revenue by business divisions such as automotive and financial services.Take your projects to the next level with our ultimate collection of Revenue Split By Business Division Automotive Manufacturing Company Profile CP SS V. Slidegeeks has designed a range of layouts that are perfect for representing task or activity duration, keeping track of all your deadlines at a glance. Tailor these designs to your exact needs and give them a truly corporate look with your own brand colors they will make your projects stand out from the rest Mentioned slide demonstrates the business revenue split by division. It includes the current years business revenue split and revenue by business divisions such as automotive and financial services.
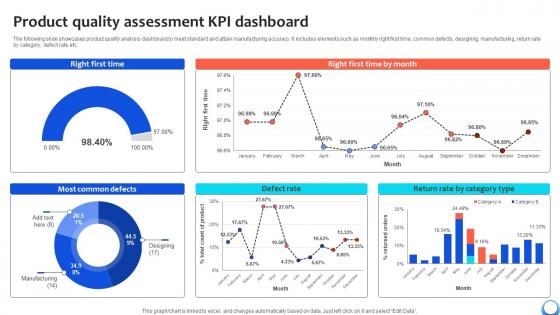
Product Quality Assessment KPI Dashboard Automating Production Process Strategy SS V
The following slide showcases product quality analysis dashboard to meet standard and attain manufacturing accuracy. It includes elements such as monthly right first time, common defects, designing, manufacturing, return rate by category, defect rate etc. Take your projects to the next level with our ultimate collection of Product Quality Assessment KPI Dashboard Automating Production Process Strategy SS V. Slidegeeks has designed a range of layouts that are perfect for representing task or activity duration, keeping track of all your deadlines at a glance. Tailor these designs to your exact needs and give them a truly corporate look with your own brand colors they will make your projects stand out from the rest The following slide showcases product quality analysis dashboard to meet standard and attain manufacturing accuracy. It includes elements such as monthly right first time, common defects, designing, manufacturing, return rate by category, defect rate etc.
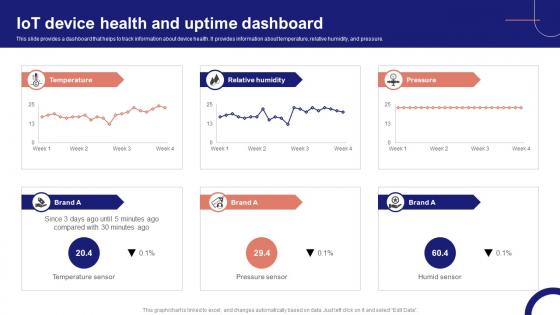
IoT Device Management Fundamentals IoT Device Health And Uptime Dashboard IoT Ss V
This slide provides a dashboard that helps to track information about device health. It provides information about temperature, relative humidity, and pressure. Take your projects to the next level with our ultimate collection of IoT Device Management Fundamentals IoT Device Health And Uptime Dashboard IoT SS V. Slidegeeks has designed a range of layouts that are perfect for representing task or activity duration, keeping track of all your deadlines at a glance. Tailor these designs to your exact needs and give them a truly corporate look with your own brand colors they will make your projects stand out from the rest This slide provides a dashboard that helps to track information about device health. It provides information about temperature, relative humidity, and pressure.
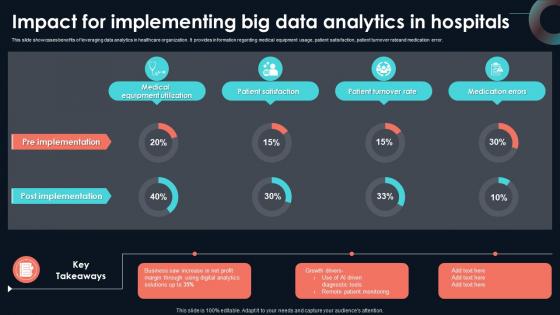
Impact For Implementing Big Data Analytics Developing Strategic Insights Using Big Data Analytics SS V
This slide showcases benefits of leveraging data analytics in healthcare organization. It provides information regarding medical equipment usage, patient satisfaction, patient turnover rateand medication error. Take your projects to the next level with our ultimate collection of Impact For Implementing Big Data Analytics Developing Strategic Insights Using Big Data Analytics SS V. Slidegeeks has designed a range of layouts that are perfect for representing task or activity duration, keeping track of all your deadlines at a glance. Tailor these designs to your exact needs and give them a truly corporate look with your own brand colors they will make your projects stand out from the rest This slide showcases benefits of leveraging data analytics in healthcare organization. It provides information regarding medical equipment usage, patient satisfaction, patient turnover rateand medication error.
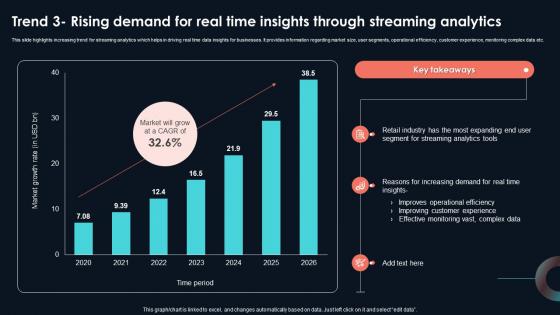
Trend 3 Rising Demand For Real Time Insights Developing Strategic Insights Using Big Data Analytics SS V
This slide highlights increasing trend for streaming analytics which helps in driving real time data insights for businesses. It provides information regarding market size, user segments, operational efficiency, customer experience, monitoring complex data etc. Take your projects to the next level with our ultimate collection of Trend 3 Rising Demand For Real Time Insights Developing Strategic Insights Using Big Data Analytics SS V. Slidegeeks has designed a range of layouts that are perfect for representing task or activity duration, keeping track of all your deadlines at a glance. Tailor these designs to your exact needs and give them a truly corporate look with your own brand colors they will make your projects stand out from the rest This slide highlights increasing trend for streaming analytics which helps in driving real time data insights for businesses. It provides information regarding market size, user segments, operational efficiency, customer experience, monitoring complex data etc.
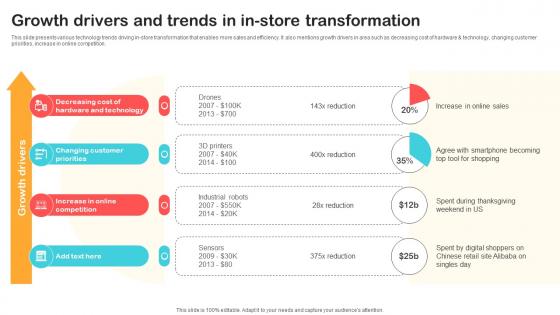
Growth Drivers And Trends In In Store Transformation Optimizing Retail Operations With Digital DT SS V
This slide presents various technology trends driving in-store transformation that enables more sales and efficiency. It also mentions growth drivers in area such as decreasing cost of hardware and technology, changing customer priorities, increase in online competition.Take your projects to the next level with our ultimate collection of Growth Drivers And Trends In In Store Transformation Optimizing Retail Operations With Digital DT SS V. Slidegeeks has designed a range of layouts that are perfect for representing task or activity duration, keeping track of all your deadlines at a glance. Tailor these designs to your exact needs and give them a truly corporate look with your own brand colors they will make your projects stand out from the rest This slide presents various technology trends driving in-store transformation that enables more sales and efficiency. It also mentions growth drivers in area such as decreasing cost of hardware and technology, changing customer priorities, increase in online competition.
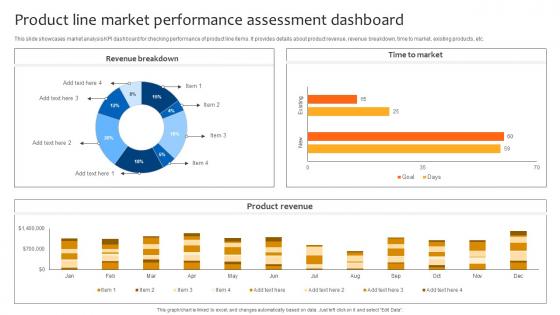
Deploying Strategies For Business Product Line Market Performance Assessment Dashboard Strategy SS V
This slide showcases market analysis KPI dashboard for checking performance of product line items. It provides details about product revenue, revenue breakdown, time to market, existing products, etc. Take your projects to the next level with our ultimate collection of Deploying Strategies For Business Product Line Market Performance Assessment Dashboard Strategy SS V. Slidegeeks has designed a range of layouts that are perfect for representing task or activity duration, keeping track of all your deadlines at a glance. Tailor these designs to your exact needs and give them a truly corporate look with your own brand colors they will make your projects stand out from the rest This slide showcases market analysis KPI dashboard for checking performance of product line items. It provides details about product revenue, revenue breakdown, time to market, existing products, etc.
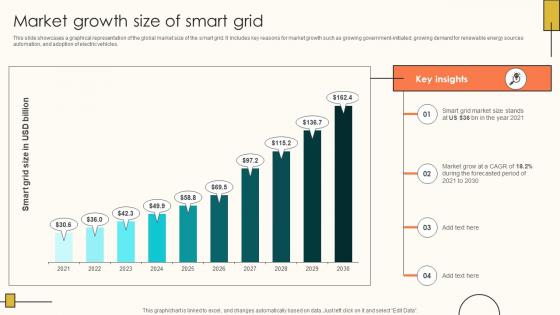
Market Growth Size Of Smart Grid Internet Of Things Solutions To Enhance Energy IoT SS V
This slide showcases a graphical representation of the global market size of the smart grid. It Includes key reasons for market growth such as growing government-initiated, growing demand for renewable energy sources automation, and adoption of electric vehicles. Take your projects to the next level with our ultimate collection of Market Growth Size Of Smart Grid Internet Of Things Solutions To Enhance Energy IoT SS V. Slidegeeks has designed a range of layouts that are perfect for representing task or activity duration, keeping track of all your deadlines at a glance. Tailor these designs to your exact needs and give them a truly corporate look with your own brand colors they will make your projects stand out from the rest This slide showcases a graphical representation of the global market size of the smart grid. It Includes key reasons for market growth such as growing government-initiated, growing demand for renewable energy sources automation, and adoption of electric vehicles.
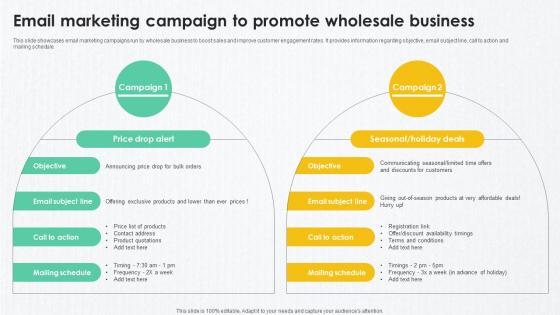
B2B Marketing Techniques To Email Marketing Campaign To Promote Wholesale
This slide showcases email marketing campaigns run by wholesale business to boost sales and improve customer engagement rates. It provides information regarding objective, email subject line, call to action and mailing schedule. Take your projects to the next level with our ultimate collection of B2B Marketing Techniques To Email Marketing Campaign To Promote Wholesale. Slidegeeks has designed a range of layouts that are perfect for representing task or activity duration, keeping track of all your deadlines at a glance. Tailor these designs to your exact needs and give them a truly corporate look with your own brand colors they will make your projects stand out from the rest This slide showcases email marketing campaigns run by wholesale business to boost sales and improve customer engagement rates. It provides information regarding objective, email subject line, call to action and mailing schedule.

IoT Solutions For Oil Oil And Gas Production Monitoring KPI Dashboard IoT SS V
This slide exhibits monthly performance of oil and gas production to track wellhead uptime and overall efficiency. It includes various elements such as production efficiency, well uptime, gas production rate, oil production rate, top performing gas producing wells, etc. Take your projects to the next level with our ultimate collection of IoT Solutions For Oil Oil And Gas Production Monitoring KPI Dashboard IoT SS V. Slidegeeks has designed a range of layouts that are perfect for representing task or activity duration, keeping track of all your deadlines at a glance. Tailor these designs to your exact needs and give them a truly corporate look with your own brand colors they will make your projects stand out from the rest This slide exhibits monthly performance of oil and gas production to track wellhead uptime and overall efficiency. It includes various elements such as production efficiency, well uptime, gas production rate, oil production rate, top performing gas producing wells, etc.
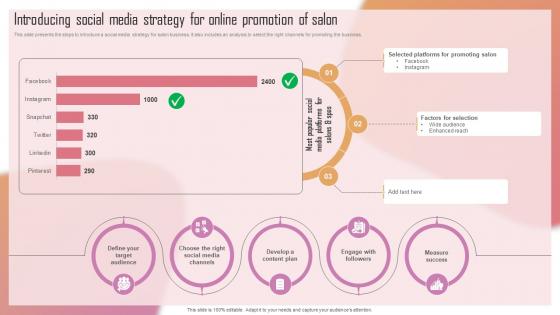
Customizing The Salon Experience Introducing Social Media Strategy For Online Promotion Strategy SS V
This slide presents the steps to introduce a social media strategy for salon business. It also includes an analysis to select the right channels for promoting the business. Take your projects to the next level with our ultimate collection of Customizing The Salon Experience Introducing Social Media Strategy For Online Promotion Strategy SS V. Slidegeeks has designed a range of layouts that are perfect for representing task or activity duration, keeping track of all your deadlines at a glance. Tailor these designs to your exact needs and give them a truly corporate look with your own brand colors they will make your projects stand out from the rest This slide presents the steps to introduce a social media strategy for salon business. It also includes an analysis to select the right channels for promoting the business.
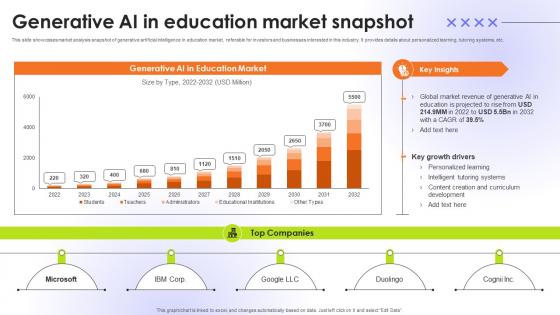
Generative AI In Education Market Snapshot Educational Transformation Through AI SS V
This slide showcases market analysis snapshot of generative artificial intelligence in education market, referable for investors and businesses interested in this industry. It provides details about personalized learning, tutoring systems, etc. Take your projects to the next level with our ultimate collection of Generative AI In Education Market Snapshot Educational Transformation Through AI SS V. Slidegeeks has designed a range of layouts that are perfect for representing task or activity duration, keeping track of all your deadlines at a glance. Tailor these designs to your exact needs and give them a truly corporate look with your own brand colors they will make your projects stand out from the rest This slide showcases market analysis snapshot of generative artificial intelligence in education market, referable for investors and businesses interested in this industry. It provides details about personalized learning, tutoring systems, etc.

Marketing Growth Strategy Performance Dashboard To Measure Marketing Strategy SS V
The following slide outlines key performance indicator KPI dashboard that can assist digital marketers to evaluate marketing campaign performance. The success metrics outlined in slide are total spend on advertisement, cost per thousand CPM, cost per click CPC, click-through rate CTR, etc. Take your projects to the next level with our ultimate collection of Marketing Growth Strategy Performance Dashboard To Measure Marketing Strategy SS V. Slidegeeks has designed a range of layouts that are perfect for representing task or activity duration, keeping track of all your deadlines at a glance. Tailor these designs to your exact needs and give them a truly corporate look with your own brand colors they will make your projects stand out from the rest The following slide outlines key performance indicator KPI dashboard that can assist digital marketers to evaluate marketing campaign performance. The success metrics outlined in slide are total spend on advertisement, cost per thousand CPM, cost per click CPC, click-through rate CTR, etc.
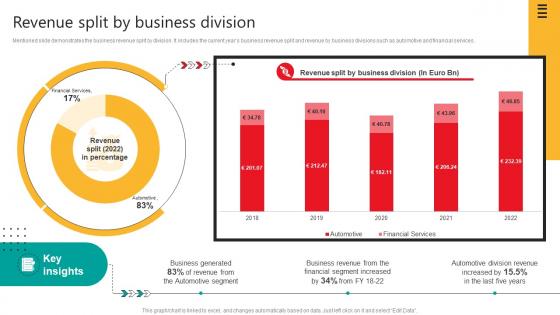
Revenue Split By Business Division Automobile Development Company Profile CP SS V
Mentioned slide demonstrates the business revenue split by division. It includes the current years business revenue split and revenue by business divisions such as automotive and financial services.Take your projects to the next level with our ultimate collection of Revenue Split By Business Division Automobile Development Company Profile CP SS V. Slidegeeks has designed a range of layouts that are perfect for representing task or activity duration, keeping track of all your deadlines at a glance. Tailor these designs to your exact needs and give them a truly corporate look with your own brand colors they will make your projects stand out from the rest Mentioned slide demonstrates the business revenue split by division. It includes the current years business revenue split and revenue by business divisions such as automotive and financial services.
Driving Results Designing A Team Training And Development Program Tracking Dashboard
This slide depicts team development program tracking dashboard to analyze the impact of implementing training plan for the members. It includes training satisfaction rate, engagement score, drop-out rate and top 5 trainees. Take your projects to the next level with our ultimate collection of Driving Results Designing A Team Training And Development Program Tracking Dashboard. Slidegeeks has designed a range of layouts that are perfect for representing task or activity duration, keeping track of all your deadlines at a glance. Tailor these designs to your exact needs and give them a truly corporate look with your own brand colors they will make your projects stand out from the rest This slide depicts team development program tracking dashboard to analyze the impact of implementing training plan for the members. It includes training satisfaction rate, engagement score, drop-out rate and top 5 trainees.
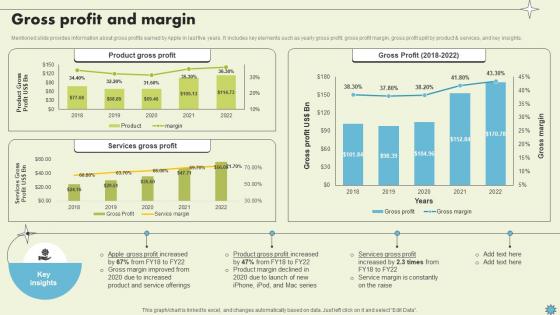
Gross Profit And Margin Consumer Electronics Company Profile CP SS V
Mentioned slide provides information about gross profits earned by Apple in last five years. It includes key elements such as yearly gross profit, gross profit margin, gross profit split by product and services, and key insights.Take your projects to the next level with our ultimate collection of Gross Profit And Margin Consumer Electronics Company Profile CP SS V. Slidegeeks has designed a range of layouts that are perfect for representing task or activity duration, keeping track of all your deadlines at a glance. Tailor these designs to your exact needs and give them a truly corporate look with your own brand colors they will make your projects stand out from the rest Mentioned slide provides information about gross profits earned by Apple in last five years. It includes key elements such as yearly gross profit, gross profit margin, gross profit split by product and services, and key insights.
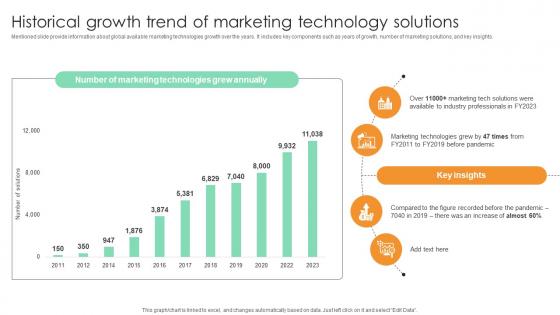
Historical Growth Trend Of Marketing Technology Comprehensive Guide For Marketing Technology
Mentioned slide provide information about global available marketing technologies growth over the years. It includes key components such as years of growth, number of marketing solutions, and key insights. Take your projects to the next level with our ultimate collection of Historical Growth Trend Of Marketing Technology Comprehensive Guide For Marketing Technology. Slidegeeks has designed a range of layouts that are perfect for representing task or activity duration, keeping track of all your deadlines at a glance. Tailor these designs to your exact needs and give them a truly corporate look with your own brand colors they will make your projects stand out from the rest Mentioned slide provide information about global available marketing technologies growth over the years. It includes key components such as years of growth, number of marketing solutions, and key insights.
Dashboard Analysis For Tracking Agricultural Tasks Adopting Sustainable Farming Techniques
This slide showcases the KPIs that would help to track the improvements with adoption of new sustainable agriculture practices. It includes current tasks, crops, harvest, todays weather, summary, etc. Take your projects to the next level with our ultimate collection of Dashboard Analysis For Tracking Agricultural Tasks Adopting Sustainable Farming Techniques. Slidegeeks has designed a range of layouts that are perfect for representing task or activity duration, keeping track of all your deadlines at a glance. Tailor these designs to your exact needs and give them a truly corporate look with your own brand colors they will make your projects stand out from the rest This slide showcases the KPIs that would help to track the improvements with adoption of new sustainable agriculture practices. It includes current tasks, crops, harvest, todays weather, summary, etc.

Perform Comprehensive Keyword Research Top Of The Funnel Digital Content Strategy SS V
The following slide represents key outcomes of detailed keyword research to direct efforts to fulfill customer demand. It includes elements such as volume, intent, results, keyword variation, keyword difficulty, cost per click CPC etc. Take your projects to the next level with our ultimate collection of Perform Comprehensive Keyword Research Top Of The Funnel Digital Content Strategy SS V. Slidegeeks has designed a range of layouts that are perfect for representing task or activity duration, keeping track of all your deadlines at a glance. Tailor these designs to your exact needs and give them a truly corporate look with your own brand colors they will make your projects stand out from the rest The following slide represents key outcomes of detailed keyword research to direct efforts to fulfill customer demand. It includes elements such as volume, intent, results, keyword variation, keyword difficulty, cost per click CPC etc.

Telemedicine Industry Analysis Across Latin America Remote Healthcare Services IR SS V
This slide showcases the Telemedicine industry analysis of Latin America region which includes factors that contribute this regions growth such as increasing aging population. It also includes market players operating in this region. Take your projects to the next level with our ultimate collection of Telemedicine Industry Analysis Across Latin America Remote Healthcare Services IR SS V. Slidegeeks has designed a range of layouts that are perfect for representing task or activity duration, keeping track of all your deadlines at a glance. Tailor these designs to your exact needs and give them a truly corporate look with your own brand colors they will make your projects stand out from the rest This slide showcases the Telemedicine industry analysis of Latin America region which includes factors that contribute this regions growth such as increasing aging population. It also includes market players operating in this region.

Graph Illustrating Impact Of Prescriptive Analytics Data Analytics SS V
This slide showcases graph highlighting impact analysis of prescriptive analytics on businesses via use of major performance indicators. It provides information total revenue, inventory levels and labour costs with key insights.Take your projects to the next level with our ultimate collection of Graph Illustrating Impact Of Prescriptive Analytics Data Analytics SS V. Slidegeeks has designed a range of layouts that are perfect for representing task or activity duration, keeping track of all your deadlines at a glance. Tailor these designs to your exact needs and give them a truly corporate look with your own brand colors they will make your projects stand out from the rest This slide showcases graph highlighting impact analysis of prescriptive analytics on businesses via use of major performance indicators. It provides information total revenue, inventory levels and labour costs with key insights.

Segmentation Of Global Prescriptive Analytics Market Data Analytics SS V
This slide provides an overview of market segmentation of prescriptive analytics at a global level. It covers segmentation analysis based on region, data type, component and deployment with key takeaways.Take your projects to the next level with our ultimate collection of Segmentation Of Global Prescriptive Analytics Market Data Analytics SS V. Slidegeeks has designed a range of layouts that are perfect for representing task or activity duration, keeping track of all your deadlines at a glance. Tailor these designs to your exact needs and give them a truly corporate look with your own brand colors they will make your projects stand out from the rest This slide provides an overview of market segmentation of prescriptive analytics at a global level. It covers segmentation analysis based on region, data type, component and deployment with key takeaways.
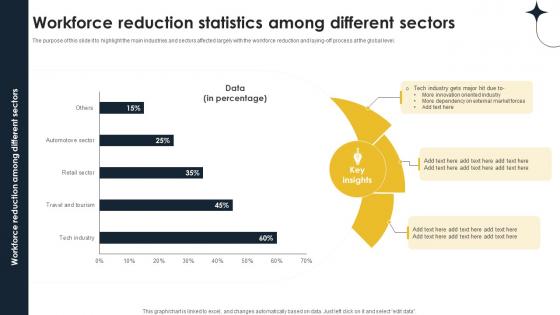
Workforce Reduction Statistics Among Different Implementing Personnel Downsizing Initiative
The purpose of this slide it to highlight the main industries and sectors affected largely with the workforce reduction and laying-off process at the global level. Take your projects to the next level with our ultimate collection of Workforce Reduction Statistics Among Different Implementing Personnel Downsizing Initiative. Slidegeeks has designed a range of layouts that are perfect for representing task or activity duration, keeping track of all your deadlines at a glance. Tailor these designs to your exact needs and give them a truly corporate look with your own brand colors they will make your projects stand out from the rest The purpose of this slide it to highlight the main industries and sectors affected largely with the workforce reduction and laying-off process at the global level.
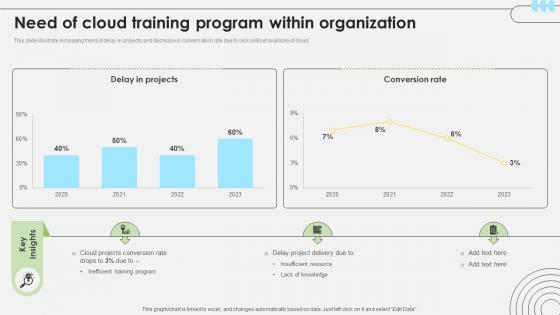
Workforce Competency Enhancement Need Of Cloud Training Program Within Organization DTE SS V
This slide illustrate increasing trend of delay in projects and decrease in conversation rate due to lack skillset available of cloud. The Workforce Competency Enhancement Need Of Cloud Training Program Within Organization DTE SS V is a compilation of the most recent design trends as a series of slides. It is suitable for any subject or industry presentation, containing attractive visuals and photo spots for businesses to clearly express their messages. This template contains a variety of slides for the user to input data, such as structures to contrast two elements, bullet points, and slides for written information. Slidegeeks is prepared to create an impression. This slide illustrate increasing trend of delay in projects and decrease in conversation rate due to lack skillset available of cloud.
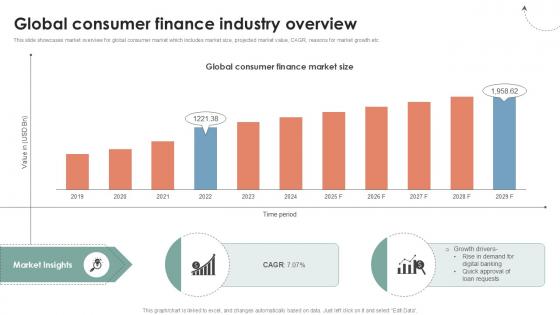
Global Consumer Finance Industry Overview Ppt Presentation CRP DK SS V
This slide showcases market overview for global consumer market which includes market size, projected market value, CAGR, reasons for market growth etc. Present like a pro with Global Consumer Finance Industry Overview Ppt Presentation CRP DK SS V. Create beautiful presentations together with your team, using our easy-to-use presentation slides. Share your ideas in real-time and make changes on the fly by downloading our templates. So whether you are in the office, on the go, or in a remote location, you can stay in sync with your team and present your ideas with confidence. With Slidegeeks presentation got a whole lot easier. Grab these presentations today. This slide showcases market overview for global consumer market which includes market size, projected market value, CAGR, reasons for market growth etc.

Portfolio Allocation Evaluation Based On Annual Return Investment Fund PPT PowerPoint
Mentioned slide provides information about evaluation of returns from various portfolio investment combination options.It includes returns KPIs such as average annual return, lowest returns, highest returns, past 20 years returns best and worst. Take your projects to the next level with our ultimate collection of Portfolio Allocation Evaluation Based On Annual Return Investment Fund PPT PowerPoint. Slidegeeks has designed a range of layouts that are perfect for representing task or activity duration, keeping track of all your deadlines at a glance. Tailor these designs to your exact needs and give them a truly corporate look with your own brand colors they will make your projects stand out from the rest Mentioned slide provides information about evaluation of returns from various portfolio investment combination options.It includes returns KPIs such as average annual return, lowest returns, highest returns, past 20 years returns best and worst.
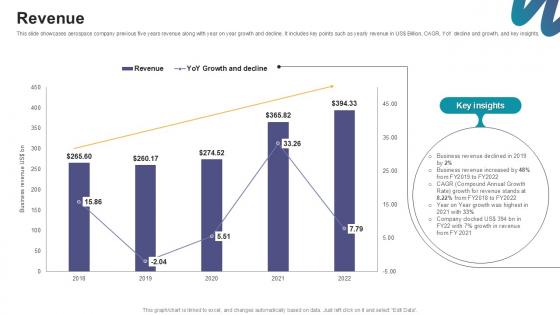
Revenue Digital Marketings Strategies PPT Sample CP SS V
This slide showcases aerospace company previous five years revenue along with year on year growth and decline. It includes key points such as yearly revenue in US Billion, CAGR, YoY decline and growth, and key insights. Take your projects to the next level with our ultimate collection of Revenue Digital Marketings Strategies PPT Sample CP SS V. Slidegeeks has designed a range of layouts that are perfect for representing task or activity duration, keeping track of all your deadlines at a glance. Tailor these designs to your exact needs and give them a truly corporate look with your own brand colors they will make your projects stand out from the rest This slide showcases aerospace company previous five years revenue along with year on year growth and decline. It includes key points such as yearly revenue in US Billion, CAGR, YoY decline and growth, and key insights.
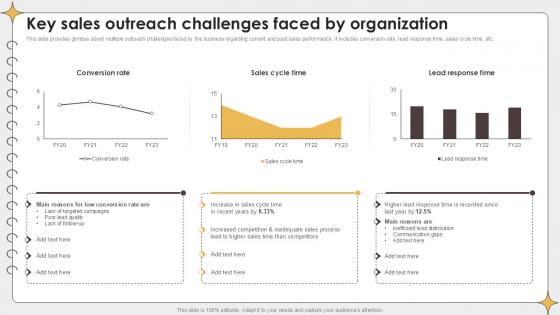
Key Sales Outreach Challenges Planning Outreach Campaigns PPT Example
This slide provides glimpse about multiple outreach challenges faced by the business regarding current and past sales performance. It includes conversion rate, lead response time, sales cycle time, etc. Take your projects to the next level with our ultimate collection of Key Sales Outreach Challenges Planning Outreach Campaigns PPT Example. Slidegeeks has designed a range of layouts that are perfect for representing task or activity duration, keeping track of all your deadlines at a glance. Tailor these designs to your exact needs and give them a truly corporate look with your own brand colors they will make your projects stand out from the rest This slide provides glimpse about multiple outreach challenges faced by the business regarding current and past sales performance. It includes conversion rate, lead response time, sales cycle time, etc.
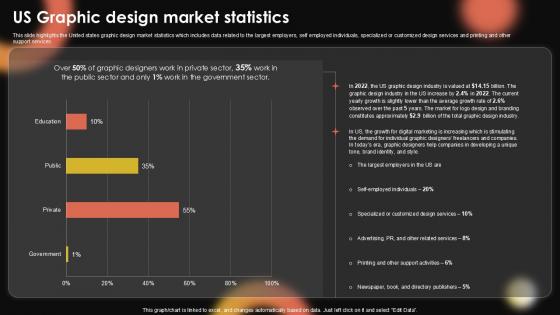
US Graphic Design Market Sample Pentagram Business Plan PPT Template BP SS V
This slide highlights the United states graphic design market statistics which includes data related to the largest employers, self employed individuals, specialized or customized design services and printing and other support services. Take your projects to the next level with our ultimate collection of US Graphic Design Market Sample Pentagram Business Plan PPT Template BP SS V. Slidegeeks has designed a range of layouts that are perfect for representing task or activity duration, keeping track of all your deadlines at a glance. Tailor these designs to your exact needs and give them a truly corporate look with your own brand colors they will make your projects stand out from the rest This slide highlights the United states graphic design market statistics which includes data related to the largest employers, self employed individuals, specialized or customized design services and printing and other support services.

Market Potential Plant Based Eggs Developing Company Investor PPT Example
This slide shows information regarding the market potential or opportunity available for the company in current market. It also includes details regarding compound annual growth rate. Take your projects to the next level with our ultimate collection of Market Potential Plant Based Eggs Developing Company Investor PPT Example. Slidegeeks has designed a range of layouts that are perfect for representing task or activity duration, keeping track of all your deadlines at a glance. Tailor these designs to your exact needs and give them a truly corporate look with your own brand colors they will make your projects stand out from the rest This slide shows information regarding the market potential or opportunity available for the company in current market. It also includes details regarding compound annual growth rate.

Human Resource Sickness And Absenteeism Monthly Report PPT PowerPoint SS
This slide represents the monthly sickness and absenteeism report prepared by the human resource department of the organization. It includes details related to the lost time, days total head count, cost of absences, sickness etc. Take your projects to the next level with our ultimate collection of Human Resource Sickness And Absenteeism Monthly Report PPT PowerPoint SS. Slidegeeks has designed a range of layouts that are perfect for representing task or activity duration, keeping track of all your deadlines at a glance. Tailor these designs to your exact needs and give them a truly corporate look with your own brand colors they will make your projects stand out from the rest This slide represents the monthly sickness and absenteeism report prepared by the human resource department of the organization. It includes details related to the lost time, days total head count, cost of absences, sickness etc.

Workforce Monthly Performance Report Of Human Resource Department PPT Example SS
This slide represents the monthly performance report of the employees prepared by the human resource department of the organization. It includes details related to the average score, best performer, worst performed, best and worst department, department review etc. Take your projects to the next level with our ultimate collection of Workforce Monthly Performance Report Of Human Resource Department PPT Example SS. Slidegeeks has designed a range of layouts that are perfect for representing task or activity duration, keeping track of all your deadlines at a glance. Tailor these designs to your exact needs and give them a truly corporate look with your own brand colors they will make your projects stand out from the rest This slide represents the monthly performance report of the employees prepared by the human resource department of the organization. It includes details related to the average score, best performer, worst performed, best and worst department, department review etc.
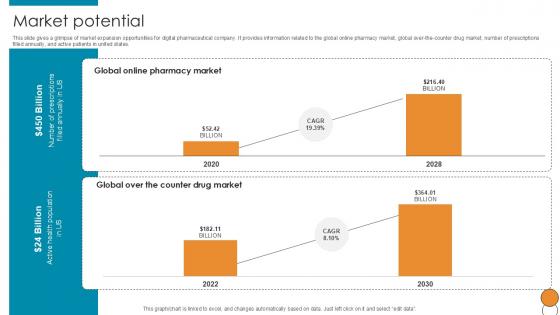
Market Potential Digital Pharmacy Company Investor Funding Ppt Template
This slide gives a glimpse of market expansion opportunities for digital pharmaceutical company. It provides information related to the global online pharmacy market, global over-the-counter drug market, number of prescriptions filled annually, and active patients in united states. Take your projects to the next level with our ultimate collection of Market Potential Digital Pharmacy Company Investor Funding Ppt Template. Slidegeeks has designed a range of layouts that are perfect for representing task or activity duration, keeping track of all your deadlines at a glance. Tailor these designs to your exact needs and give them a truly corporate look with your own brand colors they will make your projects stand out from the rest This slide gives a glimpse of market expansion opportunities for digital pharmaceutical company. It provides information related to the global online pharmacy market, global over-the-counter drug market, number of prescriptions filled annually, and active patients in united states.
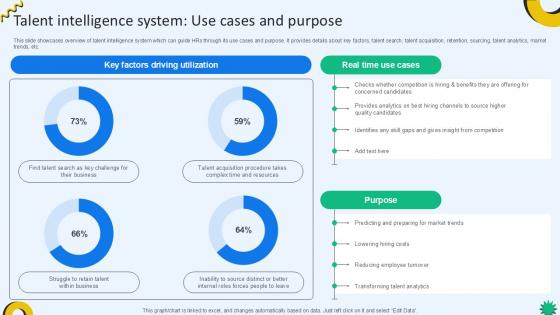
Talent Intelligence System Use Cases Cloud Recruiting Technologies PPT Slide
This slide showcases overview of talent intelligence system which can guide HRs through its use cases and purpose. It provides details about key factors, talent search, talent acquisition, retention, sourcing, talent analytics, market trends, etc. Take your projects to the next level with our ultimate collection of Talent Intelligence System Use Cases Cloud Recruiting Technologies PPT Slide. Slidegeeks has designed a range of layouts that are perfect for representing task or activity duration, keeping track of all your deadlines at a glance. Tailor these designs to your exact needs and give them a truly corporate look with your own brand colors they will make your projects stand out from the rest This slide showcases overview of talent intelligence system which can guide HRs through its use cases and purpose. It provides details about key factors, talent search, talent acquisition, retention, sourcing, talent analytics, market trends, etc.
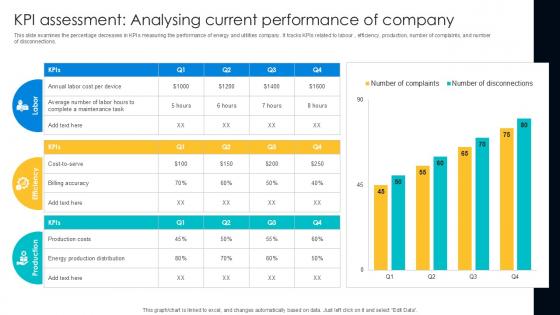
KPI Assessment Analysing Current Digital Transformation Journey PPT Slide DT SS V
This slide examines the percentage decreases in KPIs measuring the performance of energy and utilities company. It tracks KPIs related to labour , efficiency, production, number of complaints, and number of disconnections. Take your projects to the next level with our ultimate collection of KPI Assessment, Analysing Current Performance, Company. Slidegeeks has designed a range of layouts that are perfect for representing task or activity duration, keeping track of all your deadlines at a glance. Tailor these designs to your exact needs and give them a truly corporate look with your own brand colors they will make your projects stand out from the rest This slide examines the percentage decreases in KPIs measuring the performance of energy and utilities company. It tracks KPIs related to labour , efficiency, production, number of complaints, and number of disconnections.
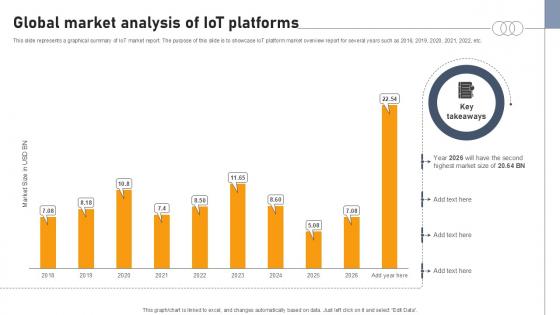
Global Market Analysis Of Iot Platforms Aws IOT Platform Ppt Template
This slide represents a graphical summary of IoT market report. The purpose of this slide is to showcase IoT platform market overview report for several years such as 2018, 2019, 2020, 2021, 2022, etc. Take your projects to the next level with our ultimate collection of Global Market Analysis Of Iot Platforms Aws IOT Platform Ppt Template Slidegeeks has designed a range of layouts that are perfect for representing task or activity duration, keeping track of all your deadlines at a glance. Tailor these designs to your exact needs and give them a truly corporate look with your own brand colors they will make your projects stand out from the rest This slide represents a graphical summary of IoT market report. The purpose of this slide is to showcase IoT platform market overview report for several years such as 2018, 2019, 2020, 2021, 2022, etc.
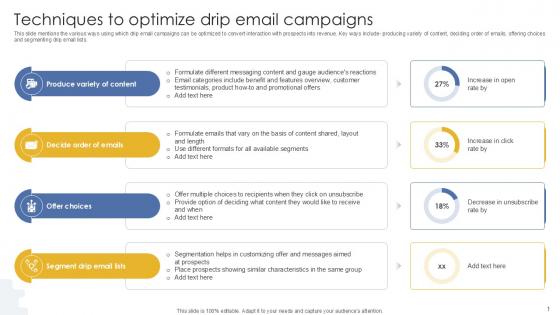
Techniques To Optimize Drip Email Campaigns PPT Sample MKT SS V
This slide mentions the various ways using which drip email campaigns can be optimized to convert interaction with prospects into revenue. Key ways include- producing variety of content, deciding order of emails, offering choices and segmenting drip email lists. Take your projects to the next level with our ultimate collection of Techniques To Optimize Drip Email Campaigns PPT Sample MKT SS V. Slidegeeks has designed a range of layouts that are perfect for representing task or activity duration, keeping track of all your deadlines at a glance. Tailor these designs to your exact needs and give them a truly corporate look with your own brand colors they will make your projects stand out from the rest This slide mentions the various ways using which drip email campaigns can be optimized to convert interaction with prospects into revenue. Key ways include- producing variety of content, deciding order of emails, offering choices and segmenting drip email lists.
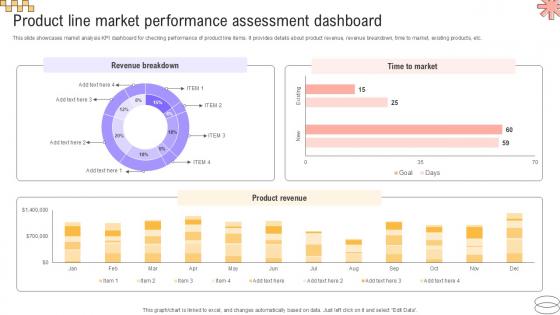
Product Line Market Performance Implementing Geographic Extension PPT Slide Strategy SS V
This slide showcases market analysis KPI dashboard for checking performance of product line items. It provides details about product revenue, revenue breakdown, time to market, existing products, etc. Take your projects to the next level with our ultimate collection of Product Line Market Performance Implementing Geographic Extension PPT Slide Strategy SS V. Slidegeeks has designed a range of layouts that are perfect for representing task or activity duration, keeping track of all your deadlines at a glance. Tailor these designs to your exact needs and give them a truly corporate look with your own brand colors they will make your projects stand out from the rest This slide showcases market analysis KPI dashboard for checking performance of product line items. It provides details about product revenue, revenue breakdown, time to market, existing products, etc.

Shareholder Ownership Structure Food Retailer Company Profile Ppt Sample CP SS V
Mentioned slide demonstrates McDonalds ownership distribution by number of shares held. It includes list of top shareholders, percentage of stakes held, and number of shares owned. Take your projects to the next level with our ultimate collection of Shareholder Ownership Structure Food Retailer Company Profile Ppt Sample CP SS V Slidegeeks has designed a range of layouts that are perfect for representing task or activity duration, keeping track of all your deadlines at a glance. Tailor these designs to your exact needs and give them a truly corporate look with your own brand colors they will make your projects stand out from the rest Mentioned slide demonstrates McDonalds ownership distribution by number of shares held. It includes list of top shareholders, percentage of stakes held, and number of shares owned.
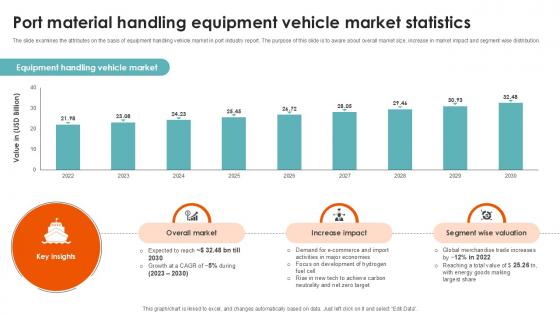
Port Material Handling Equipment Port Terminal Industry Ppt Example
The slide examines the attributes on the basis of equipment handling vehicle market in port industry report. The purpose of this slide is to aware about overall market size, increase in market impact and segment wise distribution.Take your projects to the next level with our ultimate collection of Port Material Handling Equipment Port Terminal Industry Ppt Example. Slidegeeks has designed a range of layouts that are perfect for representing task or activity duration, keeping track of all your deadlines at a glance. Tailor these designs to your exact needs and give them a truly corporate look with your own brand colors they will make your projects stand out from the rest The slide examines the attributes on the basis of equipment handling vehicle market in port industry report. The purpose of this slide is to aware about overall market size, increase in market impact and segment wise distribution.

Statistics Highlighting Food Packaging Effective Strategies For Strengthening Food Ppt Slide
The slide showcases statistics that represent positive impact of food packaging initiated on purchasing decisions made by consumers in marketplace. The slide contains points related to packaging design, labelling etc.Take your projects to the next level with our ultimate collection of Statistics Highlighting Food Packaging Effective Strategies For Strengthening Food Ppt Slide. Slidegeeks has designed a range of layouts that are perfect for representing task or activity duration, keeping track of all your deadlines at a glance. Tailor these designs to your exact needs and give them a truly corporate look with your own brand colors they will make your projects stand out from the rest The slide showcases statistics that represent positive impact of food packaging initiated on purchasing decisions made by consumers in marketplace. The slide contains points related to packaging design, labelling etc.
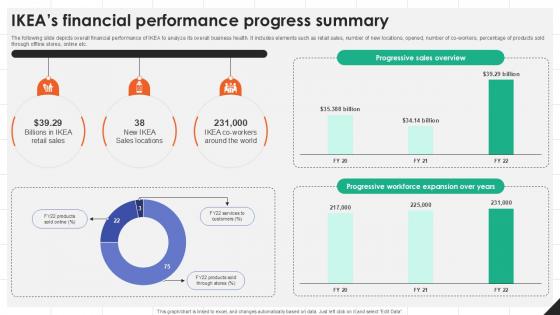
IKEAs Financial Performance Progress IKEAs Successful Market Expansion PPT Sample Strategy SS V
The following slide depicts overall financial performance of IKEA to analyze its overall business health. It includes elements such as retail sales, number of new locations, opened, number of co-workers, percentage of products sold through offline stores, online etc. Take your projects to the next level with our ultimate collection of IKEAs Financial Performance Progress IKEAs Successful Market Expansion PPT Sample Strategy SS V. Slidegeeks has designed a range of layouts that are perfect for representing task or activity duration, keeping track of all your deadlines at a glance. Tailor these designs to your exact needs and give them a truly corporate look with your own brand colors they will make your projects stand out from the rest The following slide depicts overall financial performance of IKEA to analyze its overall business health. It includes elements such as retail sales, number of new locations, opened, number of co-workers, percentage of products sold through offline stores, online etc.
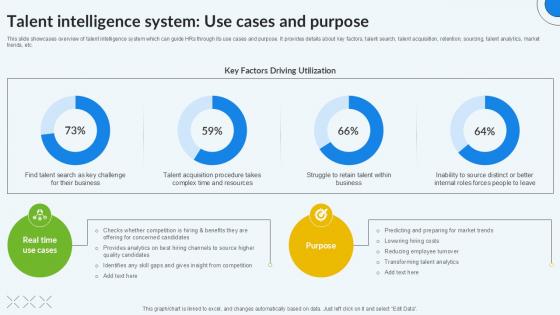
Talent Intelligence System Use Enhancing Recruitment Process PPT Presentation
This slide showcases overview of talent intelligence system which can guide HRs through its use cases and purpose. It provides details about key factors, talent search, talent acquisition, retention, sourcing, talent analytics, market trends, etc. Take your projects to the next level with our ultimate collection of Talent Intelligence System Use Enhancing Recruitment Process PPT Presentation. Slidegeeks has designed a range of layouts that are perfect for representing task or activity duration, keeping track of all your deadlines at a glance. Tailor these designs to your exact needs and give them a truly corporate look with your own brand colors they will make your projects stand out from the rest This slide showcases overview of talent intelligence system which can guide HRs through its use cases and purpose. It provides details about key factors, talent search, talent acquisition, retention, sourcing, talent analytics, market trends, etc.
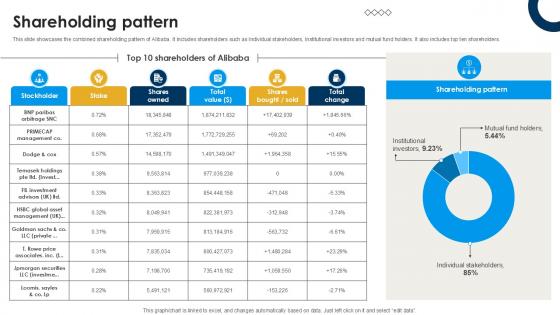
Shareholding Pattern International Trade Of Products And Services PPT PowerPoint CP SS V
This slide showcases the combined shareholding pattern of Alibaba. It includes shareholders such as Individual stakeholders, Institutional investors and mutual fund holders. It also includes top ten shareholders. Take your projects to the next level with our ultimate collection of Shareholding Pattern International Trade Of Products And Services PPT PowerPoint CP SS V. Slidegeeks has designed a range of layouts that are perfect for representing task or activity duration, keeping track of all your deadlines at a glance. Tailor these designs to your exact needs and give them a truly corporate look with your own brand colors they will make your projects stand out from the rest This slide showcases the combined shareholding pattern of Alibaba. It includes shareholders such as Individual stakeholders, Institutional investors and mutual fund holders. It also includes top ten shareholders.

Six Sided Multicolor Hexagon Diagram Radial Process PowerPoint Templates
We present our six sided multicolor hexagon diagram Radial Process PowerPoint templates.Use our Business PowerPoint Templates because a lot of dissimilar elements needing to gel to strike the deal. Use our Marketing PowerPoint Templates because we provide the means to project your views. Use our Shapes PowerPoint Templates because getting it done may not be enough. Download our Finance PowerPoint Templates because let this slide illustrates others piggyback on you to see well over the horizon. Download our Symbol PowerPoint Templates because using our templates for your colleagues will impart knowledge to feed.Use these PowerPoint slides for presentations relating to Arrow, Background, Ball, Business, Button, Catalog, Chart, Circle, Circular, Clipart, Company, Concept, Cross, Cycle, Development, Diagram, Edit, Editable, Element, Goals, Icon, Leader, Marketing, Model, Navigation, Organization, Parts, Pie, Plans, Presentation, Report, Representation, Retro, Six, Sphere, Stakeholder, Team. The prominent colors used in the PowerPoint template are Red, Green, Blue. We assure you our six sided multicolor hexagon diagram Radial Process PowerPoint templates are Sparkling. Customers tell us our Ball PowerPoint templates and PPT Slides are designed to make your presentations professional. The feedback we get is that our six sided multicolor hexagon diagram Radial Process PowerPoint templates are Fantastic. We assure you our Circle PowerPoint templates and PPT Slides are Excellent. People tell us our six sided multicolor hexagon diagram Radial Process PowerPoint templates are designed by a team of presentation professionals. We assure you our Ball PowerPoint templates and PPT Slides are Fancy. Filter out ideas with our Six Sided Multicolor Hexagon Diagram Radial Process PowerPoint Templates. They get actionable ones to emerge.
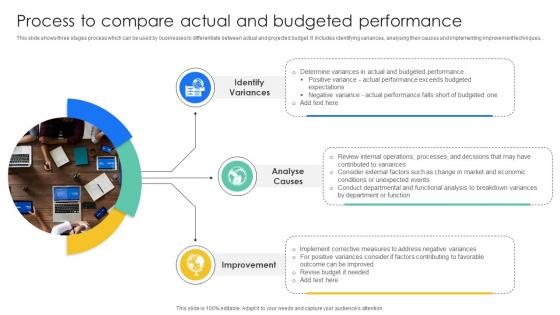
Process To Compare Actual And Budgeted Effective And Efficient Tools To Develop Fin SS V
This slide shows three stages process which can be used by businesses to differentiate between actual and projected budget. It includes identifying variances, analysing their causes and implementing improvement techniques. Do you know about Slidesgeeks Process To Compare Actual And Budgeted Effective And Efficient Tools To Develop Fin SS V These are perfect for delivering any kind od presentation. Using it, create PowerPoint presentations that communicate your ideas and engage audiences. Save time and effort by using our pre-designed presentation templates that are perfect for a wide range of topic. Our vast selection of designs covers a range of styles, from creative to business, and are all highly customizable and easy to edit. Download as a PowerPoint template or use them as Google Slides themes. This slide shows three stages process which can be used by businesses to differentiate between actual and projected budget. It includes identifying variances, analysing their causes and implementing improvement techniques. .
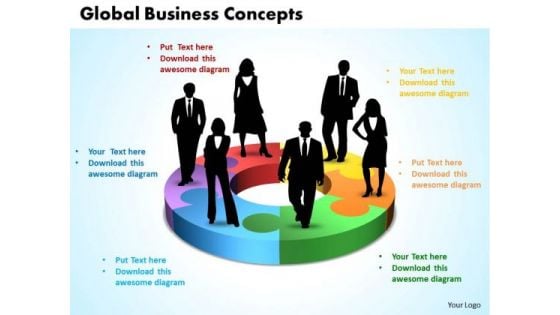
Business Marketing PowerPoint Templates Business Global Business Concepts Ppt Slides
Business Marketing PowerPoint Templates Business Global Business Concepts PPT Slides-This PowerPoint diagram will meet your all needs, Whether you managing people, projects or events. This Diagram helps you to explain six stages or concepts for Global Business.-Business Marketing PowerPoint Templates Business Global Business Concepts PPT Slides Make a name for yourself with our Business Marketing PowerPoint Templates Business Global Business Concepts Ppt Slides. You will be at the top of your game.
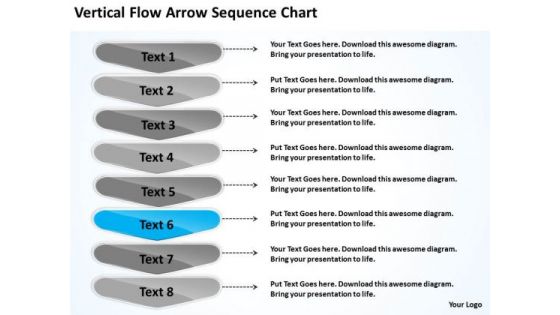
Vertical Flow Arrow Sequence Chart Outline Of Business Plan PowerPoint Templates
We present our vertical flow arrow sequence chart outline of business plan PowerPoint templates.Download our Business PowerPoint Templates because project your ideas to you colleagues and complete the full picture. Use our Marketing PowerPoint Templates because networking is an imperative in todays world. You need to access the views of others. Similarly you need to give access to them of your abilities. Present our Shapes PowerPoint Templates because our creative template will lay down your views. Download and present our Arrows PowerPoint Templates because the foundation stones of many a life. Download and present our Process and Flows PowerPoint Templates because forward thinking is the way to go.Use these PowerPoint slides for presentations relating to Arrow, assortment, attached, blank, blue,business, collection, data, direction,element, green, headline, icon,information, isolated,modern,motion, notepaper, notes, office, page,paper, perspective, pointer, post, red,reflective, reminder, ripped, set,shadow, shiny, sign, striped, symbol, . The prominent colors used in the PowerPoint template are White, Gray, Blue light. PowerPoint presentation experts tell us our vertical flow arrow sequence chart outline of business plan PowerPoint templates are Spiffy. PowerPoint presentation experts tell us our business PowerPoint templates and PPT Slides are designed to make your presentations professional. You can be sure our vertical flow arrow sequence chart outline of business plan PowerPoint templates are Efficacious. You can be sure our collection PowerPoint templates and PPT Slides are incredible easy to use. PowerPoint presentation experts tell us our vertical flow arrow sequence chart outline of business plan PowerPoint templates are Luxurious. People tell us our attached PowerPoint templates and PPT Slides are Adorable. Launch your campaign with our Vertical Flow Arrow Sequence Chart Outline Of Business Plan PowerPoint Templates. Make sure your presentation gets the attention it deserves.
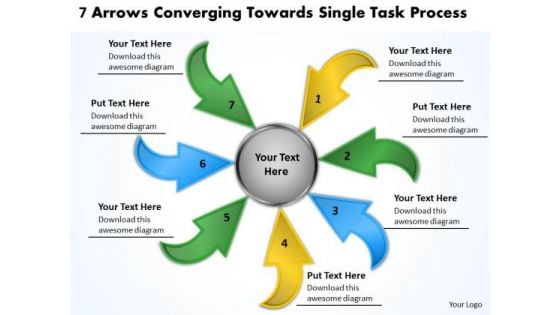
7 Arrows Converging Towards Single Task Process Relative Cycle Chart PowerPoint Slides
We present our 7 arrows converging towards single task process Relative Cycle Chart PowerPoint Slides.Use our Arrows PowerPoint Templates because our templates illustrates your ability. Download and present our Circle Charts PowerPoint Templates because motivating your team will cross all barriers. Present our Shapes PowerPoint Templates because you are buzzing with ideas. Present our Business PowerPoint Templates because it helps you to project your enthusiasm and single mindedness to your colleagues. Download and present our Flow Charts PowerPoint Templates because you will surely see all making the grade.Use these PowerPoint slides for presentations relating to 3d, aggregate, arrow, assemble, associate, burn, center, centre, circle, collect, compact, compress, concentrate, congregate, connect, converge, direction, draw, fire, focus, gather, glassy, glow, graphic, grey, heat, hot, hotspot, ignite, illustration, incandescent, integrate, join, merge, metal, pack, point, red, round, shiny, . The prominent colors used in the PowerPoint template are Yellow, Green, Blue. Presenters tell us our 7 arrows converging towards single task process Relative Cycle Chart PowerPoint Slides are Playful. You can be sure our circle PowerPoint templates and PPT Slides will save the presenter time. Professionals tell us our 7 arrows converging towards single task process Relative Cycle Chart PowerPoint Slides are Nice. People tell us our assemble PowerPoint templates and PPT Slides are Bright. People tell us our 7 arrows converging towards single task process Relative Cycle Chart PowerPoint Slides are Spectacular. Professionals tell us our burn PowerPoint templates and PPT Slides are Excellent. Our 7 Arrows Converging Towards Single Task Process Relative Cycle Chart PowerPoint Slides will be a crucial element. Field them with your thoughts and enjoy the effort.
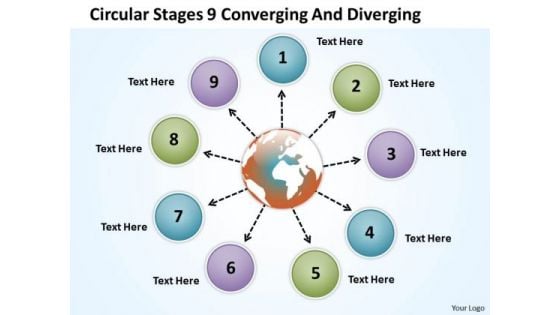
Circular Stages 9 Converging And Diverging Flow Process PowerPoint Slides
We present our circular stages 9 converging and diverging Flow Process PowerPoint Slides.Use our Circle Charts PowerPoint Templates because you understand the ailment and how to fight it. Download and present our Arrows PowerPoint Templates because some opportunities are bound to be highly profitable for you to follow up. Present our Globe PowerPoint Templates because you can get advantage to prioritise your ideas. Download and present our Business PowerPoint Templates because project your ideas to you colleagues and complete the full picture. Present our Flow Charts PowerPoint Templates because this diagram helps in examine each brilliant thought in thorough detail highlighting all the pros and cons as minutely as possible.Use these PowerPoint slides for presentations relating to abstract, arrow, business, chart, circle, circular, collection, color, continuity, cycle, decoration, design, diagram, dimensional, direction, element, flow, glossy, graph, icon, illustration, isolated, modern, motion, movement, pattern, pie, recycling, repetition, report, ring, round, scheme, section, set, shape, shiny, sign, slice, spinning, symbol, turn, vector, web. The prominent colors used in the PowerPoint template are Purple, Blue, Green. Presenters tell us our circular stages 9 converging and diverging Flow Process PowerPoint Slides are Efficient. You can be sure our business PowerPoint templates and PPT Slides will make the presenter look like a pro even if they are not computer savvy. Professionals tell us our circular stages 9 converging and diverging Flow Process PowerPoint Slides are Luxuriant. People tell us our business PowerPoint templates and PPT Slides are One-of-a-kind. People tell us our circular stages 9 converging and diverging Flow Process PowerPoint Slides are Awesome. Professionals tell us our color PowerPoint templates and PPT Slides are Reminiscent. Level the playing field with our Circular Stages 9 Converging And Diverging Flow Process PowerPoint Slides. Make sure your presentation gets the attention it deserves.
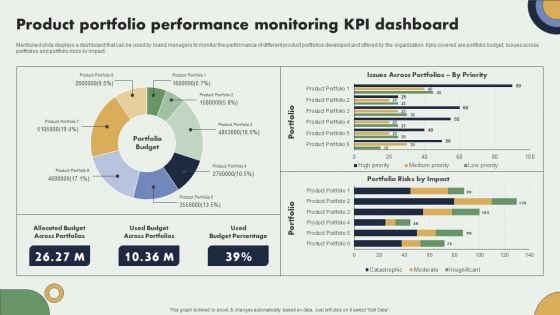
Product Portfolio Performance Monitoring Kpi Dashboard Brand Expansion Plan Slides PDF
Mentioned slide displays a dashboard that can be used by brand managers to monitor the performance of different product portfolios developed and offered by the organization. Kpis covered are portfolio budget, issues across portfolios and portfolio risks by impact.Take your projects to the next level with our ultimate collection of Product Portfolio Performance Monitoring Kpi Dashboard Brand Expansion Plan Slides PDF. Slidegeeks has designed a range of layouts that are perfect for representing task or activity duration, keeping track of all your deadlines at a glance. Tailor these designs to your exact needs and give them a truly corporate look with your own brand colors they all make your projects stand out from the rest.

Marketers Guide To Data Analysis Optimization Major Types Of Marketing Analytics Models Microsoft PDF
This slide covers three types of models to conduct marketing analytics. The mentioned models are descriptive models to identify what happened, predictive models to know what will happen, and prescriptive models to determine how to make it happen. Take your projects to the next level with our ultimate collection of Marketers Guide To Data Analysis Optimization Major Types Of Marketing Analytics Models Microsoft PDF. Slidegeeks has designed a range of layouts that are perfect for representing task or activity duration, keeping track of all your deadlines at a glance. Tailor these designs to your exact needs and give them a truly corporate look with your own brand colors they will make your projects stand out from the rest.
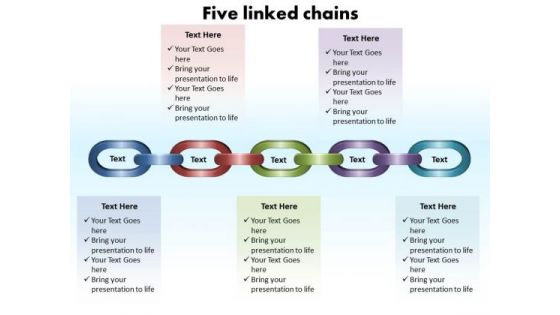
Business Marketing PowerPoint Templates Business Five Linked Chains Ppt Slides
Business Marketing PowerPoint Templates Business five linked chains PPT Slides-Linear process flow diagram is useful to visualize current projects within a certain time or periodical section-Business Marketing PowerPoint Templates Business five linked chains PPT Slides-This ppt can be used for concepts relating to-Abstract, Algorithm, Arrow, Arrow, Chart, Block, Block, Diagram, Business, Chart, Color, Connection, Design, Development, Diagram, Direction, Element, Flow, Flow, Chart, Flow, Diagram, Flowchart, Graph etc Get the dynamics correct with our PT&s. Your thoughts will initiate the right moves.
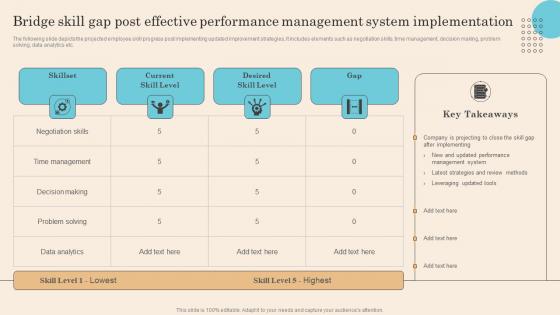
Bridge Skill Gap Post Effective Performance Management System Implementation Diagrams Pdf
The following slide depicts the projected employee skill progress post implementing updated improvement strategies, It includes elements such as negotiation skills, time management, decision making, problem solving, data analytics etc. Do you have to make sure that everyone on your team knows about any specific topic I yes, then you should give Bridge Skill Gap Post Effective Performance Management System Implementation Diagrams Pdf a try. Our experts have put a lot of knowledge and effort into creating this impeccable Bridge Skill Gap Post Effective Performance Management System Implementation Diagrams Pdf. You can use this template for your upcoming presentations, as the slides are perfect to represent even the tiniest detail. You can download these templates from the Slidegeeks website and these are easy to edit. So grab these today. The following slide depicts the projected employee skill progress post implementing updated improvement strategies, It includes elements such as negotiation skills, time management, decision making, problem solving, data analytics etc.
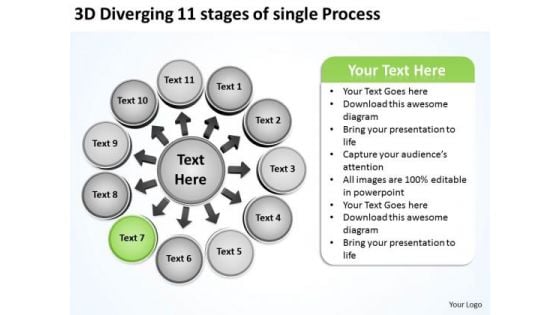
3d Diverging 11 Stages Of Single Process Circle Arrows Network Software PowerPoint Slides
We present our 3d diverging 11 stages of single process circle Arrows Network Software PowerPoint Slides.Download and present our Business PowerPoint Templates because this template can project the path to sucess that you have charted. Download our Circle charts PowerPoint Templates because by using this slide you can Heighten the anticipation of your audience listing . Download and present our Arrows PowerPoint Templates because this Slide offers an excellent background to build up the various stages of your business process. Use our Shapes PowerPoint Templates because you have to coordinate and motivate your team. Present our Flow charts PowerPoint Templates because the colour coding of our templates are specifically designed to highlight you points.Use these PowerPoint slides for presentations relating to Abstract, arrow, arrow, circle, business, concept, career, center, stage, chart, circle circle, connection, contrast, cycle, diagram, direction, flow flowchart, future, graph, icon, illustration, isolate, isolated, job, life, loop, money, motion network, recycle, refresh, ring, rotation, sick, sign, symbol, simply, target, wealth. The prominent colors used in the PowerPoint template are Green, Gray, White. People tell us our 3d diverging 11 stages of single process circle Arrows Network Software PowerPoint Slides are Zippy. PowerPoint presentation experts tell us our career PowerPoint templates and PPT Slides are Beautiful. Presenters tell us our 3d diverging 11 stages of single process circle Arrows Network Software PowerPoint Slides are Classic. PowerPoint presentation experts tell us our center PowerPoint templates and PPT Slides are incredible easy to use. People tell us our 3d diverging 11 stages of single process circle Arrows Network Software PowerPoint Slides are Luxuriant. People tell us our career PowerPoint templates and PPT Slides are visually appealing. Set your eyes on our 3d Diverging 11 Stages Of Single Process Circle Arrows Network Software PowerPoint Slides. You will find it difficult to look away.

Diverging Components A Circular Process Layout Network PowerPoint Templates
We present our diverging components a circular process Layout Network PowerPoint templates.Use our Business PowerPoint Templates because project your ideas to you colleagues and complete the full picture. Download our Circle Charts PowerPoint Templates because it shows the pyramid which is a symbol of the desire to reach the top in a steady manner. Download our Arrows PowerPoint Templates because you can Organize your thoughts and illuminate your ideas accordingly. Present our Shapes PowerPoint Templates because you have the people in place, selected the team leaders and all are raring to go. Download our Flow charts PowerPoint Templates because the Venn graphic comprising interlinking circles geometrically demonstate how various functions operating independantly, to a large extent, are essentially interdependant.Use these PowerPoint slides for presentations relating to Arrows, blank, business, central, centralized, chart, circle, circular, circulation concept, conceptual, converging, design, diagram, empty, executive, icon, idea illustration, management, map, mapping, moa, model, numbers, organization outwards, pointing, procedure, process, radial, radiating, relationship, resource sequence, sequential, seven, square, strategy, template. The prominent colors used in the PowerPoint template are Brown, Gray, Black. Presenters tell us our diverging components a circular process Layout Network PowerPoint templates are Colorful. Presenters tell us our circle PowerPoint templates and PPT Slides are Endearing. PowerPoint presentation experts tell us our diverging components a circular process Layout Network PowerPoint templates are Playful. We assure you our circular PowerPoint templates and PPT Slides are Perfect. Customers tell us our diverging components a circular process Layout Network PowerPoint templates are visually appealing. People tell us our circulation PowerPoint templates and PPT Slides are Dynamic. Our Diverging Components A Circular Process Layout Network PowerPoint Templates are exceptionally customer-centric. They put clients before everything else.

Diverging Seven Stages Explaining Concepts Circular Arrow Process PowerPoint Slides
We present our diverging seven stages explaining concepts Circular Arrow Process PowerPoint Slides.Download and present our Business PowerPoint Templates because it helps you to project your enthusiasm and single mindedness to your colleagues. Download our Circle Charts PowerPoint Templates because there is a crucial aspect that requires extra attention. Download and present our Arrows PowerPoint Templates because you have some great folks working with you, thinking with you. Download and present our Shapes PowerPoint Templates because you understand the ailment and how to fight it. Use our Flow charts PowerPoint Templates because a lot of hard work has gone in and you are almost there.Use these PowerPoint slides for presentations relating to Arrows, blank, business, central, centralized, chart, circle, circular, circulation concept, conceptual, converging, design, diagram, empty, executive, icon, idea illustration, management, map, mapping, moa, model, numbers, organization outwards, pointing, procedure, process, radial, radiating, relationship, resource sequence, sequential, seven, square, strategy, template. The prominent colors used in the PowerPoint template are Yellow, Gray, White. Presenters tell us our diverging seven stages explaining concepts Circular Arrow Process PowerPoint Slides are Versatile. Presenters tell us our circle PowerPoint templates and PPT Slides are Liberated. PowerPoint presentation experts tell us our diverging seven stages explaining concepts Circular Arrow Process PowerPoint Slides are Stunning. We assure you our central PowerPoint templates and PPT Slides are Breathtaking. Customers tell us our diverging seven stages explaining concepts Circular Arrow Process PowerPoint Slides are Sparkling. People tell us our centralized PowerPoint templates and PPT Slides are Amazing. Our Diverging Seven Stages Explaining Concepts Circular Arrow Process PowerPoint Slides are topically designed to impress. Use them to look like a presentation pro.
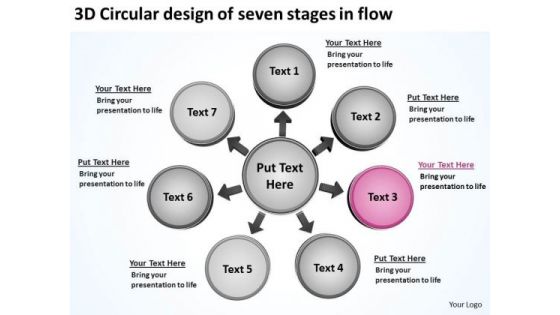
3d Circular Design Of Seven Stages In Flow Business Spoke Process PowerPoint Templates
We present our 3d circular design of seven stages in flow business Spoke Process PowerPoint templates.Download and present our Business PowerPoint Templates because the fruits of your labour are beginning to show.Enlighten them on the great plans you have for their enjoyment. Download our Circle charts PowerPoint Templates because you can Churn the wheels of the brains of your colleagues. Download and present our Arrows PowerPoint Templates because you have an idea of which you are sure. Present our Shapes PowerPoint Templates because we provide the means to project your views. Use our Flow charts PowerPoint Templates because it is in your DNA to analyse possible causes to the minutest detail.Use these PowerPoint slides for presentations relating to Abstract, arrow, arrow, circle, business, concept, career, center, stage, chart, circle circle, connection, contrast, cycle, diagram, direction, flow flowchart, future, graph, icon, illustration, isolate, isolated, job, life, loop, money, motion network, recycle, refresh, ring, rotation, sick, sign, symbol, simply, target, wealth. The prominent colors used in the PowerPoint template are Purple, Gray, White. People tell us our 3d circular design of seven stages in flow business Spoke Process PowerPoint templates are Luxurious. PowerPoint presentation experts tell us our concept PowerPoint templates and PPT Slides are Great. Presenters tell us our 3d circular design of seven stages in flow business Spoke Process PowerPoint templates are Delightful. PowerPoint presentation experts tell us our arrow PowerPoint templates and PPT Slides are Charming. People tell us our 3d circular design of seven stages in flow business Spoke Process PowerPoint templates are Magnificent. People tell us our center PowerPoint templates and PPT Slides are Playful. Motivate your team to excellent performances. Nurture their abilities through our 3d Circular Design Of Seven Stages In Flow Business Spoke Process PowerPoint Templates.


 Continue with Email

 Home
Home


