Purchasing
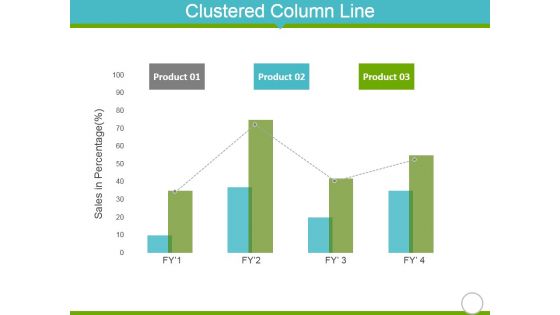
Clustered Column Line Ppt Powerpoint Presentation Slides Demonstration
This is a clustered column line ppt powerpoint presentation slides demonstration. This is a four stage process. The stages in this process are product, sales in percentage, finance, marketing.

Our Team Ppt PowerPoint Presentation File Introduction
This is a our team ppt powerpoint presentation file introduction. This is a four stage process. The stages in this process are ceo and founder, finance manager, director of sales, production manager.
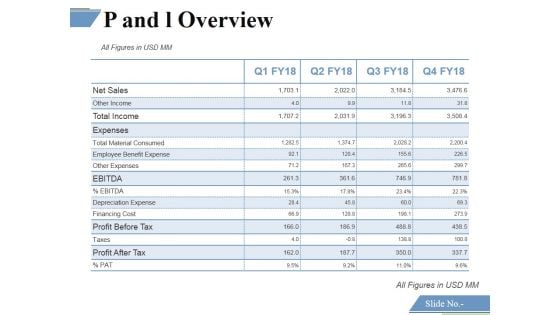
P And L Overview Template 2 Ppt PowerPoint Presentation Model Elements
This is a p and l overview template 2 ppt powerpoint presentation model elements. This is a four stage process. The stages in this process are financing cost, net sales, profit before tax, profit after tax.
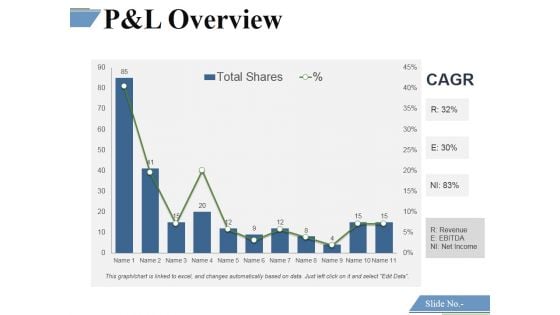
P And L Overview Template 3 Ppt PowerPoint Presentation Model Gridlines
This is a p and l overview template 3 ppt powerpoint presentation model gridlines. This is a eleven stage process. The stages in this process are financing cost, net sales, profit before tax, profit after tax.

Scatter Bubble Chart Ppt PowerPoint Presentation Professional Model
This is a scatter bubble chart ppt powerpoint presentation professional model. This is a six stage process. The stages in this process are sales in profit, financial year, growth, business, marketing, strategy.
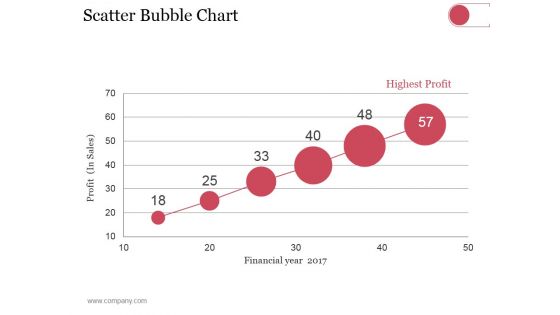
Scatter Bubble Chart Ppt PowerPoint Presentation Summary Pictures
This is a scatter bubble chart ppt powerpoint presentation summary pictures. This is a six stage process. The stages in this process are highest profit, financial year, profit in sales.
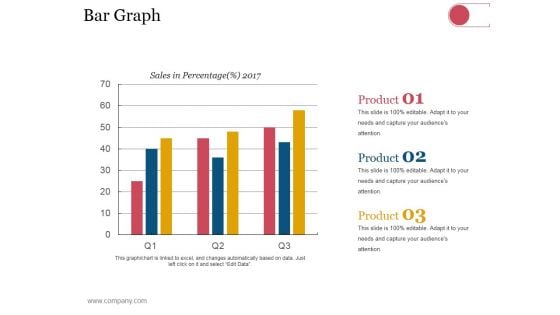
Bar Graph Ppt PowerPoint Presentation Visual Aids Model
This is a bar graph ppt powerpoint presentation visual aids model. This is a three stage process. The stages in this process are business, strategy, analysis, planning, sales in percentage.
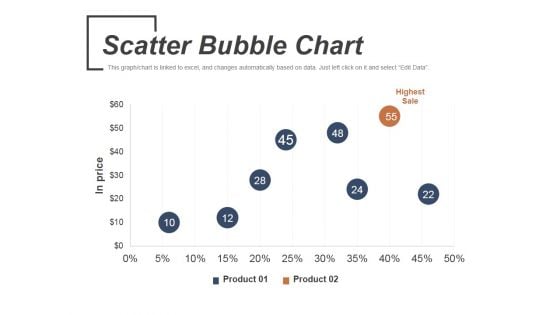
Scatter Bubble Chart Ppt PowerPoint Presentation Infographic Template Graphics
This is a scatter bubble chart ppt powerpoint presentation infographic template graphics. This is a two stage process. The stages in this process are highest sale, product, in price.
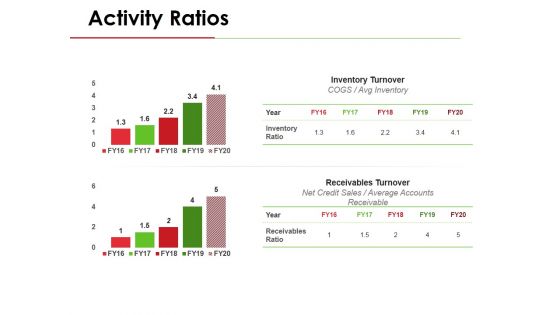
Activity Ratios Template 1 Ppt PowerPoint Presentation Pictures Graphics Example
This is a activity ratios template 1 ppt powerpoint presentation pictures graphics example. This is a two stage process. The stages in this process are inventory turnover, receivables turnover, avg inventory, net credit sales, average accounts receivable.

Activity Ratios Template 2 Ppt PowerPoint Presentation Layouts Clipart Images
This is a activity ratios template 2 ppt powerpoint presentation layouts clipart images. This is a two stage process. The stages in this process are inventory turnover, receivables turnover, avg inventory, net credit sales, average accounts receivable.
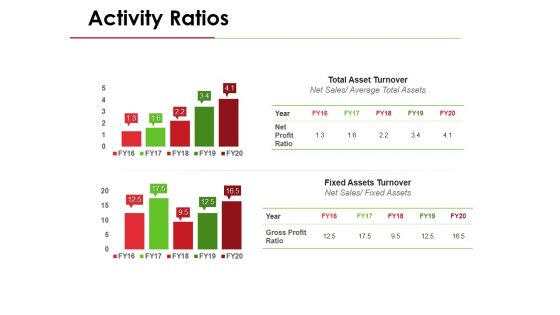
Activity Ratios Template 3 Ppt PowerPoint Presentation Inspiration Example File
This is a activity ratios template 3 ppt powerpoint presentation inspiration example file. This is a two stage process. The stages in this process are total asset turnover, net sales, average total assets, fixed assets turnover, fixed assets.
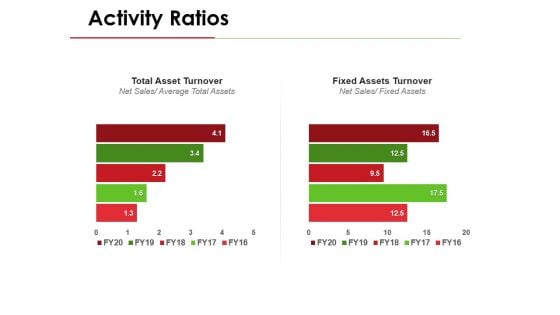
Activity Ratios Template 4 Ppt PowerPoint Presentation Ideas Objects
This is a activity ratios template 4 ppt powerpoint presentation ideas objects. This is a two stage process. The stages in this process are total asset turnover, net sales, average total assets, fixed assets turnover, fixed assets.

Financial Projections Income Statement Ppt PowerPoint Presentation Inspiration Vector
This is a financial projections income statement ppt powerpoint presentation inspiration vector. This is a four stage process. The stages in this process are net sales, expenses, cost of goods sold, employee benefit expense, financing cost.
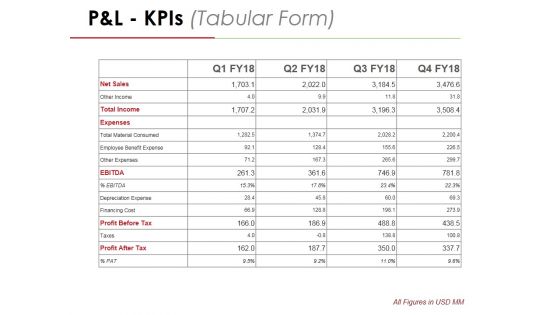
P And L Kpis Template 2 Ppt PowerPoint Presentation Professional Graphics
This is a p and l kpis template 2 ppt powerpoint presentation professional graphics. This is a four stage process. The stages in this process are net sales, other income, total income, expenses, total material consumed.
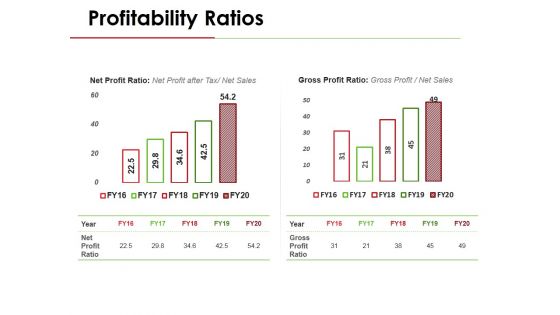
Profitability Ratios Template 1 Ppt PowerPoint Presentation Inspiration Graphics Pictures
This is a profitability ratios template 1 ppt powerpoint presentation inspiration graphics pictures. This is a two stage process. The stages in this process are net profit ratio, net profit after tax, net sales, gross profit ratio.
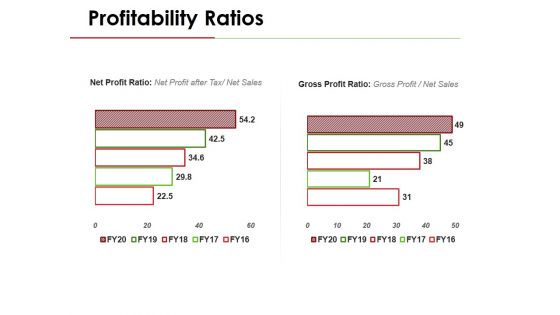
Profitability Ratios Template 2 Ppt PowerPoint Presentation Professional Slide
This is a profitability ratios template 2 ppt powerpoint presentation professional slide. This is a two stage process. The stages in this process are net profit ratio, net profit after tax, net sales, gross profit ratio.
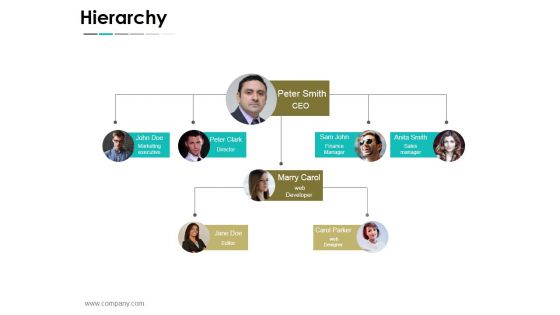
Hierarchy Ppt PowerPoint Presentation Summary Background
This is a hierarchy ppt powerpoint presentation summary background. This is a four stage process. The stages in this process are marketing executive, director, finance manager, sales manager, web developer, editor.
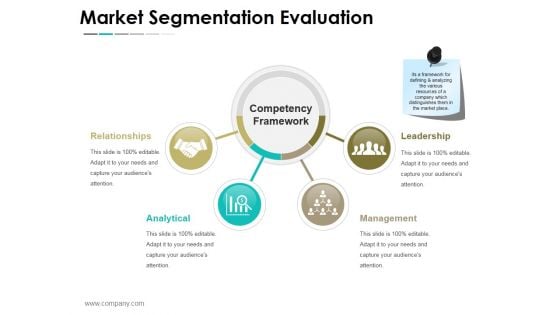
Market Segmentation Evaluation Ppt PowerPoint Presentation Layouts Images
This is a market segmentation evaluation ppt powerpoint presentation layouts images. This is a two stage process. The stages in this process are market sales, net profit, confectionary, milk products, beverages, nutrition and health care.
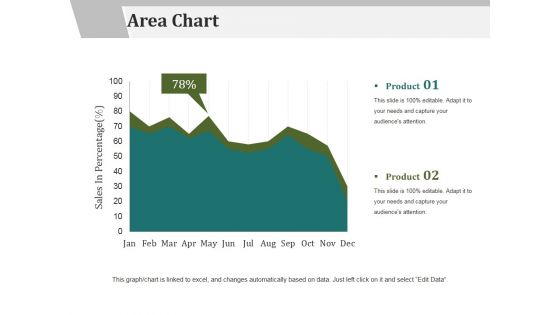
Area Chart Ppt PowerPoint Presentation Infographics Graphics Tutorials
This is a area chart ppt powerpoint presentation infographics graphics tutorials. This is a two stage process. The stages in this process are product, area chart, sales in percentage.
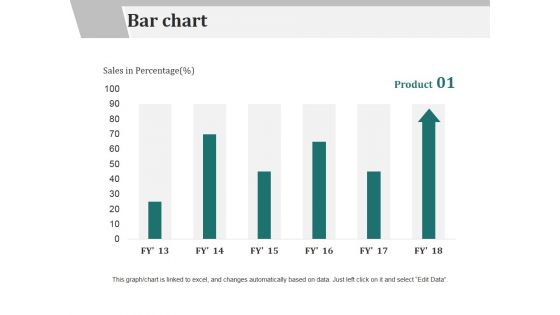
Bar Chart Ppt PowerPoint Presentation Slides Design Ideas
This is a bar chart ppt powerpoint presentation slides design ideas. This is a six stage process. The stages in this process are product, bar chart, sales in percentage.
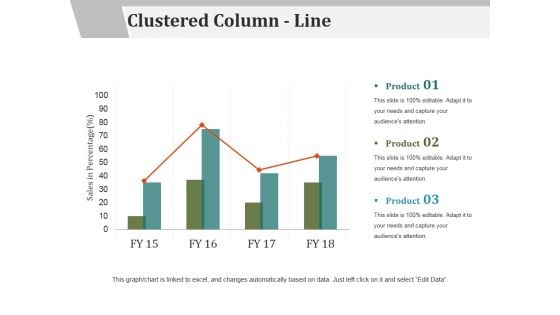
Clustered Column Line Ppt PowerPoint Presentation File Examples
This is a clustered column line ppt powerpoint presentation file examples. This is a three stage process. The stages in this process are sales in percentage, product, business, marketing, success.
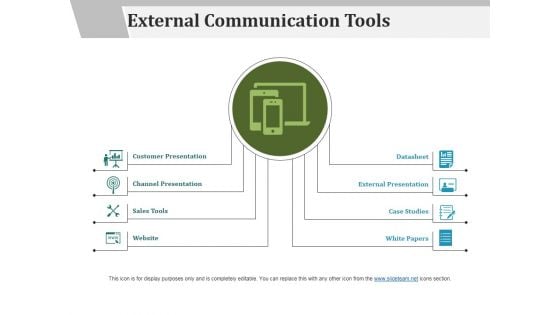
External Communication Tools Ppt PowerPoint Presentation Pictures Guidelines
This is a external communication tools ppt powerpoint presentation pictures guidelines. This is a eight stage process. The stages in this process are customer presentation, channel presentation, sales tools, website, datasheet.
Plan And Pricing Ppt PowerPoint Presentation Icon Templates
This is a plan and pricing ppt powerpoint presentation icon templates. This is a three stage process. The stages in this process are package, pricing, business, sales, success, strategy.

Projected Key Financials Template 1 Ppt PowerPoint Presentation Infographic Template Graphics
This is a projected key financials template 1 ppt powerpoint presentation infographic template graphics. This is a three stage process. The stages in this process are sales, gross profit, net profit.
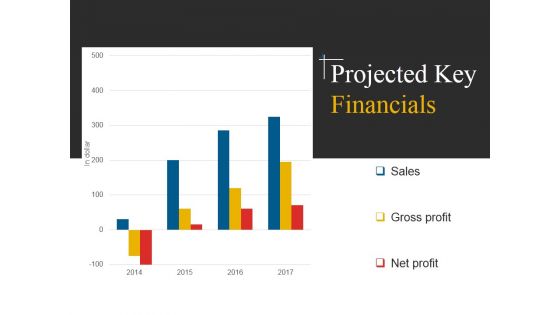
Projected Key Financials Template 2 Ppt PowerPoint Presentation Inspiration Example File
This is a projected key financials template 2 ppt powerpoint presentation inspiration example file. This is a four stage process. The stages in this process are sales, gross profit, net profit.

Projected Key Financials Template 1 Ppt PowerPoint Presentation Model Rules
This is a projected key financials template 1 ppt powerpoint presentation model rules. This is a three stage process. The stages in this process are sales, gross profit, net profit, finance.

Projected Key Financials Template 2 Ppt PowerPoint Presentation Professional Clipart
This is a projected key financials template 2 ppt powerpoint presentation professional clipart. This is a four stage process. The stages in this process are sales, gross profit, net profit, in dollar.
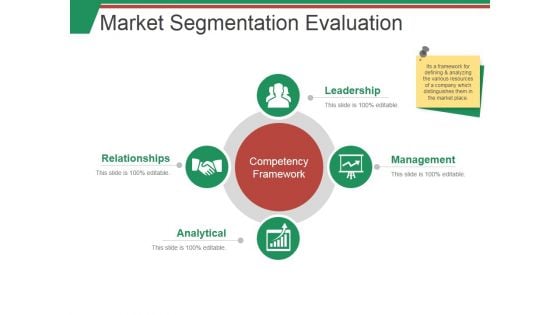
Market Segmentation Evaluation Template 1 Ppt PowerPoint Presentation Summary Smartart
This is a market segmentation evaluation template 1 ppt powerpoint presentation summary smartart. This is a two stage process. The stages in this process are market sales, net profit, beverages, milk product, nutrition.
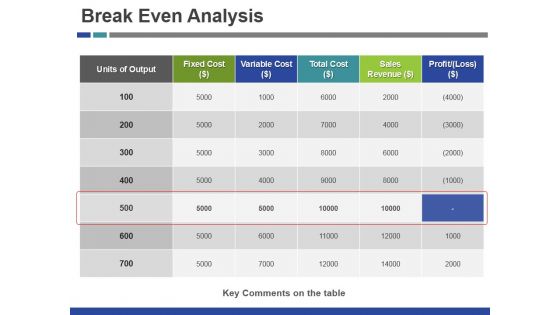
Break Even Analysis Ppt PowerPoint Presentation Inspiration Microsoft
This is a break even analysis ppt powerpoint presentation inspiration microsoft. This is a five stage process. The stages in this process are fixed cost, variable cost, total cost, sales revenue.

Client Testimonials Ppt PowerPoint Presentation File Visual Aids
This is a client testimonials ppt powerpoint presentation file visual aids. This is a two stage process. The stages in this process are founder ceo, sales manager, communication, people.
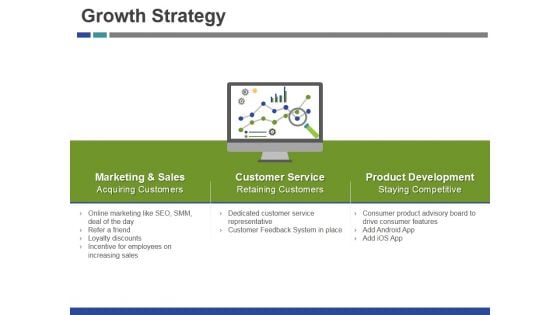
Growth Strategy Ppt PowerPoint Presentation Professional Slide
This is a growth strategy ppt powerpoint presentation professional slide. This is a three stage process. The stages in this process are marketing and sales, customer service, product development.
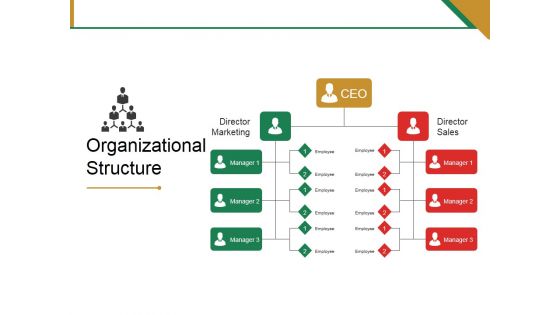
Organizational Structure Ppt PowerPoint Presentation Model Objects
This is a organizational structure ppt powerpoint presentation model objects. This is a three stage process. The stages in this process are ceo, director marketing, director sales, manager, employee.
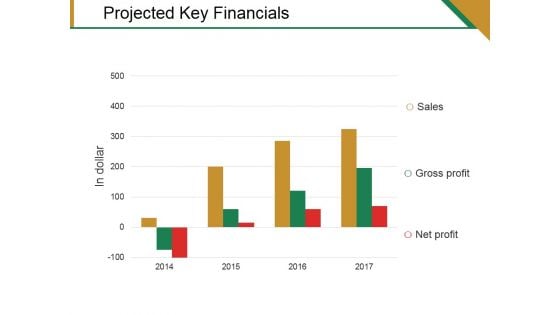
Projected Key Financials Template 1 Ppt PowerPoint Presentation File Portfolio
This is a projected key financials template 1 ppt powerpoint presentation file portfolio. This is a three stage process. The stages in this process are sales, gross profit, net profit.
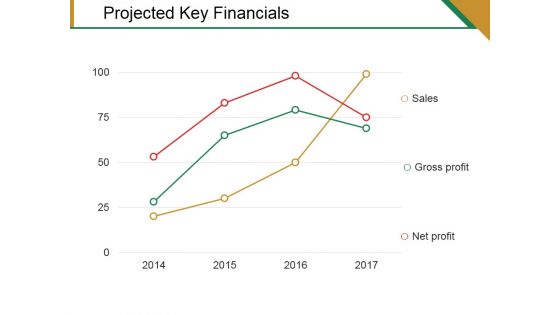
Projected Key Financials Template 2 Ppt PowerPoint Presentation Pictures Graphics Template
This is a projected key financials template 2 ppt powerpoint presentation pictures graphics template. This is a three stage process. The stages in this process are sales, gross profit, net profit.
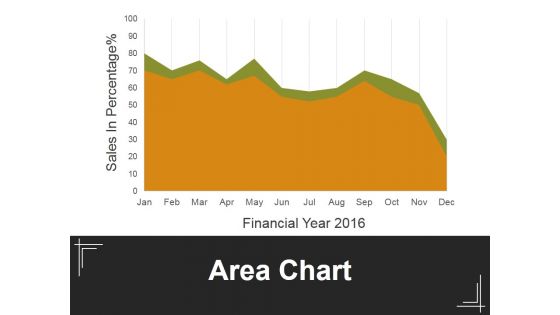
Area Chart Ppt PowerPoint Presentation Slides Deck
This is a area chart ppt powerpoint presentation slides deck. This is a two stage process. The stages in this process are financial, sales in percentage, business, marketing, management.

Exclusive Package For You Ppt PowerPoint Presentation Pictures Format
This is a exclusive package for you ppt powerpoint presentation pictures format. This is a three stage process. The stages in this process are product, sales, business, marketing, plan.
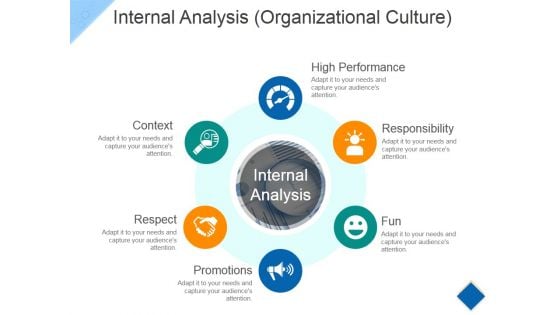
Internal Analysis Template 2 Ppt PowerPoint Presentation Portfolio Designs Download
This is a internal analysis template 2 ppt powerpoint presentation portfolio designs download. This is a three stage process. The stages in this process are employee performance, sales, employee.
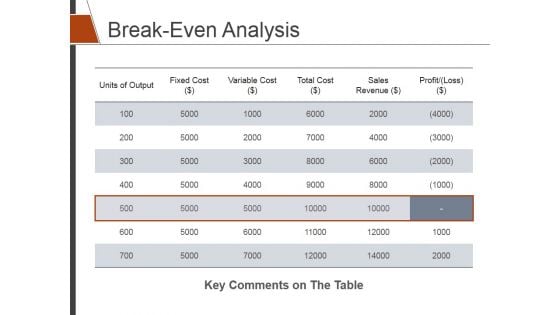
Break Even Analysis Ppt PowerPoint Presentation Summary Background Designs
This is a break even analysis ppt powerpoint presentation summary background designs. This is a five stage process. The stages in this process are units of output, fixed cost, variable cost, total cost, sales revenue.
Growth Strategy Ppt PowerPoint Presentation Icon Introduction
This is a growth strategy ppt powerpoint presentation icon introduction. This is a one stage process. The stages in this process are marketing and sales, customer service, product development.
Area Chart Ppt PowerPoint Presentation Icon Layout Ideas
This is a area chart ppt powerpoint presentation icon layout ideas. This is a two stage process. The stages in this process are area chart, sales in percentage, years, planning, business.
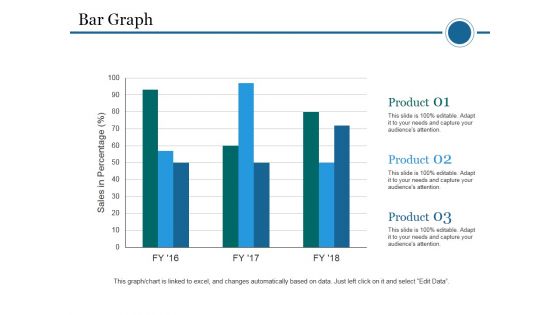
Bar Graph Ppt PowerPoint Presentation Infographic Template Template
This is a bar graph ppt powerpoint presentation infographic template template. This is a three stage process. The stages in this process are bar graph, sales in percentage, product, planning, business.
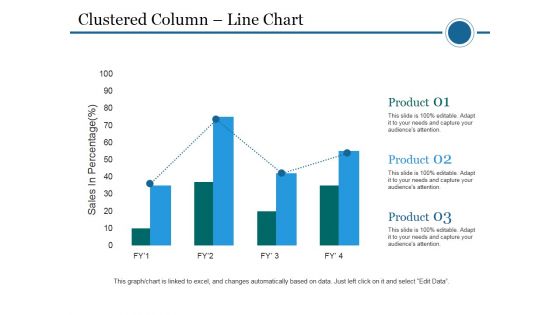
Clustered Column Line Chart Ppt PowerPoint Presentation File Pictures
This is a clustered column line chart ppt powerpoint presentation file pictures. This is a four stage process. The stages in this process are clustered bar, product, planning, business, sales in percentage.
Market Segmentation Evaluation Ppt PowerPoint Presentation Icon Pictures
This is a market segmentation evaluation ppt powerpoint presentation icon pictures. This is a two stage process. The stages in this process are net profit, in usd millions, market sales, business, marketing.
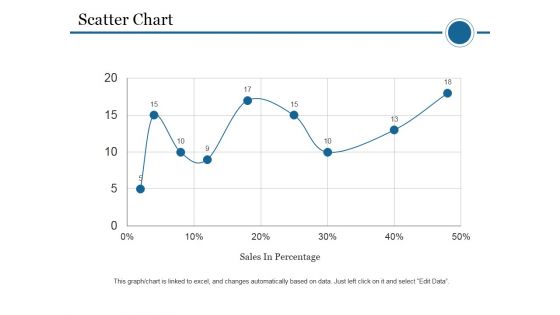
Scatter Chart Template 1 Ppt PowerPoint Presentation Outline Gridlines
This is a scatter chart template 1 ppt powerpoint presentation outline gridlines. This is a one stage process. The stages in this process are scatter chart, sales in percentage, business, marketing, growth.
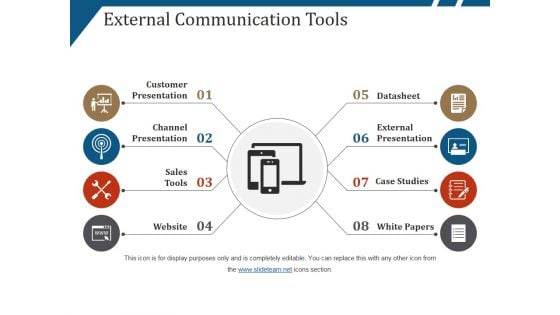
External Communication Tools Ppt PowerPoint Presentation Gallery Graphics
This is a external communication tools ppt powerpoint presentation gallery graphics. This is a eight stage process. The stages in this process are customer presentation, channel presentation, sales tools, website.

Meet Our Team Ppt PowerPoint Presentation Infographics Templates
This is a meet our team ppt powerpoint presentation infographics templates. This is a three stage process. The stages in this process are graphic designer, ceo, sales manager, teamwork, business.
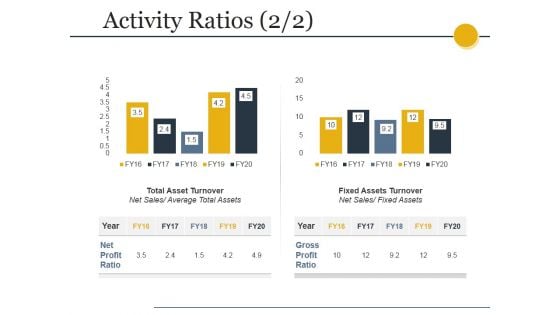
Activity Ratios Template 3 Ppt PowerPoint Presentation Professional Example
This is a activity ratios template 3 ppt powerpoint presentation professional example. This is a two stage process. The stages in this process are total asset turnover, net sales, fixed assets turnover, fixed assets.
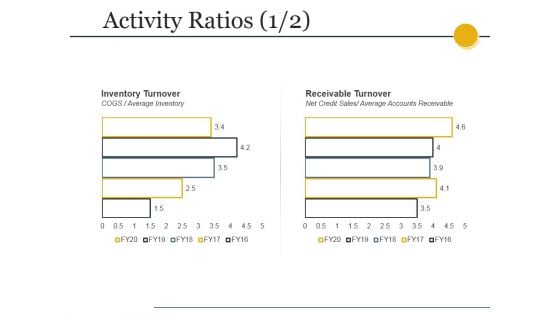
Activity Ratios Template Ppt PowerPoint Presentation Summary Slides
This is a activity ratios template ppt powerpoint presentation summary slides. This is a two stage process. The stages in this process are total asset turnover, net sales, fixed assets turnover, fixed assets.
Activity Ratios Ppt PowerPoint Presentation Icon Themes
This is a activity ratios ppt powerpoint presentation icon themes. This is a two stage process. The stages in this process are inventory turnover, cogs, average inventory, receivable turnover, net credit sales, average accounts receivable .
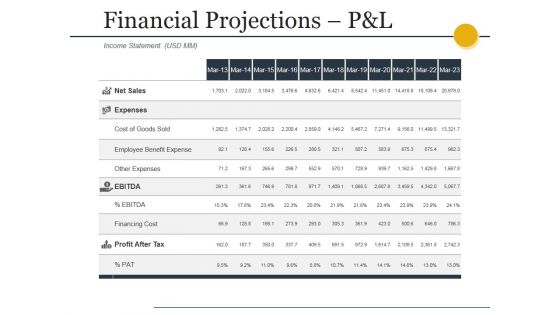
Financial Projections Pandl Ppt PowerPoint Presentation Styles Gallery
This is a financial projections pandl ppt powerpoint presentation styles gallery. This is a eleven stage process. The stages in this process are net sales, expenses, cost of goods sold, employee benefit expense, other expenses.
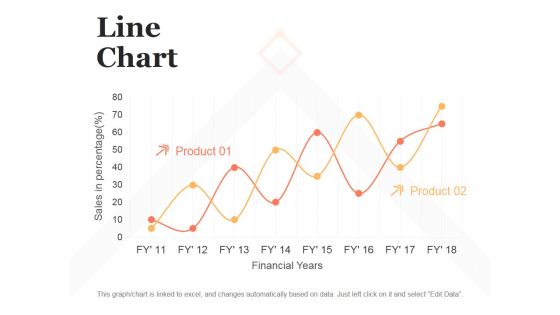
Line Chart Ppt PowerPoint Presentation Model Design Templates
This is a line chart ppt powerpoint presentation model design templates. This is a two stage process. The stages in this process are sales in percentage, financial years, product.
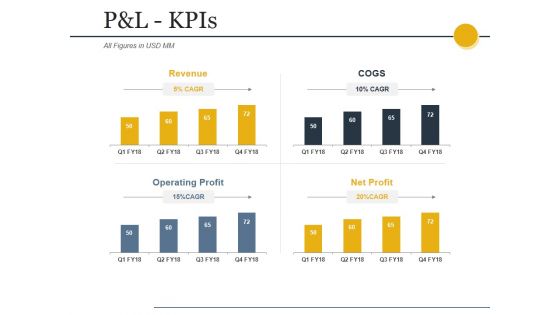
Pandl Kpis Ppt PowerPoint Presentation Infographic Template Layout
This is a pandl kpis ppt powerpoint presentation infographic template layout. This is a four stage process. The stages in this process are net sales, other income, total income, expenses, total material consumed.
Scatter Chart Ppt PowerPoint Presentation Icon Elements
This is a scatter chart ppt powerpoint presentation icon elements. This is a nine stage process. The stages in this process are dollar in billions, sales in percentage, business, success.
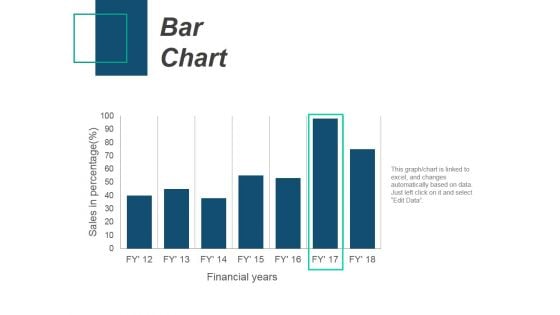
Bar Chart Ppt PowerPoint Presentation Professional Files
This is a bar chart ppt powerpoint presentation professional files. This is a seven stage process. The stages in this process are bar chart, product, sales in percentage, financial years.
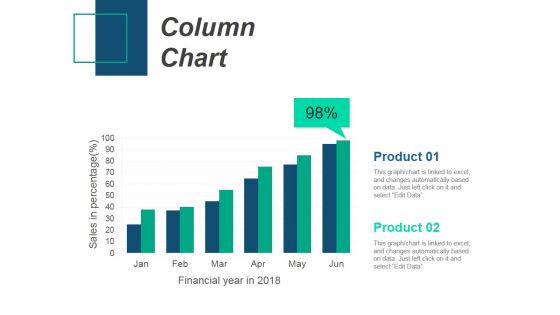
Column Chart Ppt PowerPoint Presentation Gallery Design Inspiration
This is a column chart ppt powerpoint presentation gallery design inspiration. This is a two stage process. The stages in this process are column chart, product, sales in percentage, financial years.
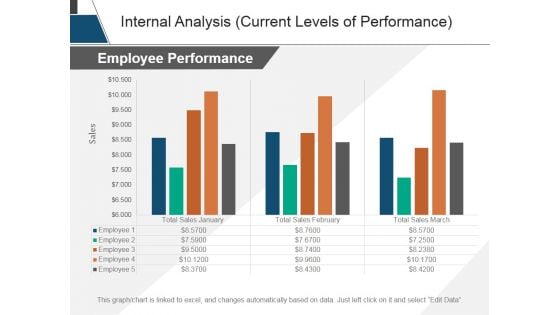
Internal Analysis Current Levels Of Performance Ppt PowerPoint Presentation Tips
This is a internal analysis current levels of performance ppt powerpoint presentation tips. This is a three stage process. The stages in this process are sales, employee performance, years, business, marketing.
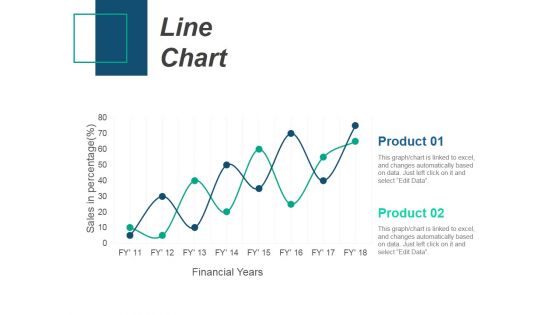
Line Chart Ppt PowerPoint Presentation Infographic Template Introduction
This is a line chart ppt powerpoint presentation infographic template introduction. This is a two stage process. The stages in this process are product, sales in percentage, financial years, line chart.
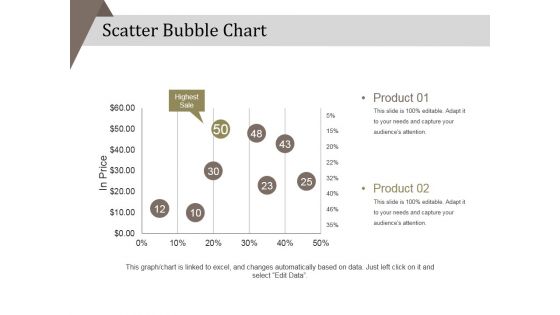
Scatter Bubble Chart Ppt PowerPoint Presentation Diagram Ppt
This is a scatter bubble chart ppt powerpoint presentation diagram ppt. This is a two stage process. The stages in this process are product, in price, highest sale, percentage, business, marketing.
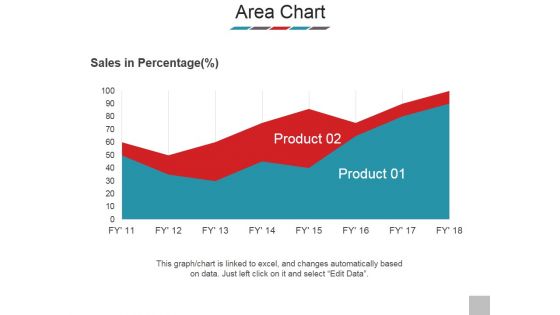
Area Chart Ppt PowerPoint Presentation Styles Images
This is a area chart ppt powerpoint presentation styles images. This is a two stage process. The stages in this process are sales in percentage, product, graph, business, marketing.
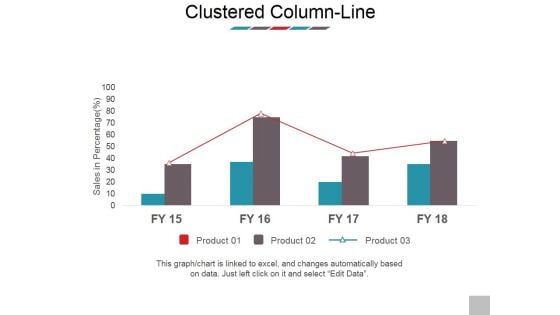
Clustered Column Line Ppt PowerPoint Presentation Model Images
This is a clustered column line ppt powerpoint presentation model images. This is a four stage process. The stages in this process are sales in percentage, product, business, marketing, bar graph.


 Continue with Email

 Home
Home


