Sales Analysis
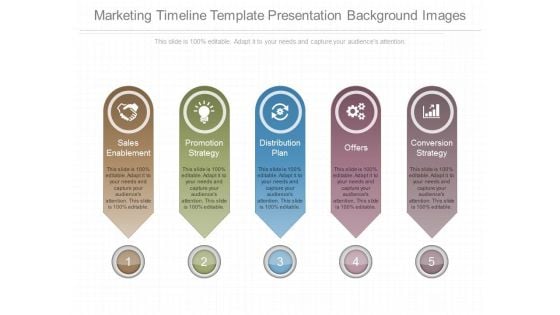
Marketing Timeline Template Presentation Background Images
This is a marketing timeline template presentation background images. This is a five stage process. The stages in this process are sales enablement, promotion strategy, distribution plan, offers, conversion strategy.
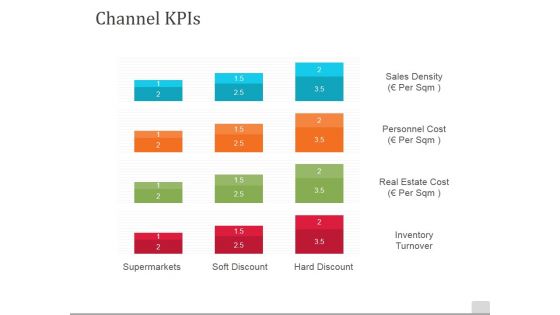
Channel Kpis Template 1 Ppt PowerPoint Presentation Infographic Template Elements
This is a channel kpis template 1 ppt powerpoint presentation infographic template elements. This is a four stage process. The stages in this process are channel kpis, sales density, personnel cost, real estate cost, inventory turnover.
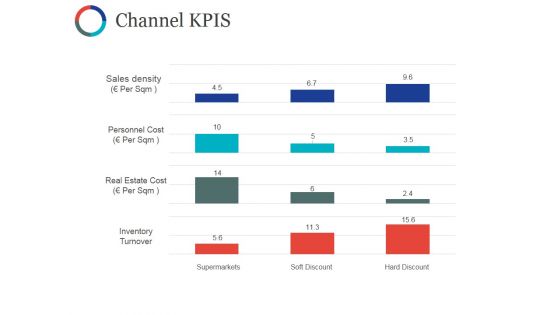
Channel Kpis Template Ppt PowerPoint Presentation Show Portfolio
This is a channel kpis template ppt powerpoint presentation show portfolio. This is a four stage process. The stages in this process are sales density, personnel cost, real estate cost, inventory turnover.
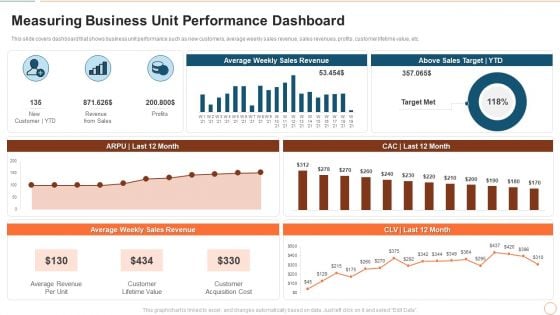
Illustrating Product Leadership Plan Incorporating Innovative Techniques Measuring Business Unit Professional PDF
This slide covers dashboard that shows business unit performance such as new customers, average weekly sales revenue, sales revenues, profits, customer lifetime value, etc. Deliver an awe inspiring pitch with this creative illustrating product leadership plan incorporating innovative techniques measuring business unit professional pdf bundle. Topics like average revenue per unit, customer lifetime value, customer acquisition cost can be discussed with this completely editable template. It is available for immediate download depending on the needs and requirements of the user.
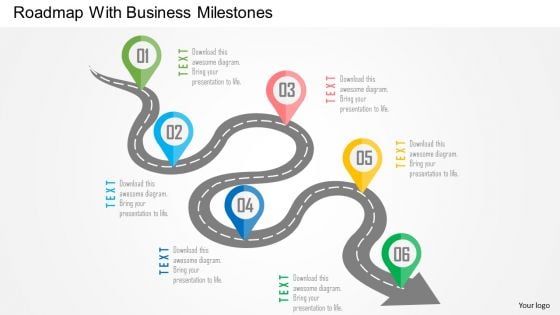
Business Diagram Roadmap With Business Milestones Presentation Template
Some Quick Facts Ppt PowerPoint Presentation Layouts Icons
This is a some quick facts ppt powerpoint presentation layouts icons. This is a three stage process. The stages in this process are customers, sales growth, staff work weekly.
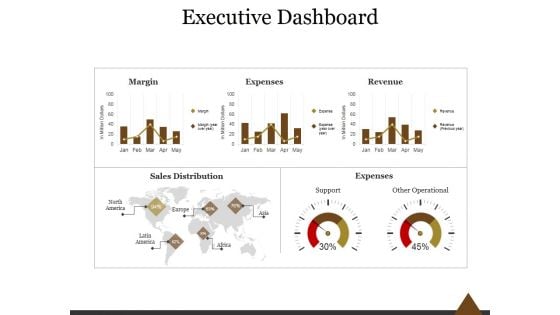
Executive Dashboard Ppt PowerPoint Presentation Professional
This is a executive dashboard ppt powerpoint presentation professional. This is a five stage process. The stages in this process are margin, expenses, revenue, sales distribution, expenses, support, other operational.

Our Team Ppt PowerPoint Presentation Styles Skills
This is a our team ppt powerpoint presentation styles skills. This is a four stage process. The stages in this process are general manager, design manager, accounts manager, sales manager.
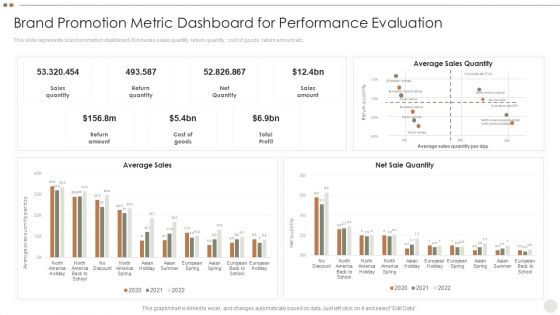
Online Promotional Techniques To Increase Brand Promotion Metric Dashboard For Performance Evaluation Brochure PDF
This slide represents brand promotion dashboard. It includes sales quantity, return quantity, cost of goods, return amount etc.Deliver an awe inspiring pitch with this creative Online Promotional Techniques To Increase Brand Promotion Metric Dashboard For Performance Evaluation Brochure PDF bundle. Topics like Sales Quantity, Return Quantity, Net Quantity can be discussed with this completely editable template. It is available for immediate download depending on the needs and requirements of the user.
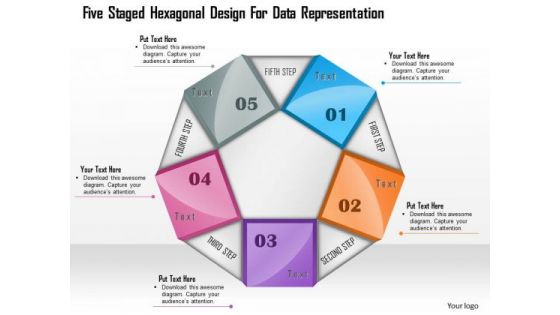
Five Staged Hexagonal Design For Data Representation Presentation Template
Hexagonal design has been used to design this business power point template. This PPT contains the five stages for data representation. Use this template for business and sales related presentation.
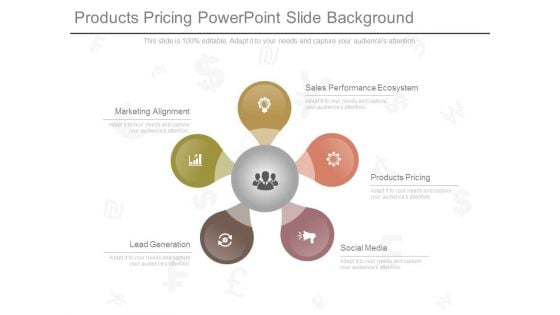
Products Pricing Powerpoint Slide Background
This is a products pricing powerpoint slide background. This is a five stage process. The stages in this process are marketing alignment, sales performance ecosystem, products pricing, social media, lead generation.
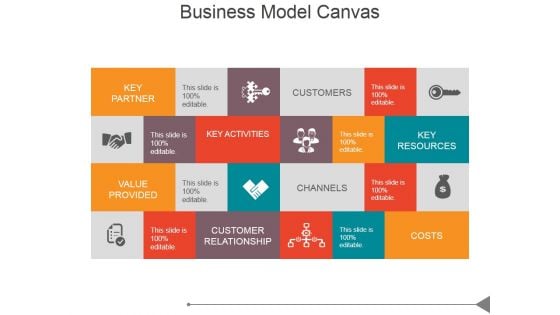
Business Model Canvas Ppt PowerPoint Presentation Designs
This is a business model canvas ppt powerpoint presentation designs. This is a three stage process. The stages in this process are profit models, unique value proposition, market attractiveness, sales performance model, sustainability.
Area Chart Ppt PowerPoint Presentation Icon Layout Ideas
This is a area chart ppt powerpoint presentation icon layout ideas. This is a two stage process. The stages in this process are area chart, sales in percentage, years, planning, business.
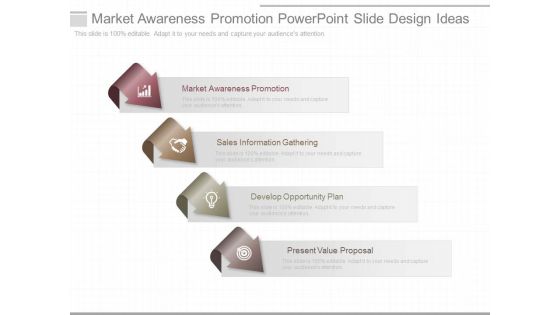
Market Awareness Promotion Powerpoint Slide Design Ideas
This is a market awareness promotion powerpoint slide design ideas. This is a four stage process. The stages in this process are market awareness promotion, sales information gathering, develop opportunity plan, present value proposal.

Stock Requirement Plan With Inventory Summary Ppt PowerPoint Presentation Gallery Designs Download PDF
The following slide highlights the material requirement planning with inventory summary. It illustrates sales report, delivery report, inventory summary, purchase order and suppliers. Showcasing this set of slides titled Stock Requirement Plan With Inventory Summary Ppt PowerPoint Presentation Gallery Designs Download PDF. The topics addressed in these templates are Suppliers, Sales Report, Inventory Summary, Purchase Order. All the content presented in this PPT design is completely editable. Download it and make adjustments in color, background, font etc. as per your unique business setting.
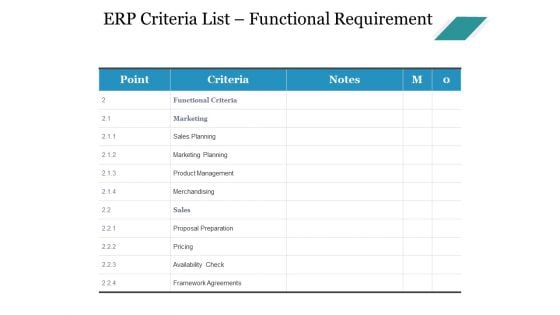
Erp Criteria List Functional Requirement Ppt PowerPoint Presentation Show Summary
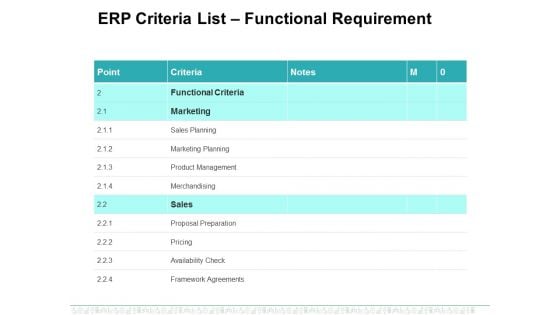
This is a erp criteria list functional requirement ppt powerpoint presentation show summary. This is a four stage process. The stages in this process are functional criteria, marketing, sales planning, marketing planning, product management.
Erp Criteria List Functional Requirement Ppt PowerPoint Presentation Infographics Layouts
This is a erp criteria list functional requirement ppt powerpoint presentation infographics layouts. This is a four stage process. The stages in this process are functional criteria, marketing, sales planning, marketing planning, product management.
Combo Chart Ppt PowerPoint Presentation Shapes
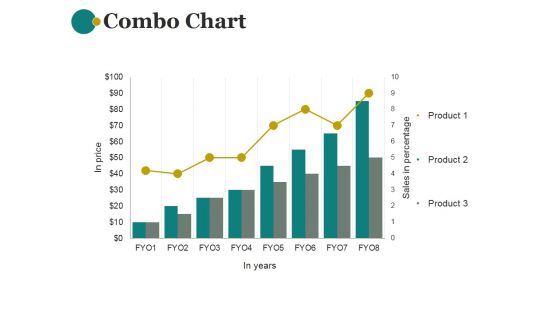
This is a combo chart ppt powerpoint presentation shapes. This is a eight stage process. The stages in this process are combo chart, business, marketing, sales in percentage, bar graph.
Financial Projection Graph Template 1 Ppt PowerPoint Presentation Icon Summary
This is a financial projection graph template 1 ppt powerpoint presentation icon summary. This is a three stage process. The stages in this process are annual sales forecast, years, business, marketing, management.
Bar Chart Ppt PowerPoint Presentation Icon Design Templates
This is a bar chart ppt powerpoint presentation icon design templates. This is a nine stage process. The stages in this process are sales in percentage, bar graph, business, marketing, growth.
Line Chart Ppt PowerPoint Presentation Ideas Example
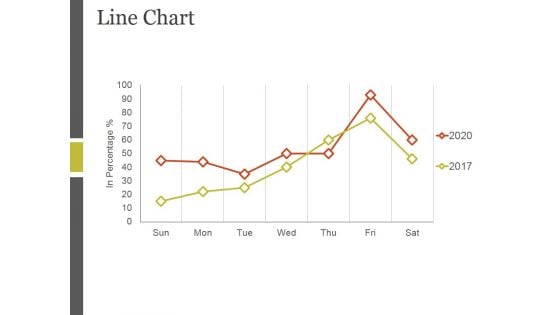
This is a line chart ppt powerpoint presentation ideas example. This is a two stage process. The stages in this process are sales in percentage, bar graph, business, marketing, growth.
Bar Chart Ppt PowerPoint Presentation Ideas Graphic Tips
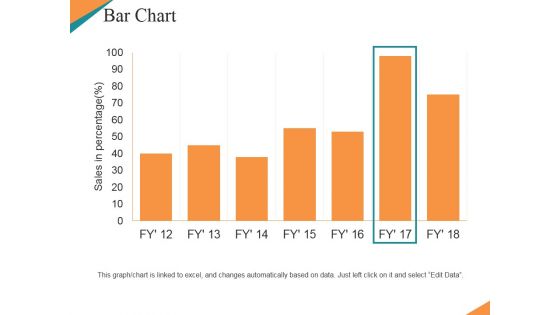
This is a bar chart ppt powerpoint presentation ideas graphic tips. This is a seven stage process. The stages in this process are sales in percentage, bar chart, growth, business, marketing.
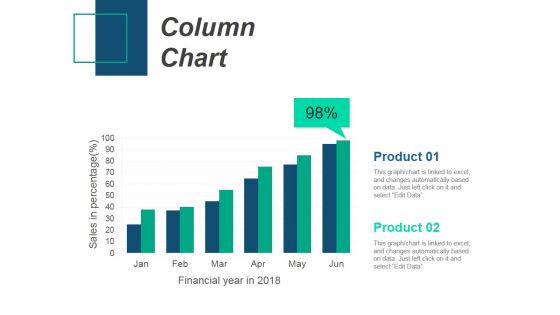
Column Chart Ppt PowerPoint Presentation Gallery Design Inspiration
This is a column chart ppt powerpoint presentation gallery design inspiration. This is a two stage process. The stages in this process are column chart, product, sales in percentage, financial years.
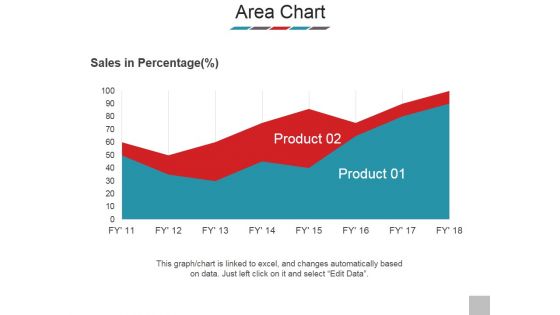
Area Chart Ppt PowerPoint Presentation Styles Images
This is a area chart ppt powerpoint presentation styles images. This is a two stage process. The stages in this process are sales in percentage, product, graph, business, marketing.
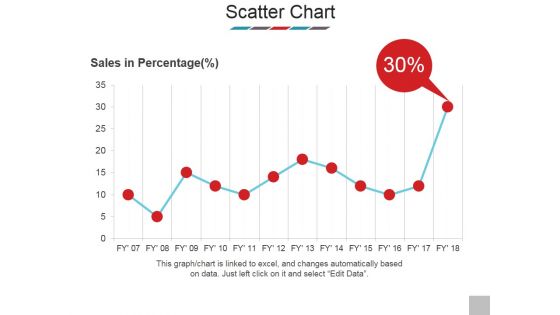
Scatter Chart Ppt PowerPoint Presentation Model Show
This is a scatter chart ppt powerpoint presentation model show. This is a one stage process. The stages in this process are sales in percentage, scatter chart, business, bar graph, marketing.
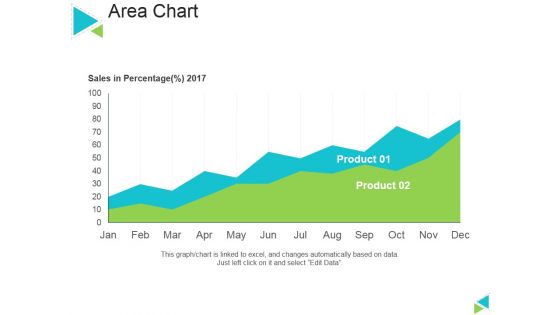
Area Chart Ppt PowerPoint Presentation Inspiration Themes
This is a area chart ppt powerpoint presentation inspiration themes. This is a two stage process. The stages in this process are sales in percentage, product, area chart, business, marketing.
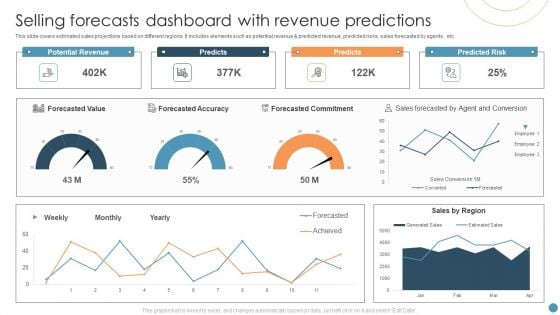
Selling Forecasts Dashboard With Revenue Predictions Elements PDF
This slide covers estimated sales projections based on different regions. It includes elements such as potential revenue and predicted revenue, predicted risks, sales forecasted by agents , etc. Showcasing this set of slides titled Selling Forecasts Dashboard With Revenue Predictions Elements PDF. The topics addressed in these templates are Forecasted Value, Potential Revenue, Predicted Risk. All the content presented in this PPT design is completely editable. Download it and make adjustments in color, background, font etc. as per your unique business setting.
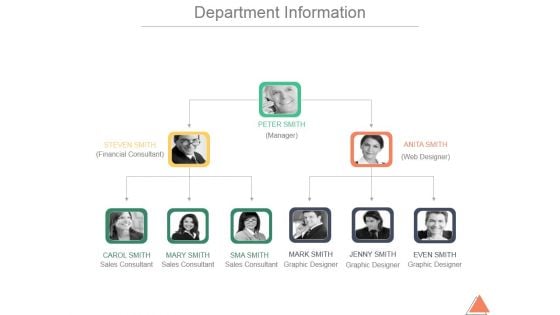
Department Information Ppt PowerPoint Presentation Designs
This is a department information ppt powerpoint presentation designs. This is a four stage process. The stages in this process are manager, web designer, financial consultant, sales consultant, graphic designer.

Our Team Ppt PowerPoint Presentation Graphics
This is a our team ppt powerpoint presentation graphics. This is a four stage process. The stages in this process are general manager, design manager, accounts manager, sales manager.
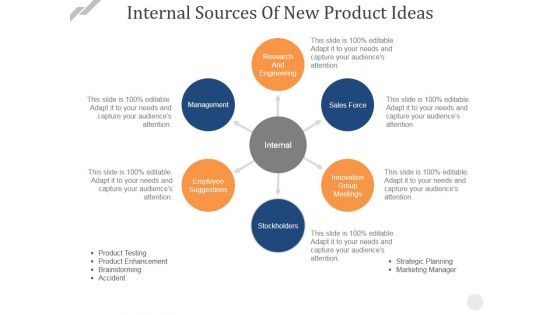
Internal Sources Of New Product Ideas Ppt PowerPoint Presentation Infographics Graphics Design
This is a internal sources of new product ideas ppt powerpoint presentation infographics graphics design. This is a six stage process. The stages in this process are stockholders, employee suggestions, management, research and engineering, sales force.
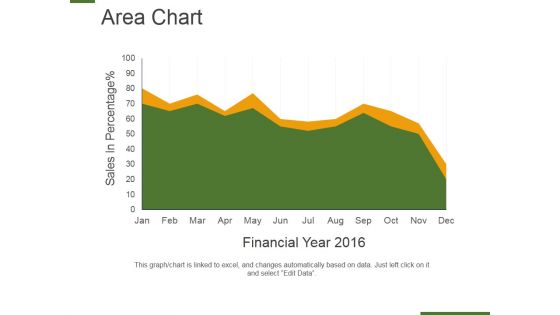
Area Chart Ppt PowerPoint Presentation Layouts Graphics Example
This is a area chart ppt powerpoint presentation layouts graphics example. This is a two stage process. The stages in this process are sales in percentage, financial year, business, marketing, presentation.
Founders Of The Company Ppt PowerPoint Presentation Icon Infographic Template
This is a founders of the company ppt powerpoint presentation icon infographic template. This is a five stage process. The stages in this process are ceo, web designer, sales and marketing, editor, graphic designer.
Clustered Column Ppt PowerPoint Presentation Icon Design Inspiration
This is a clustered column ppt powerpoint presentation icon design inspiration. This is a two stage process. The stages in this process are product, financial year, sales in percentage, clustered column.
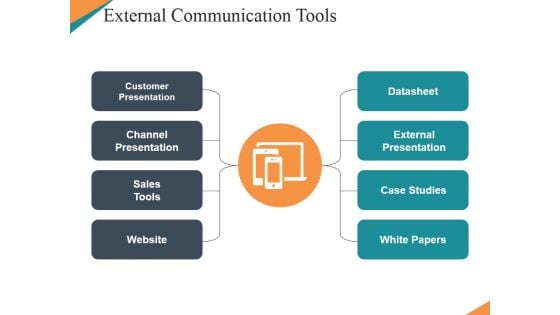
External Communication Tools Ppt PowerPoint Presentation Infographics Summary
This is a external communication tools ppt powerpoint presentation infographics summary. This is a eight stage process. The stages in this process are customer presentation, channel presentation, sales tools, website, datasheet.

Meet Our Team Ppt PowerPoint Presentation Ideas Show
This is a meet our team ppt powerpoint presentation ideas show. This is a four stage process. The stages in this process are developer, sales manager, web designer, ceo.
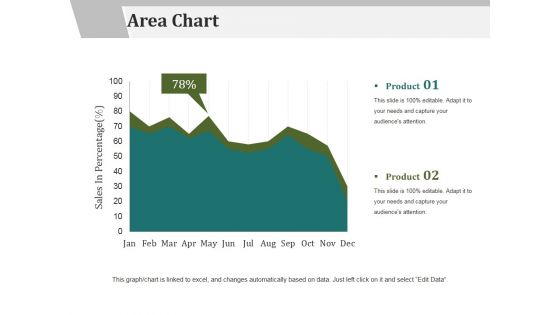
Area Chart Ppt PowerPoint Presentation Infographics Graphics Tutorials
This is a area chart ppt powerpoint presentation infographics graphics tutorials. This is a two stage process. The stages in this process are product, area chart, sales in percentage.
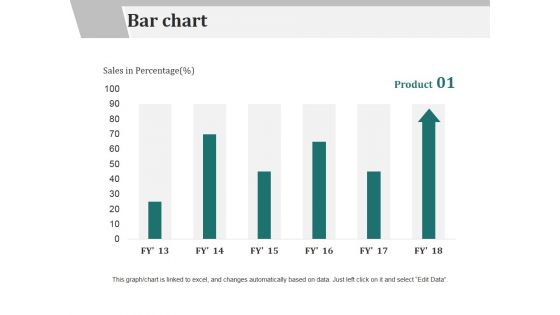
Bar Chart Ppt PowerPoint Presentation Slides Design Ideas
This is a bar chart ppt powerpoint presentation slides design ideas. This is a six stage process. The stages in this process are product, bar chart, sales in percentage.
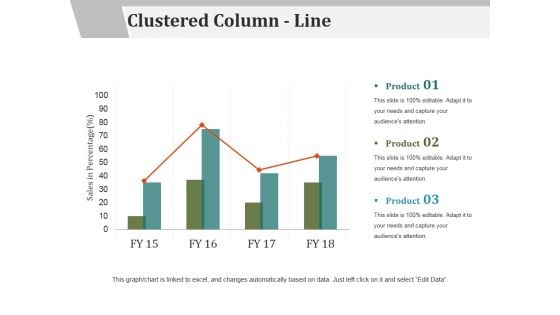
Clustered Column Line Ppt PowerPoint Presentation File Examples
This is a clustered column line ppt powerpoint presentation file examples. This is a three stage process. The stages in this process are sales in percentage, product, business, marketing, success.
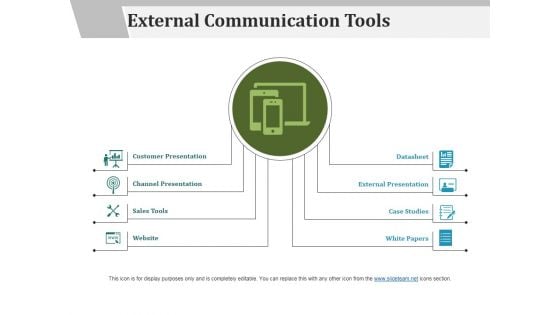
External Communication Tools Ppt PowerPoint Presentation Pictures Guidelines
This is a external communication tools ppt powerpoint presentation pictures guidelines. This is a eight stage process. The stages in this process are customer presentation, channel presentation, sales tools, website, datasheet.
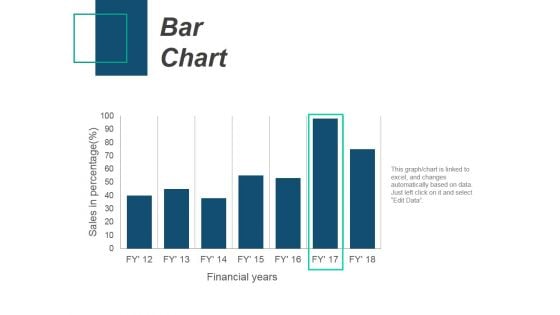
Bar Chart Ppt PowerPoint Presentation Professional Files
This is a bar chart ppt powerpoint presentation professional files. This is a seven stage process. The stages in this process are bar chart, product, sales in percentage, financial years.
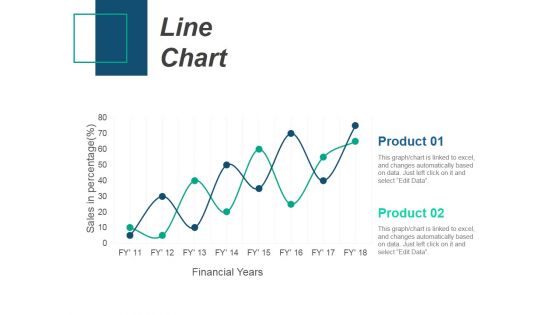
Line Chart Ppt PowerPoint Presentation Infographic Template Introduction
This is a line chart ppt powerpoint presentation infographic template introduction. This is a two stage process. The stages in this process are product, sales in percentage, financial years, line chart.
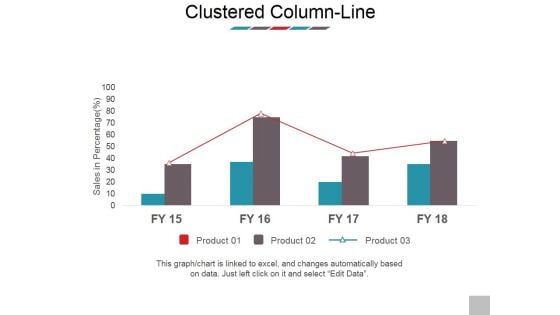
Clustered Column Line Ppt PowerPoint Presentation Model Images
This is a clustered column line ppt powerpoint presentation model images. This is a four stage process. The stages in this process are sales in percentage, product, business, marketing, bar graph.
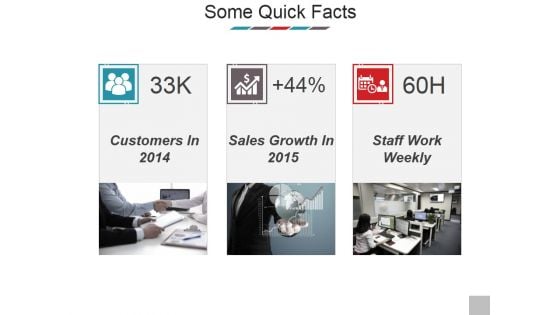
Some Quick Facts Ppt PowerPoint Presentation Styles Diagrams
This is a some quick facts ppt powerpoint presentation styles diagrams. This is a three stage process. The stages in this process are customers in 2014, sales growth in 2015, staff work weekly.
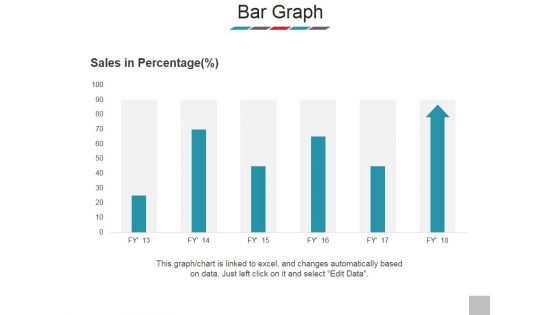
Bar Graph Ppt PowerPoint Presentation Model Clipart
This is a bar graph ppt powerpoint presentation model clipart. This is a six stage process. The stages in this process are sales in percentage, product, bar graph, business, marketing.
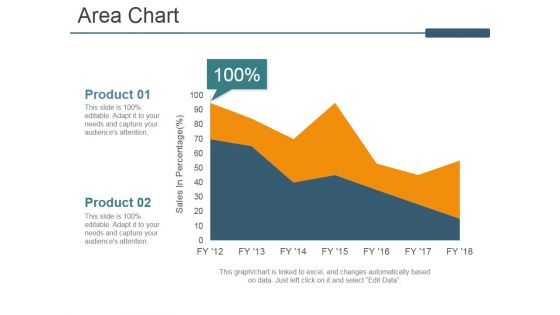
Area Chart Ppt PowerPoint Presentation Inspiration Rules
This is a area chart ppt powerpoint presentation inspiration rules. This is a two stage process. The stages in this process are area chart, business, marketing, sales in percentage, product.
Line Chart Ppt PowerPoint Presentation Infographic Template Icons
This is a line chart ppt powerpoint presentation infographic template icons. This is a two stage process. The stages in this process are sales in percentage, financial years, product, line chart.
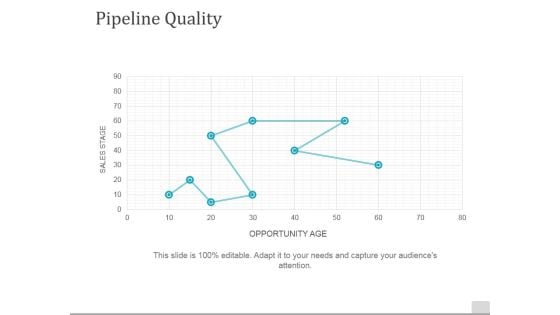
Pipeline Quality Template 2 Ppt PowerPoint Presentation Inspiration Show
This is a pipeline quality template 2 ppt powerpoint presentation inspiration show. This is a one stage process. The stages in this process are sales stage, opportunity age, pipeline, quality, line chart.
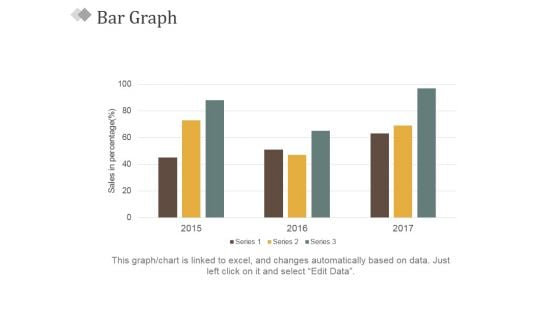
Bar Graph Ppt PowerPoint Presentation Slides Visual Aids
This is a bar graph ppt powerpoint presentation slides visual aids. This is a three stage process. The stages in this process are sales in percentage, bar graph, business, marketing, success.
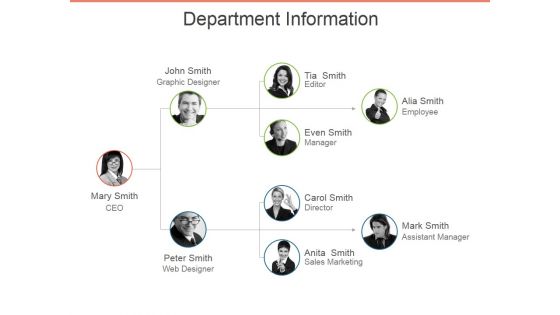
Department Information Ppt PowerPoint Presentation Inspiration Model
This is a department information ppt powerpoint presentation inspiration model. This is a three stage process. The stages in this process are graphic designer, ceo, web designer, sales marketing, director, manager.

Member Profile Ppt PowerPoint Presentation Layouts Template
This is a member profile ppt powerpoint presentation layouts template. This is a one stage process. The stages in this process are robin, sales marketing, personal skills, member profile.

Our Team Ppt PowerPoint Presentation Infographic Template Design Inspiration
This is a our team ppt powerpoint presentation infographic template design inspiration. This is a six stage process. The stages in this process are manager, ceo, sales marketing, graphic designer, editor, web designer.

Client Testimonials Ppt PowerPoint Presentation Gallery Introduction
This is a client testimonials ppt powerpoint presentation gallery introduction. This is a two stage process. The stages in this process are john smith, sales manager, mary smith, founder ceo.
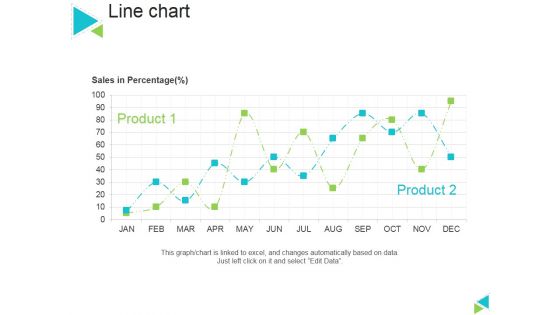
Line Chart Ppt PowerPoint Presentation Gallery Master Slide
This is a line chart ppt powerpoint presentation gallery master slide. This is a two stage process. The stages in this process are sales in percentage, product, line chart.
Media Kpi Development Ppt PowerPoint Presentation Show Icon
This is a media kpi development ppt powerpoint presentation show icon. This is a four stage process. The stages in this process are visitors, leads, marketing qualified leads, sales qualified leads, decision.

Our Team Ppt Powerpoint Presentation Professional File Formats
This is a our team ppt powerpoint presentation professional file formats. This is a three stage process. The stages in this process are our team, ceo, sales manager, web designer.
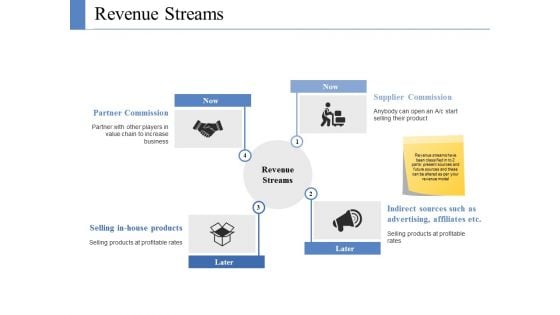
Revenue Streams Ppt PowerPoint Presentation Gallery Graphic Images
This is a revenue streams ppt powerpoint presentation gallery graphic images. This is a six stage process. The stages in this process are advertising, sales commission, subscription, affiliate, sponsored content.
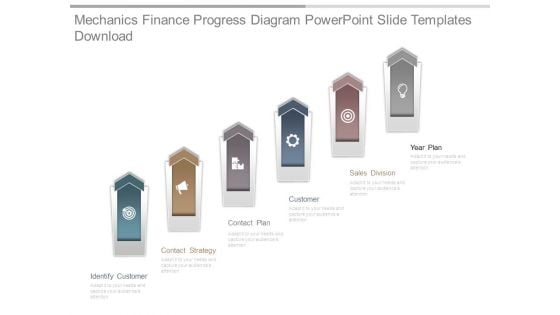
Mechanics Finance Progress Diagram Powerpoint Slide Templates Download
This is a mechanics finance progress diagram powerpoint slide templates download. This is a six stage process. The stages in this process are identify customer, contact strategy, contact plan, customer, sales division, year plan.
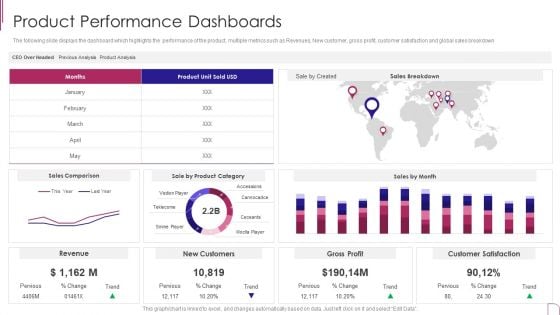
Yearly Product Performance Assessment Repor Product Performance Dashboards Designs PDF
The following slide displays the dashboard which highlights the performance of the product, multiple metrics such as Revenues, New customer, gross profit, customer satisfaction and global sales breakdown.Deliver and pitch your topic in the best possible manner with this Yearly Product Performance Assessment Repor Product Performance Dashboards Designs PDF Use them to share invaluable insights on Gross Profit, Customer Satisfaction, Sales Comparison and impress your audience. This template can be altered and modified as per your expectations. So, grab it now.
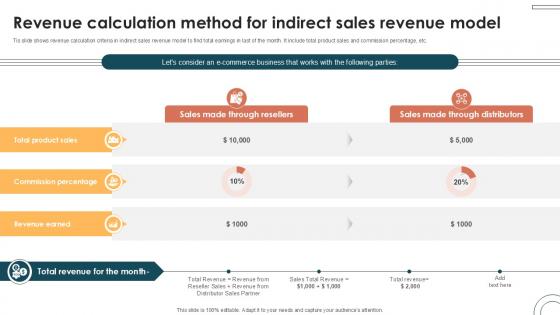
Revenue Calculation Method For Indirect Internet Based Trade Structure Ppt Powerpoint
Tis slide shows revenue calculation criteria in indirect sales revenue model to find total earnings in last of the month. It include total product sales and commission percentage, etc. Are you in need of a template that can accommodate all of your creative concepts This one is crafted professionally and can be altered to fit any style. Use it with Google Slides or PowerPoint. Include striking photographs, symbols, depictions, and other visuals. Fill, move around, or remove text boxes as desired. Test out color palettes and font mixtures. Edit and save your work, or work with colleagues. Download Revenue Calculation Method For Indirect Internet Based Trade Structure Ppt Powerpoint and observe how to make your presentation outstanding. Give an impeccable presentation to your group and make your presentation unforgettable. Tis slide shows revenue calculation criteria in indirect sales revenue model to find total earnings in last of the month. It include total product sales and commission percentage, etc.
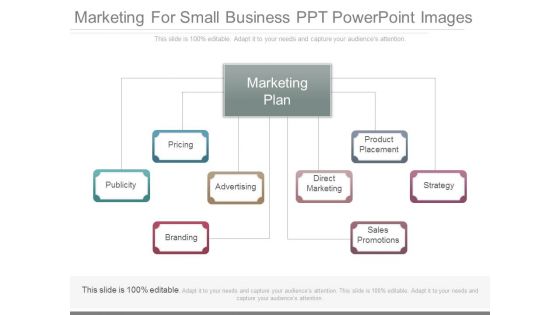
Marketing For Small Business Ppt Powerpoint Images
This is a marketing for small business ppt powerpoint images. This is a eight stage process. The stages in this process are marketing plan, pricing, publicity, advertising, branding, direct marketing, product placement, strategy, sales promotions.


 Continue with Email

 Home
Home


