Sales Icons
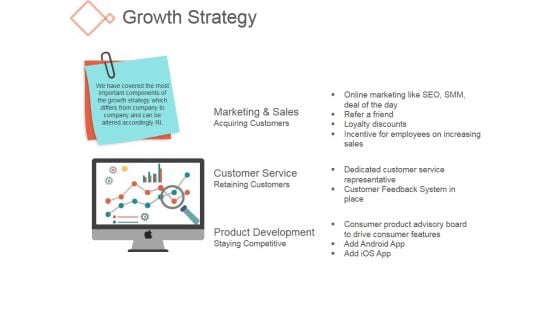
Growth Strategy Ppt PowerPoint Presentation Clipart
This is a growth strategy ppt powerpoint presentation clipart. This is a one stage process. The stages in this process are marketing and sales acquiring customers, customer service retaining customers.
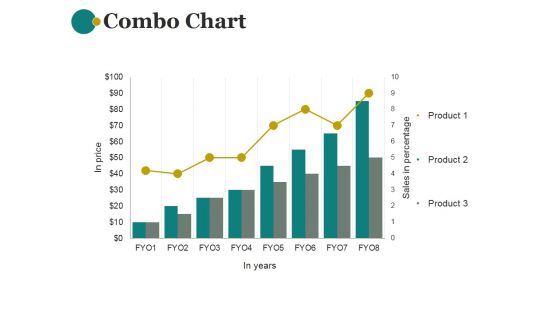
Combo Chart Ppt PowerPoint Presentation Shapes
This is a combo chart ppt powerpoint presentation shapes. This is a eight stage process. The stages in this process are combo chart, business, marketing, sales in percentage, bar graph.
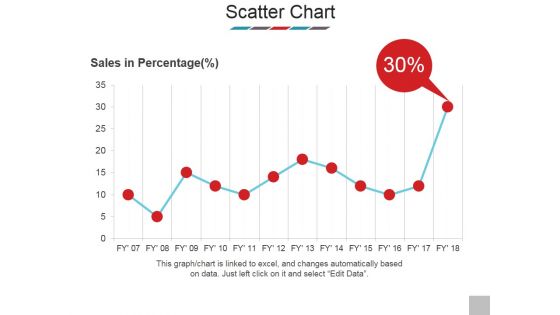
Scatter Chart Ppt PowerPoint Presentation Model Show
This is a scatter chart ppt powerpoint presentation model show. This is a one stage process. The stages in this process are sales in percentage, scatter chart, business, bar graph, marketing.
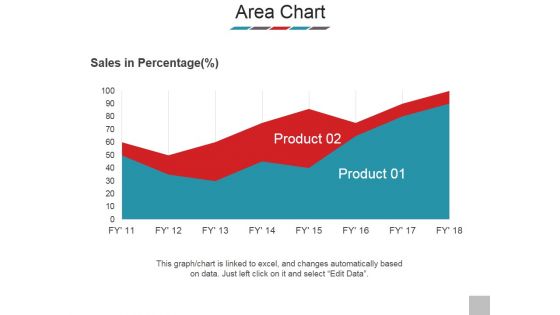
Area Chart Ppt PowerPoint Presentation Styles Images
This is a area chart ppt powerpoint presentation styles images. This is a two stage process. The stages in this process are sales in percentage, product, graph, business, marketing.
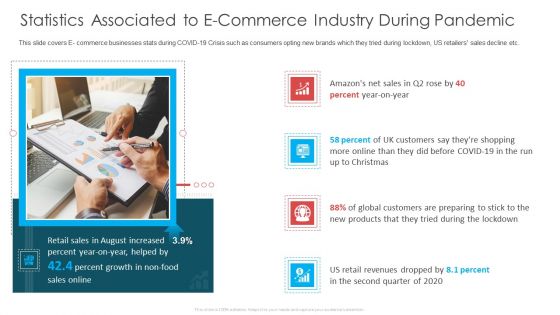
Statistics Associated To E Commerce Industry During Pandemic Ppt Ideas Infographic Template PDF
This slide covers E- commerce businesses stats during COVID-19 Crisis such as consumers opting new brands which they tried during lockdown, US retailers sales decline etc. Presenting statistics associated to e commerce industry during pandemic ppt ideas infographic template pdf to provide visual cues and insights. Share and navigate important information on four stages that need your due attention. This template can be used to pitch topics like retail sales, percent growth, sales online, customers, products. In addition, this PPT design contains high-resolution images, graphics, etc, that are easily editable and available for immediate download.
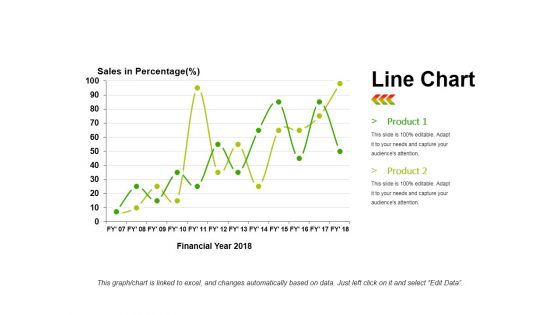
Line Chart Ppt PowerPoint Presentation Infographics Infographics
This is a line chart ppt powerpoint presentation infographics infographics. This is a two stage process. The stages in this process are product, sales in percentage, financial year, line chart, finance.
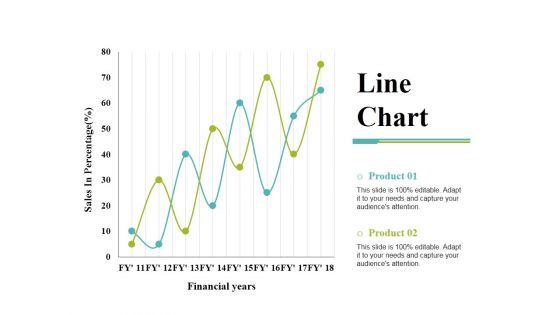
Line Chart Ppt PowerPoint Presentation Gallery Templates
This is a line chart ppt powerpoint presentation gallery templates. This is a two stage process. The stages in this process are product, financial years, sales in percentage, line chart.
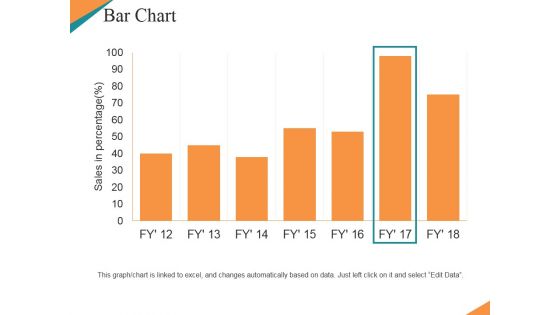
Bar Chart Ppt PowerPoint Presentation Ideas Graphic Tips
This is a bar chart ppt powerpoint presentation ideas graphic tips. This is a seven stage process. The stages in this process are sales in percentage, bar chart, growth, business, marketing.
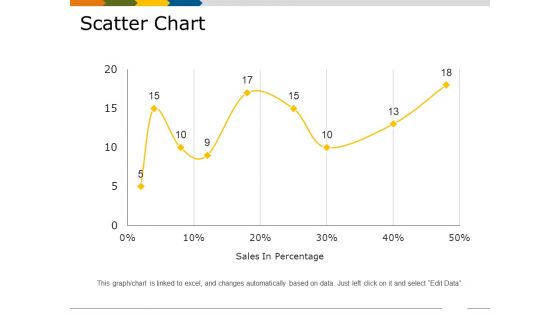
Scatter Chart Template 3 Ppt PowerPoint Presentation Styles Demonstration
This is a scatter chart template 3 ppt powerpoint presentation styles demonstration. This is a one stage process. The stages in this process are sales in percentage, finance, business, marketing, growth.
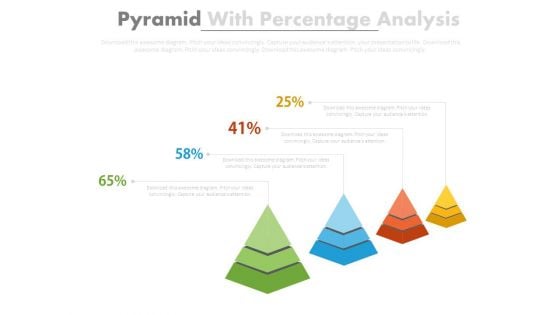
Four Pyramids With Growth Steps Powerpoint Slides
This business slide has been designed with four pyramids. This PowerPoint template may use to display sales growth and analysis. Prove the viability of your ideas using this impressive slide.
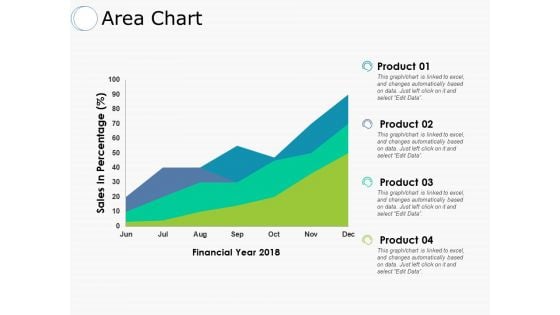
Area Chart Financial Ppt PowerPoint Presentation Outline Professional
This is a area chart financial ppt powerpoint presentation outline professional. This is a four stage process. The stages in this process are product, sales in percentage, financial year.
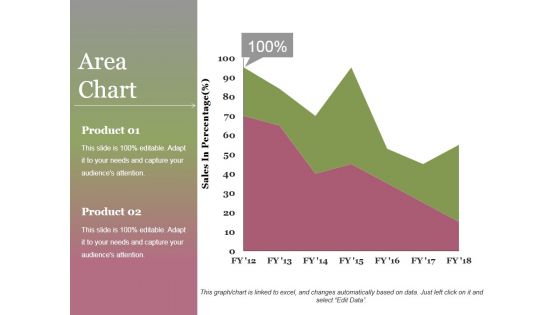
Area Chart Ppt PowerPoint Presentation Infographics File Formats
This is a area chart ppt powerpoint presentation infographics file formats. This is a two stage process. The stages in this process are area chart, product, sales in percentage, growth, success.
Column Chart Ppt PowerPoint Presentation Gallery Slide Portrait
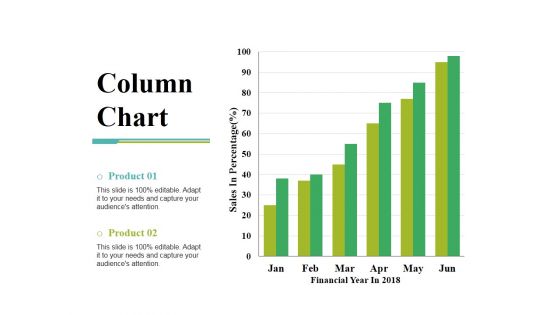
This is a column chart ppt powerpoint presentation gallery slide portrait. This is a two stage process. The stages in this process are sales in percentage, financial year, product, bar graph, growth.
Column Chart Ppt PowerPoint Presentation Gallery Design Inspiration
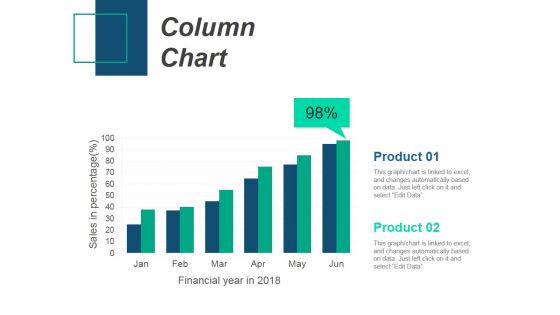
This is a column chart ppt powerpoint presentation gallery design inspiration. This is a two stage process. The stages in this process are column chart, product, sales in percentage, financial years.
Circle Of Marketing For Growth Sample Diagram Ppt Images Gallery
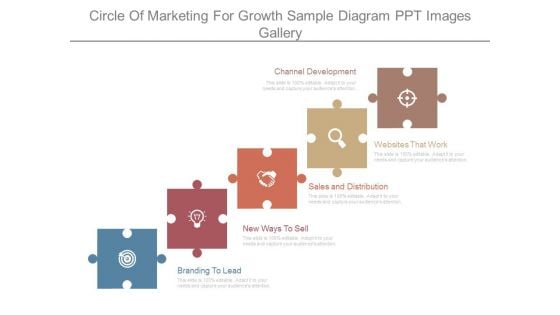
This is a circle of marketing for growth sample diagram ppt images gallery. This is a five stage process. The stages in this process are channel development, websites that work, sales and distribution, new ways to sell, branding to lead.
Column Chart Ppt PowerPoint Presentation Model Graphics Download
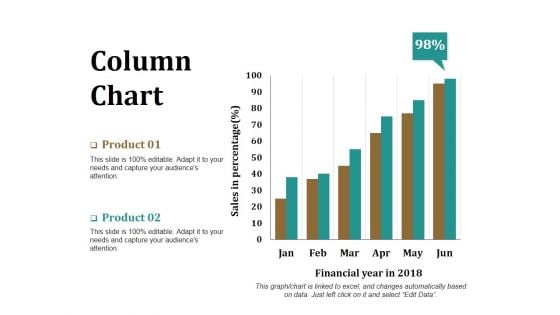
This is a column chart ppt powerpoint presentation model graphics download. This is a two stage process. The stages in this process are product, financial year, sales in percentage, bar graph, success.
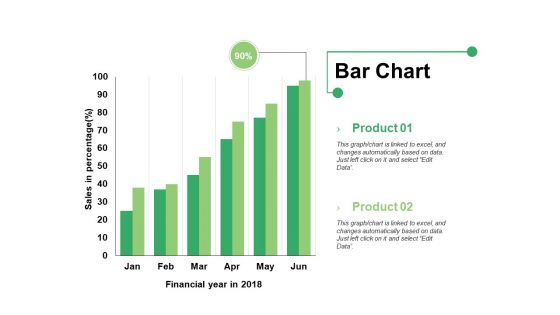
Bar Chart Ppt PowerPoint Presentation Infographics Format Ideas
This is a bar chart ppt powerpoint presentation infographics format ideas. This is a two stage process. The stages in this process are bar graph, product, financial year, sales in percentage.
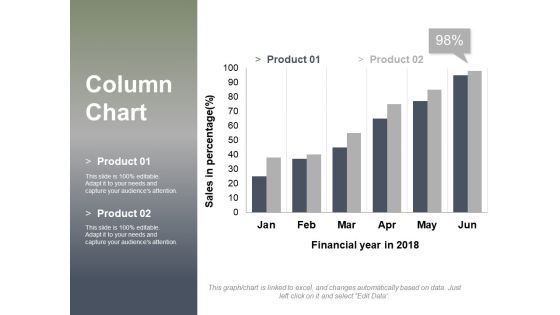
Column Chart Ppt PowerPoint Presentation Layouts Design Inspiration
This is a column chart ppt powerpoint presentation layouts design inspiration. This is a two stage process. The stages in this process are sales in percentage, financial year in, graph, business, finance, marketing.
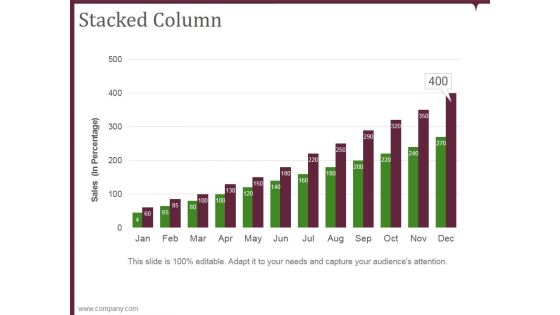
Stacked Column Template 2 Ppt PowerPoint Presentation Visuals
This is a stacked column template 2 ppt powerpoint presentation visuals. This is a twelve stage process. The stages in this process are business, marketing, analysis, sales in percentage, finance, growth strategy.
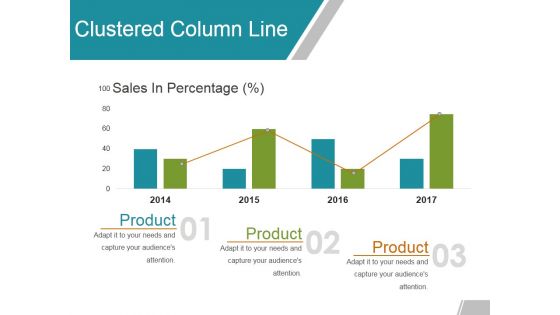
Clustered Column Line Ppt Powerpoint Presentation Gallery Mockup
This is a clustered column line ppt powerpoint presentation gallery mockup. This is a four stage process. The stages in this process are product, sales in percentage, product, growth.
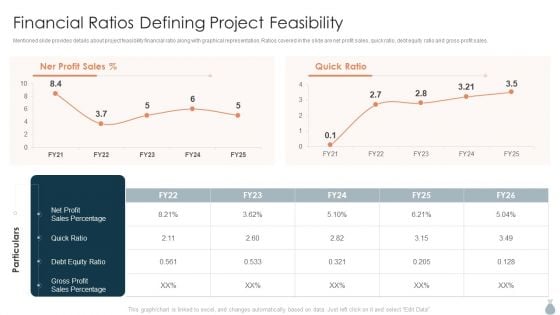
Real Estate Development Project Financing Financial Ratios Defining Project Feasibility Themes PDF
Mentioned slide provides details about project feasibility financial ratio along with graphical representation. Ratios covered in the slide are net profit sales, quick ratio, debt equity ratio and gross profit sales.Deliver and pitch your topic in the best possible manner with this Real Estate Development Project Financing Financial Ratios Defining Project Feasibility Themes PDF. Use them to share invaluable insights on Debt Equity, Sales Percentage, Gross Profit and impress your audience. This template can be altered and modified as per your expectations. So, grab it now.
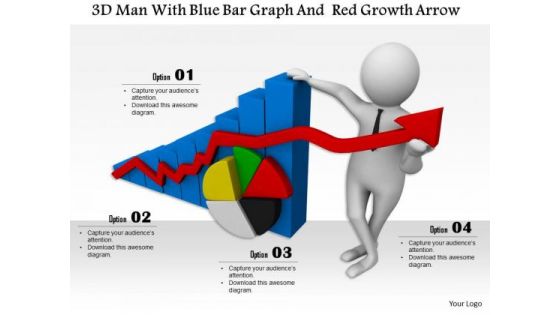
3d Man With Blue Bar Graph And Red Growth Arrow
This Power Point diagram has been designed with graphic of 3d man and business graphs. This conceptual image can be used to displays business progress and growth. Use this editable slide for business and sales growth related presentations.

Stock Photo American Flag Upward Arrow PowerPoint Slide
Show the growth of US market and marketing strategy with this innovative image slide. This image slide contains the graphic of US flag and upward arrow. Use this image for your US business and sales growth related topics.
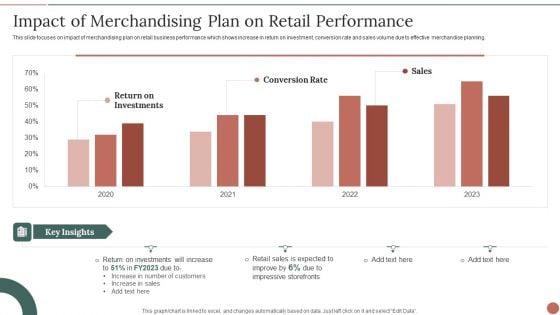
Retail Business Product Planning Procedure Impact Of Merchandising Plan On Retail Performance Diagrams PDF
This slide focuses on impact of merchandising plan on retail business performance which shows increase in return on investment, conversion rate and sales volume due to effective merchandise planning. Deliver and pitch your topic in the best possible manner with this Retail Business Product Planning Procedure Impact Of Merchandising Plan On Retail Performance Diagrams PDF. Use them to share invaluable insights on Retail Sales, Increase In Sales, Investments and impress your audience. This template can be altered and modified as per your expectations. So, grab it now.
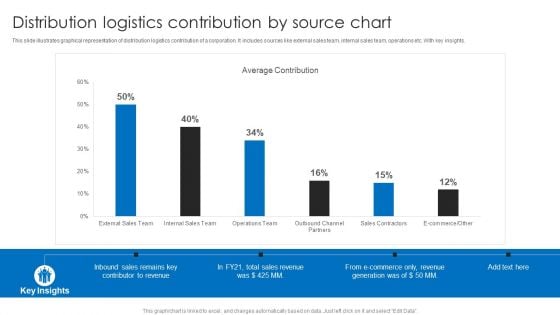
Distribution Logistics Contribution By Source Chart Ppt Model Guidelines PDF
This slide illustrates graphical representation of distribution logistics contribution of a corporation. It includes sources like external sales team, internal sales team, operations etc. With key insights. Showcasing this set of slides titled Distribution Logistics Contribution By Source Chart Ppt Model Guidelines PDF. The topics addressed in these templates are Average Contribution, Total Sales Revenue, E Commerce. All the content presented in this PPT design is completely editable. Download it and make adjustments in color, background, font etc. as per your unique business setting.
Column Chart Ppt PowerPoint Presentation Ideas Vector
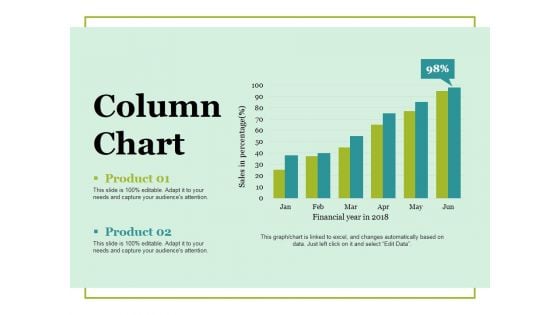
This is a column chart ppt powerpoint presentation ideas vector. This is a two stage process. The stages in this process are column chart, product, financial years, sales in percentage, growth.
Column Chart Ppt PowerPoint Presentation Layouts Tips
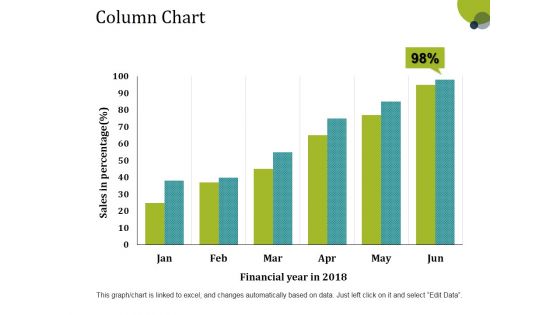
This is a column chart ppt powerpoint presentation layouts tips. This is a six stage process. The stages in this process are sales in percentage, financial year, bar graph, growth, success.
Column Chart Ppt PowerPoint Presentation Slides Show
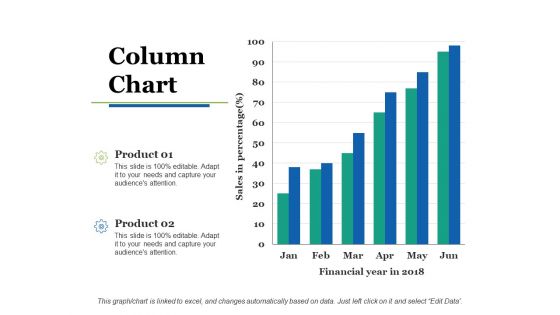
This is a column chart ppt powerpoint presentation slides show. This is a two stage process. The stages in this process are column chart, product, sales in percentage, financial year, growth.
Clustered Column Line Ppt PowerPoint Presentation Model Rules
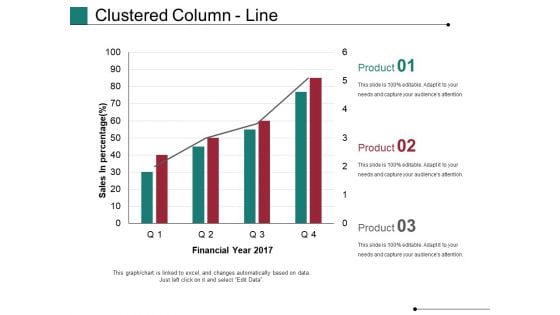
This is a clustered column line ppt powerpoint presentation model rules. This is a four stage process. The stages in this process are financial year, sales in percentage, business, marketing, growth, graph.
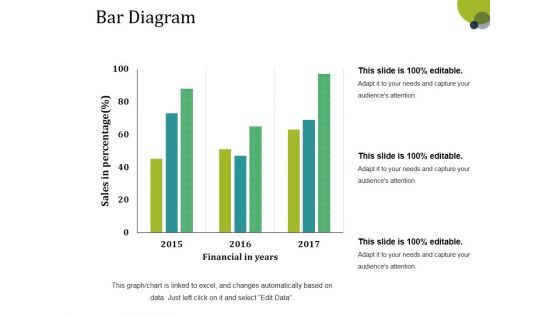
Bar Diagram Ppt PowerPoint Presentation Gallery Structure
This is a bar diagram ppt powerpoint presentation gallery structure. This is a three stage process. The stages in this process are financial in years, sales in percentage, bar graph, growth, success.
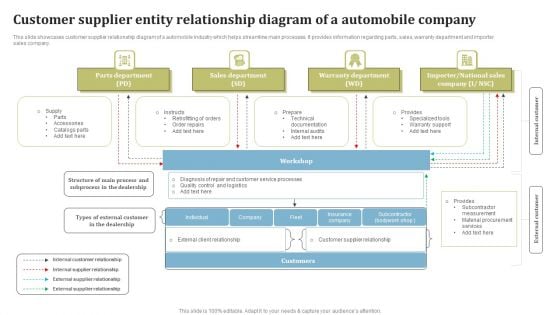
Customer Supplier Entity Relationship Diagram Of A Automobile Company Pictures PDF
This slide showcases customer supplier relationship diagram of a automobile industry which helps streamline main processes. It provides information regarding parts, sales, warranty department and importer sales company. Persuade your audience using this Customer Supplier Entity Relationship Diagram Of A Automobile Company Pictures PDF. This PPT design covers one stages, thus making it a great tool to use. It also caters to a variety of topics including Parts Department, Sales Department, Warranty Department . Download this PPT design now to present a convincing pitch that not only emphasizes the topic but also showcases your presentation skills.
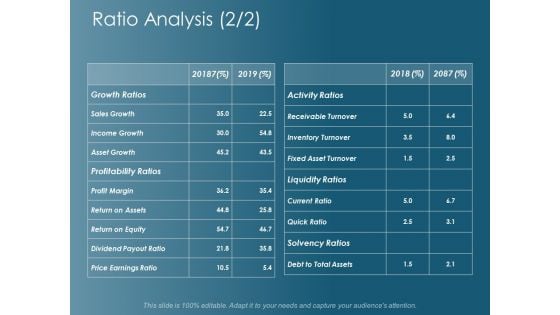
Ratio Analysis Growth Ratios Ppt Powerpoint Presentation Gallery Graphics Download
This is a ratio analysis growth ratios ppt powerpoint presentation gallery graphics download. This is a two stage process. The stages in this process are ratio analysis, sales growth, growth ratios, asset growth, profitability ratios.
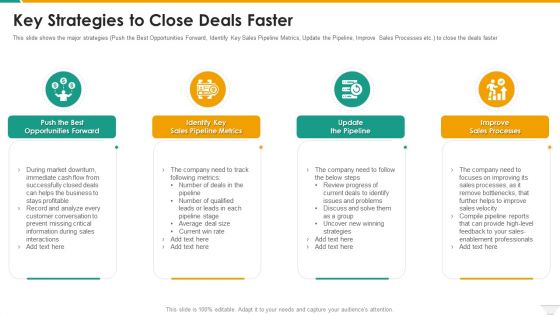
Key Strategies To Close Deals Faster Diagrams PDF
This slide shows the major strategies Push the Best Opportunities Forward, Identify Key Sales Pipeline Metrics, Update the Pipeline, Improve Sales Processes etc. to close the deals faster This is a Key Strategies To Close Deals Faster Diagrams PDF template with various stages. Focus and dispense information on four stages using this creative set, that comes with editable features. It contains large content boxes to add your information on topics like Opportunities, Sales, Metrics, Average. You can also showcase facts, figures, and other relevant content using this PPT layout. Grab it now.
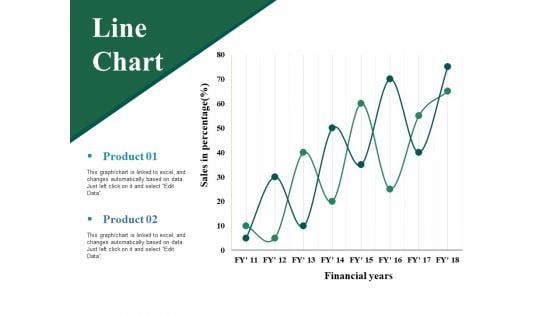
Line Chart Ppt PowerPoint Presentation Professional Grid
This is a line chart ppt powerpoint presentation professional grid. This is a two stage process. The stages in this process are sales in percentage, financial years, product, line chart.
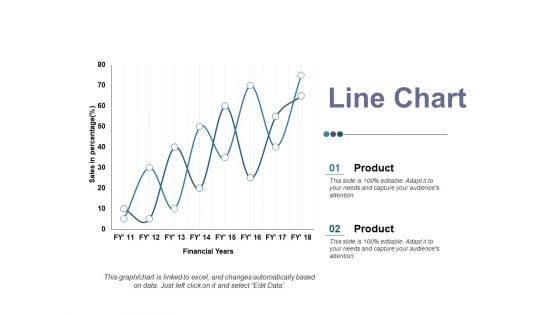
Line Chart Ppt PowerPoint Presentation Ideas Elements
This is a line chart ppt powerpoint presentation ideas elements. This is a two stage process. The stages in this process are product, sales in percentage, financial year, business, line chart.
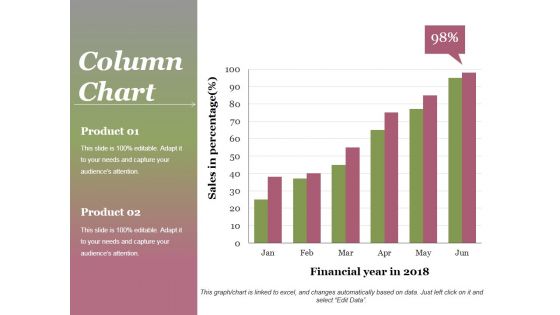
Column Chart Ppt PowerPoint Presentation Gallery Background
This is a column chart ppt powerpoint presentation gallery background. This is a two stage process. The stages in this process are product, sales in percentage, financial year, graph, success.
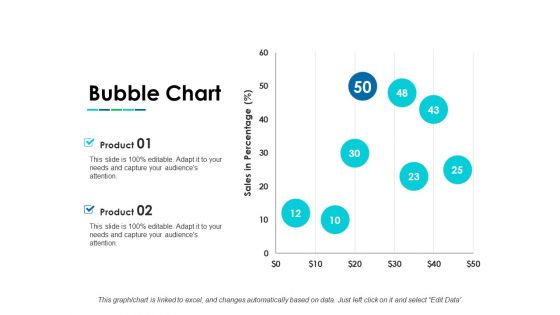
Bubble Chart Ppt PowerPoint Presentation Infographic Template Layouts
This is a bubble chart ppt powerpoint presentation infographic template layouts. This is a two stage process. The stages in this process are bubble chart, product, sales in percentage, growth.
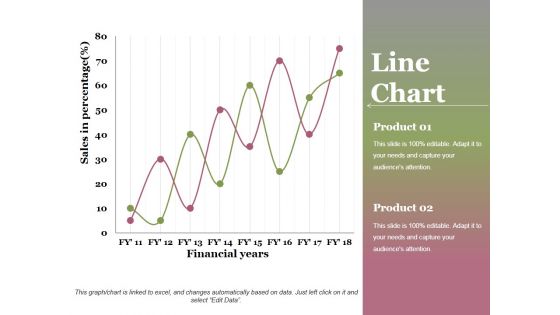
Line Chart Ppt PowerPoint Presentation Professional Graphics Design
This is a line chart ppt powerpoint presentation professional graphics design. This is a two stage process. The stages in this process are financial years, sales in percentage, product, growth, success.
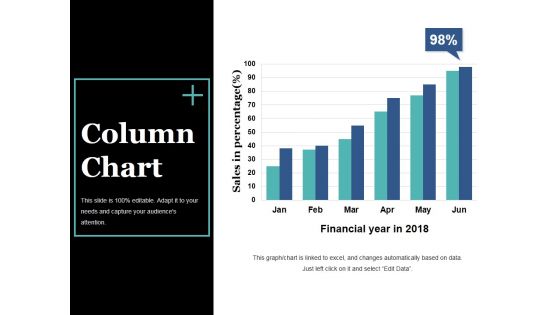
Column Chart Ppt PowerPoint Presentation Slides Visual Aids
This is a column chart ppt powerpoint presentation slides visual aids. This is a six stage process. The stages in this process are bar graph, growth, success, sales in percentage, financial year.
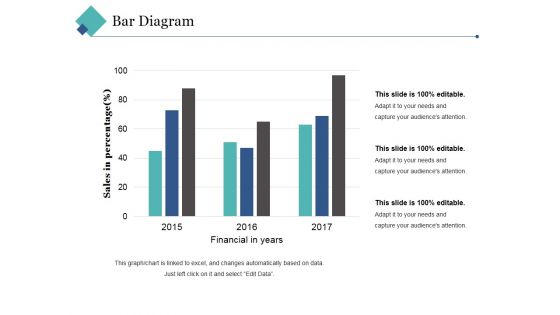
Bar Diagram Ppt PowerPoint Presentation Pictures Background Image
This is a bar diagram ppt powerpoint presentation pictures background image. This is a three stage process. The stages in this process are financial in years, sales in percentage, bar graph, growth, success.
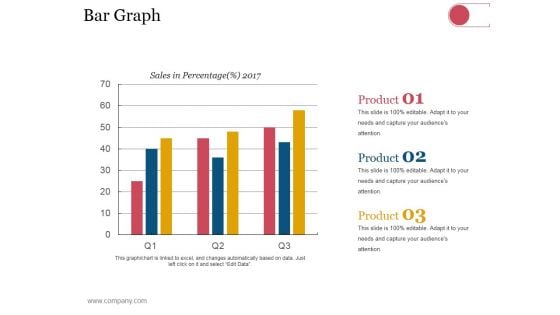
Bar Graph Ppt PowerPoint Presentation Visual Aids Model
This is a bar graph ppt powerpoint presentation visual aids model. This is a three stage process. The stages in this process are business, strategy, analysis, planning, sales in percentage.
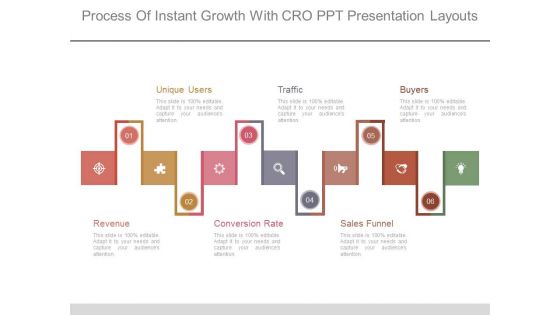
Process Of Instant Growth With Cro Ppt Presentation Layouts
This is a process of instant growth with cro ppt presentation layouts. This is a six stage process. The stages in this process are unique users, revenue, conversion rate, traffic, buyers, sales funnel.
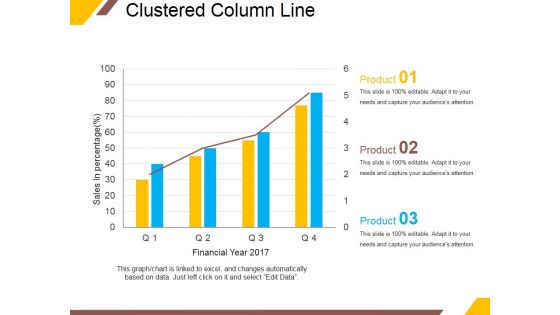
Clustered Column Line Ppt PowerPoint Presentation Portfolio Outline
This is a clustered column line ppt powerpoint presentation portfolio outline. This is a four stage process. The stages in this process are sales in percentage, financial year, product, graph, growth.
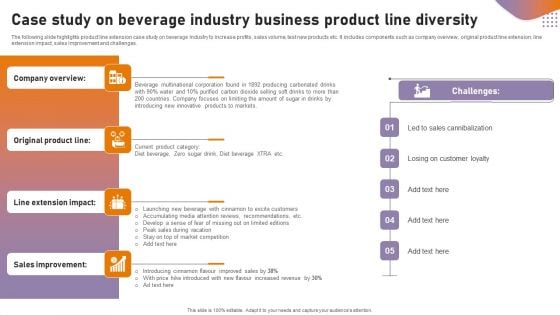
Case Study On Beverage Industry Business Product Line Diversity Themes PDF
The following slide highlights product line extension case study on beverage industry to increase profits, sales volume, test new products etc. It includes components such as company overview, original product line extension, line extension impact, sales improvement and challenges. Presenting Case Study On Beverage Industry Business Product Line Diversity Themes PDF to dispense important information. This template comprises four stages. It also presents valuable insights into the topics including Company Overview, Original Product Line, Sales Improvement. This is a completely customizable PowerPoint theme that can be put to use immediately. So, download it and address the topic impactfully.
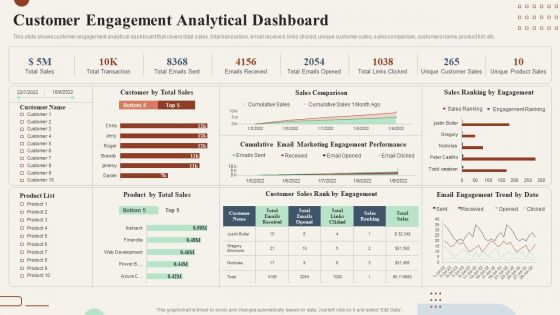
Action Plan To Enhance Customer Engagement Analytical Dashboard Elements PDF
This slide shows customer engagement analytical dashboard that covers total sales, total transaction, email received, links clicked, unique customer sales, sales comparison, customers name, product list. Present like a pro with Action Plan To Enhance Customer Engagement Analytical Dashboard Elements PDF Create beautiful presentations together with your team, using our easy-to-use presentation slides. Share your ideas in real-time and make changes on the fly by downloading our templates. So whether youre in the office, on the go, or in a remote location, you can stay in sync with your team and present your ideas with confidence. With Slidegeeks presentation got a whole lot easier. Grab these presentations today.
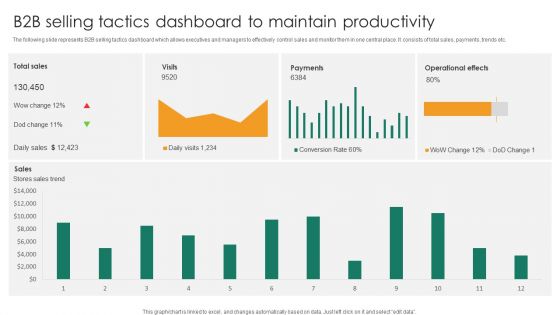
B2b Selling Tactics Dashboard To Maintain Productivity Introduction PDF
The following slide represents B2B selling tactics dashboard which allows executives and managers to effectively control sales and monitor them in one central place. It consists of total sales, payments, trends etc.Pitch your topic with ease and precision using this B2b Selling Tactics Dashboard To Maintain Productivity Introduction PDF. This layout presents information on Operational Effects, Stores Sales Trend, Conversion Rate. It is also available for immediate download and adjustment. So, changes can be made in the color, design, graphics or any other component to create a unique layout.
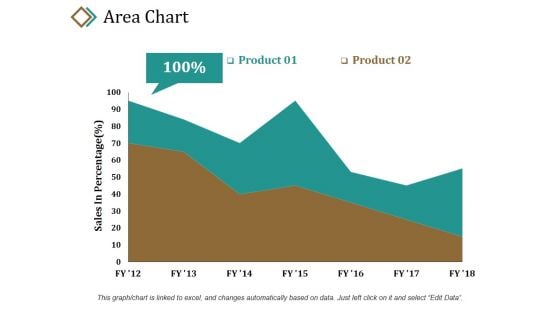
Area Chart Ppt PowerPoint Presentation Summary Example Introduction
This is a area chart ppt powerpoint presentation summary example introduction. This is a two stage process. The stages in this process are product, sales in percentage, percentage, area chart, business.
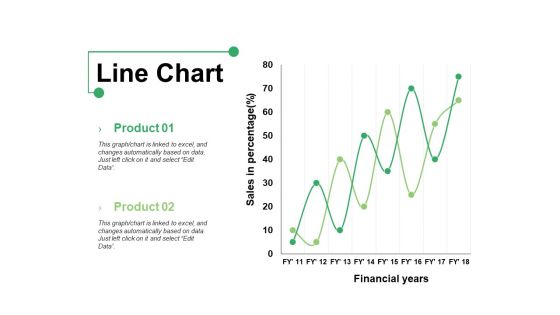
Line Chart Ppt PowerPoint Presentation Show Graphics Example
This is a line chart ppt powerpoint presentation show graphics example. This is a two stage process. The stages in this process are product, line chart, financial years, sales in percentage.
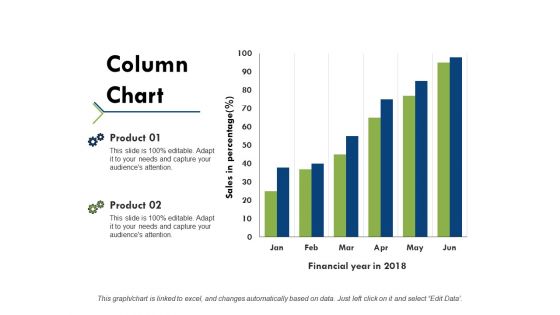
Column Chart Ppt PowerPoint Presentation Portfolio Example Topics
This is a column chart ppt powerpoint presentation portfolio example topics. This is a two stage process. The stages in this process are product, financial year, sales in percentage, column chart.

Brand Promotion Communication Strategy Dashboard For Analyzing Brand Perception Introduction PDF
This slide covers the dashboard for tracking brand reputation. It also includes metrics such as new customer lifetime value, customer acquisition cost, target met, above sales target, average weekly sales revenue, etc. Deliver an awe inspiring pitch with this creative Brand Promotion Communication Strategy Dashboard For Analyzing Brand Perception Introduction PDF bundle. Topics like New customer YTD, Sales revenue YTD, Profit YTD can be discussed with this completely editable template. It is available for immediate download depending on the needs and requirements of the user.
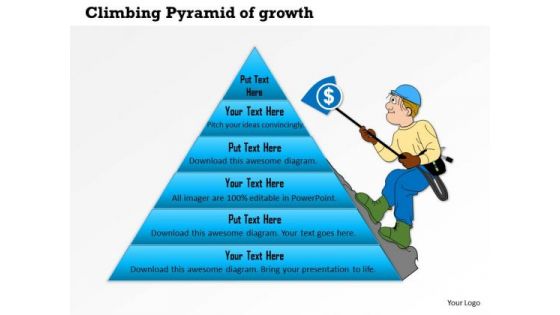
Business Framework Climbing Pyramid Of Growth PowerPoint Presentation
This Power Point template slide has been crafted with graphic of map. This map is a classical strategy map. Use this map for your business and sales strategy representation in any presentation.
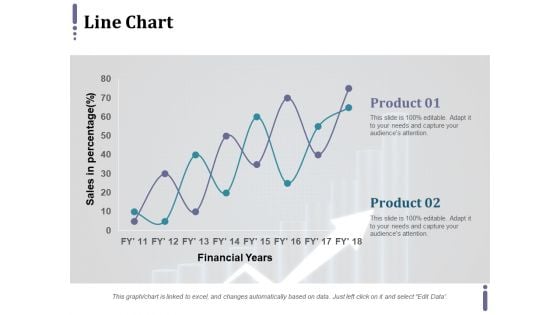
Line Chart Ppt PowerPoint Presentation Infographic Template Master Slide
This is a line chart ppt powerpoint presentation infographic template master slide. This is a two stage process. The stages in this process are product, financial years, sales in percentage.
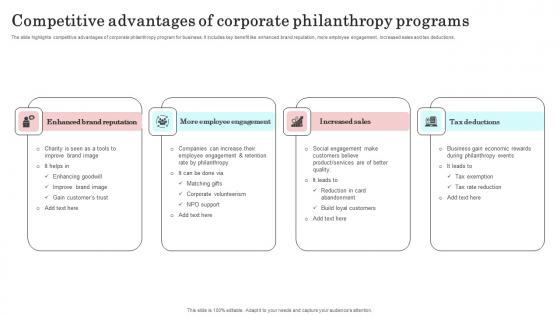
Competitive Advantages Of Corporate Philanthropy Programs Diagrams Pdf
The slide highlights competitive advantages of corporate philanthropy program for business. It includes key benefit like enhanced brand reputation, more employee engagement, increased sales and tax deductions. Pitch your topic with ease and precision using this Competitive Advantages Of Corporate Philanthropy Programs Diagrams Pdf. This layout presents information on Enhanced Brand Reputation, More Employee Engagement, Increased Sales. It is also available for immediate download and adjustment. So, changes can be made in the color, design, graphics or any other component to create a unique layout. The slide highlights competitive advantages of corporate philanthropy program for business. It includes key benefit like enhanced brand reputation, more employee engagement, increased sales and tax deductions.
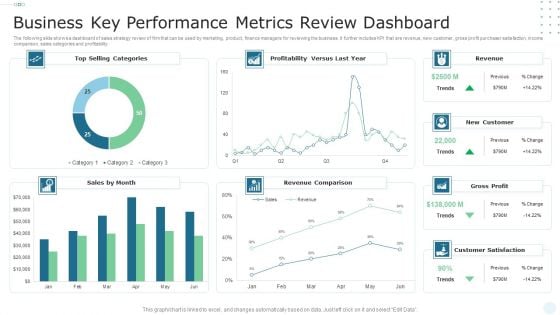
Business Key Performance Metrics Review Dashboard Portrait PDF
The following slide shows a dashboard of sales strategy review of firm that can be used by marketing, product, finance managers for reviewing the business. It further includes KPI that are revenue, new customer, gross profit purchaser satisfaction, income comparison, sales categories and profitability. Showcasing this set of slides titled Business Key Performance Metrics Review Dashboard Portrait PDF. The topics addressed in these templates are Sales, Revenue Comparison, Profitability. All the content presented in this PPT design is completely editable. Download it and make adjustments in color, background, font etc. as per your unique business setting.
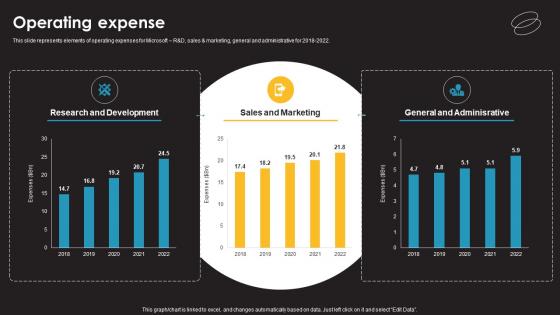
Operating Expense Information Technology Services Provider Company Profile CP SS V
This slide represents elements of operating expenses for Microsoft RandD, sales and marketing, general and administrative for 2018-2022. Make sure to capture your audiences attention in your business displays with our gratis customizable Operating Expense Information Technology Services Provider Company Profile CP SS V. These are great for business strategies, office conferences, capital raising or task suggestions. If you desire to acquire more customers for your tech business and ensure they stay satisfied, create your own sales presentation with these plain slides. This slide represents elements of operating expenses for Microsoft RandD, sales and marketing, general and administrative for 2018-2022.
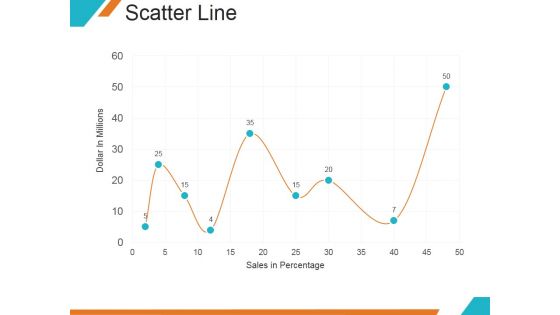
Scatter Line Ppt PowerPoint Presentation Backgrounds
This is a scatter line ppt powerpoint presentation backgrounds. This is a nine stage process. The stages in this process are dollar in millions, sales in percentage, graph, growth.

Opportunity Score Ppt PowerPoint Presentation Summary
This is a opportunity score ppt powerpoint presentation summary. This is a five stage process. The stages in this process are high propensity to purchase, ideal target, sales ready, nurture, starburst.
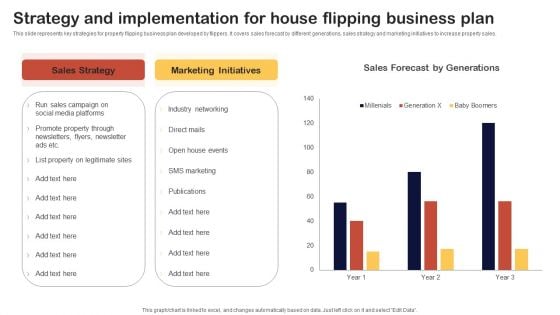
Synopsis For House Flipping Techniques Strategy And Implementation House Flipping Business Information PDF
This slide represents key strategies for property flipping business plan developed by flippers. It covers sales forecast by different generations, sales strategy and marketing initiatives to increase property sales. Find a pre designed and impeccable Synopsis For House Flipping Techniques Strategy And Implementation House Flipping Business Information PDF. The templates can ace your presentation without additional effort. You can download these easy to edit presentation templates to make your presentation stand out from others. So, what are you waiting for Download the template from Slidegeeks today and give a unique touch to your presentation.
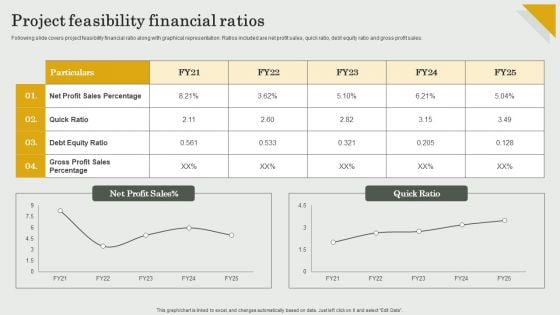
Submission Of Project Viability Report For Bank Loan Project Feasibility Financial Ratios Brochure PDF
Following slide covers project feasibility financial ratio along with graphical representation. Ratios included are net profit sales, quick ratio, debt equity ratio and gross profit sales.Make sure to capture your audiences attention in your business displays with our gratis customizable Submission Of Project Viability Report For Bank Loan Project Feasibility Financial Ratios Brochure PDF. These are great for business strategies, office conferences, capital raising or task suggestions. If you desire to acquire more customers for your tech business and ensure they stay satisfied, create your own sales presentation with these plain slides.
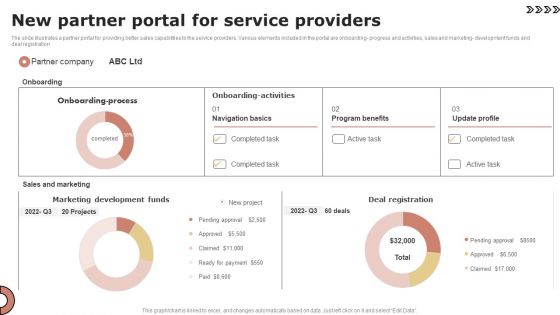
New Partner Portal For Service Providers Formats PDF
The slide illustrates a partner portal for providing better sales capabilities to the service providers. Various elements included in the portal are onboarding- progress and activities, sales and marketing- development funds and deal registration. Showcasing this set of slides titled New Partner Portal For Service Providers Formats PDF. The topics addressed in these templates are Onboarding Progress And Activities, Sales And Marketing, Development Funds, Deal Registration. All the content presented in this PPT design is completely editable. Download it and make adjustments in color, background, font etc. as per your unique business setting.


 Continue with Email

 Home
Home


