Sales Process
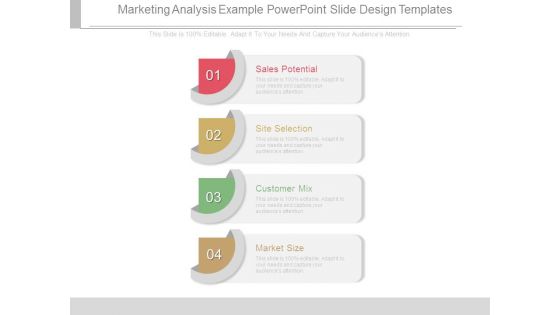
Marketing Analysis Example Powerpoint Slide Design Templates
This is a marketing analysis example powerpoint slide design templates. This is a four stage process. The stages in this process are sales potential, site selection, customer mix, market size.
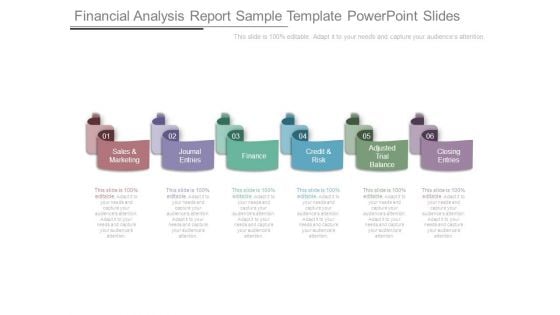
Financial Analysis Report Sample Template Powerpoint Slides
This is a financial analysis report sample template powerpoint slides. This is a six stage process. The stages in this process are sales and marketing, journal entries, finance, credit and risk, adjusted trial balance, closing entries.
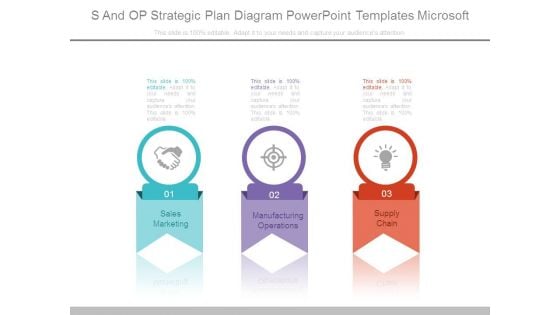
S And Op Strategic Plan Diagram Powerpoint Templates Microsoft
This is a s and op strategic plan diagram powerpoint templates microsoft. This is a three stage process. The stages in this process are sales marketing, manufacturing operations, supply chain.
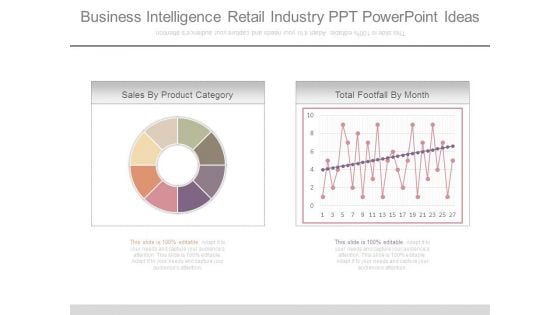
Business Intelligence Retail Industry Ppt Powerpoint Ideas
This is a business intelligence retail industry ppt powerpoint ideas. This is a two stage process. The stages in this process are sales by product category, total footfall by month.
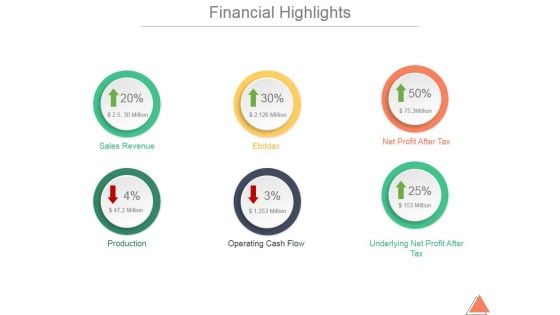
Financial Highlights Template 2 Ppt PowerPoint Presentation Inspiration
This is a financial highlights template 2 ppt powerpoint presentation inspiration. This is a six stage process. The stages in this process are sales revenue, ebitdax, net profit after tax, production, operating cash flow, underlying net profit, after tax.
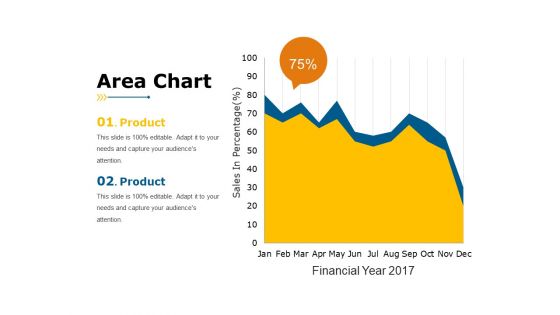
Area Chart Ppt PowerPoint Presentation Slides Rules
This is a area chart ppt powerpoint presentation slides rules. This is a two stage process. The stages in this process are sales in percentage, business, marketing, product, finance.
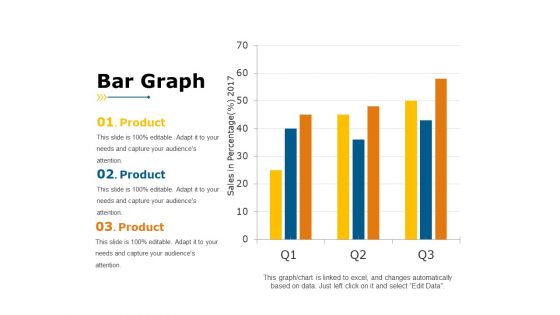
Bar Graph Ppt PowerPoint Presentation Portfolio Example
This is a bar graph ppt powerpoint presentation portfolio example. This is a three stage process. The stages in this process are sales in percentage, year, business, product, business, graph.
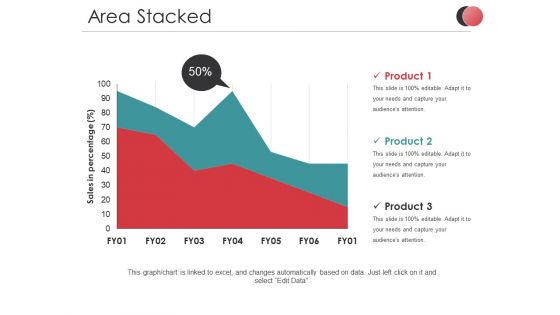
Area Stacked Ppt PowerPoint Presentation Diagram Images
This is a area stacked ppt powerpoint presentation diagram images. This is a two stage process. The stages in this process are sales in percentage, product, business, marketing, finance.
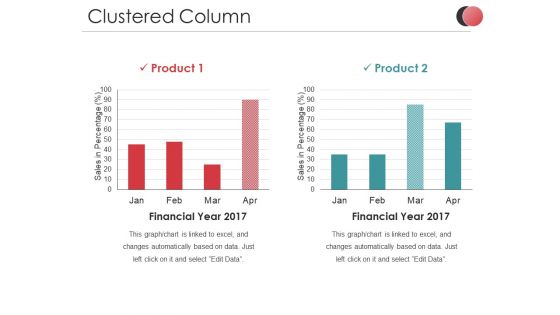
Clustered Column Ppt PowerPoint Presentation Slides Ideas
This is a clustered column ppt powerpoint presentation slides ideas. This is a two stage process. The stages in this process are sales in percentage, business, marketing, finance, graph.
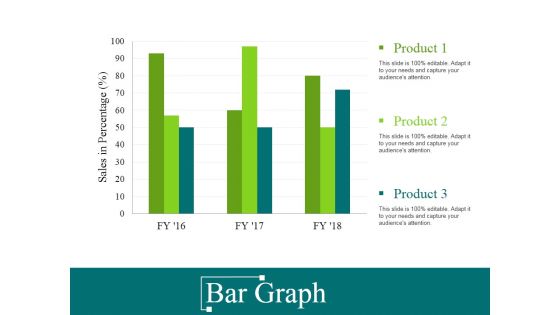
Bar Graph Ppt PowerPoint Presentation Gallery Grid
This is a bar graph ppt powerpoint presentation gallery grid. This is a three stage process. The stages in this process are sales in percentage, product, finance, business, marketing.
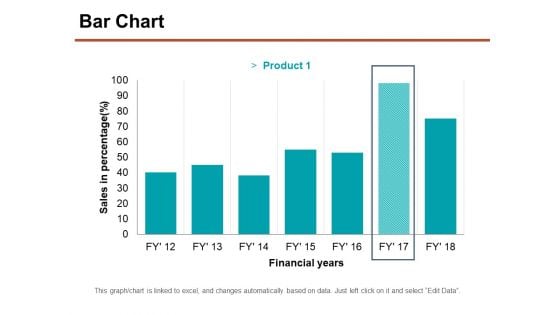
Bar Chart Ppt PowerPoint Presentation Professional Graphics Download
This is a bar chart ppt powerpoint presentation professional graphics download. This is a seven stage process. The stages in this process are sales in percentage, financial years, chart, business.
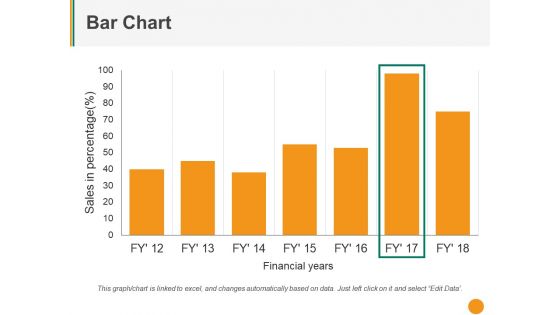
Bar Chart Ppt PowerPoint Presentation Styles Outfit
This is a bar chart ppt powerpoint presentation styles outfit. This is a Seven stage process. The stages in this process are sales in percentage, financial years, graph, business.
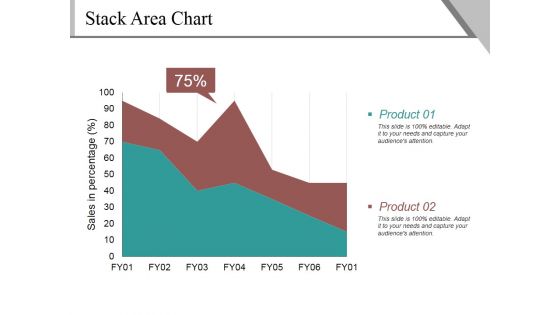
Stack Area Chart Ppt PowerPoint Presentation Gallery Guidelines
This is a stack area chart ppt powerpoint presentation gallery guidelines. This is a two stage process. The stages in this process are sales in percentage, product, percentage, business.
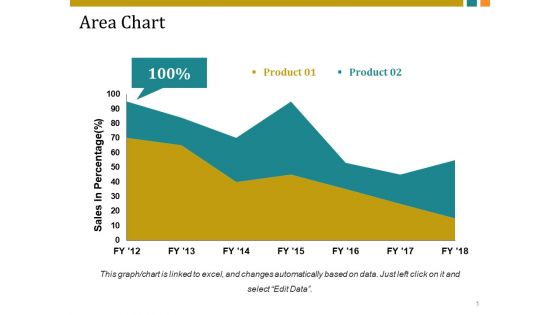
Area Chart Ppt PowerPoint Presentation Professional Brochure
This is a area chart ppt powerpoint presentation professional brochure. This is a two stage process. The stages in this process are sales in percentage, business, marketing, finance, graph.

Bar Chart Ppt PowerPoint Presentation Portfolio Diagrams
This is a bar chart ppt powerpoint presentation portfolio diagrams. This is a three stage process. The stages in this process are sales in percentage, business, marketing, graph, finance.
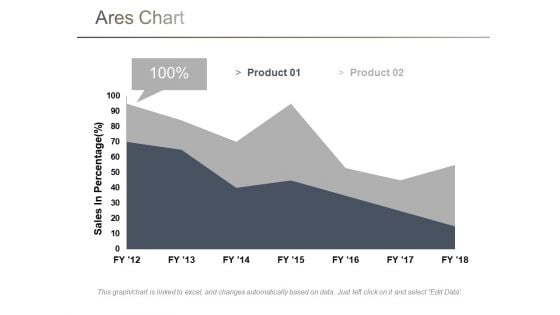
Area Chart Ppt PowerPoint Presentation Model Influencers
This is a area chart ppt powerpoint presentation model influencers. This is a two stage process. The stages in this process are sales in percentage, chart, business, marketing, finance.
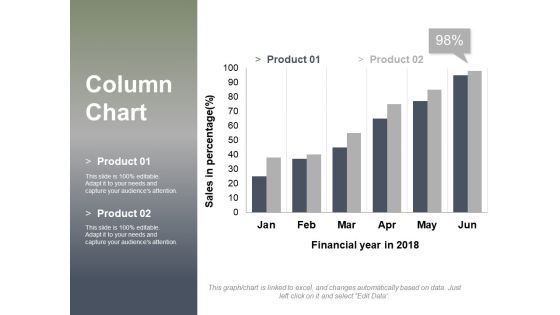
Column Chart Ppt PowerPoint Presentation Layouts Design Inspiration
This is a column chart ppt powerpoint presentation layouts design inspiration. This is a two stage process. The stages in this process are sales in percentage, financial year in, graph, business, finance, marketing.

Line Chart Ppt PowerPoint Presentation Infographics Graphic Images
This is a line chart ppt powerpoint presentation infographics graphic images. This is a two stage process. The stages in this process are sales in percentage, financial years, growth, business, marketing.
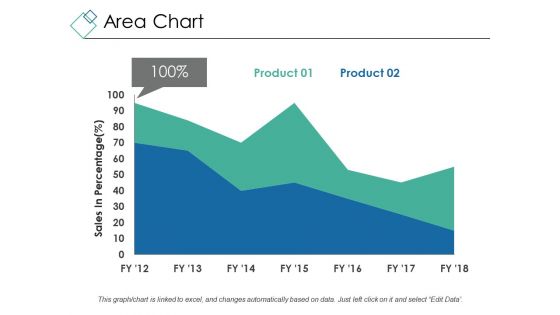
Area Chart Ppt PowerPoint Presentation Inspiration Demonstration
This is a area chart ppt powerpoint presentation inspiration demonstration. This is a two stage process. The stages in this process are sales in percentage, chart, percentage, business, marketing.
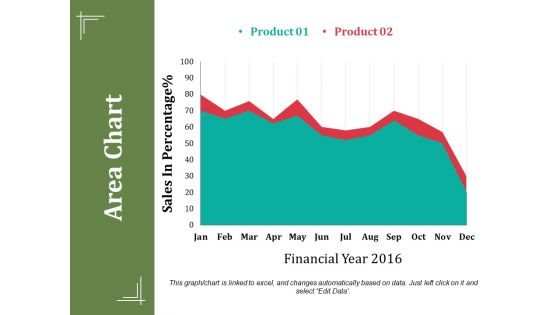
Area Chart Ppt PowerPoint Presentation Summary Show
This is a area chart ppt powerpoint presentation summary show. This is a two stage process. The stages in this process are sales in percentage, financial year, business, marketing, finance.
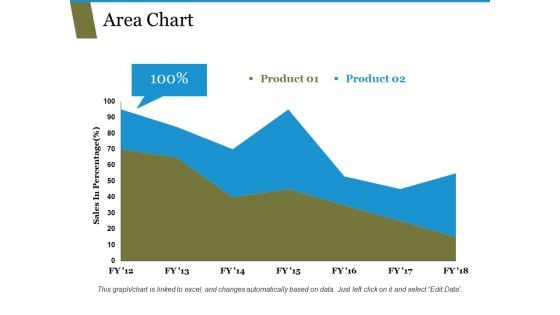
Area Chart Ppt PowerPoint Presentation Portfolio Templates
This is a area chart ppt powerpoint presentation portfolio templates. This is a two stage process. The stages in this process are sales in percentage, chart, business, marketing, finance.
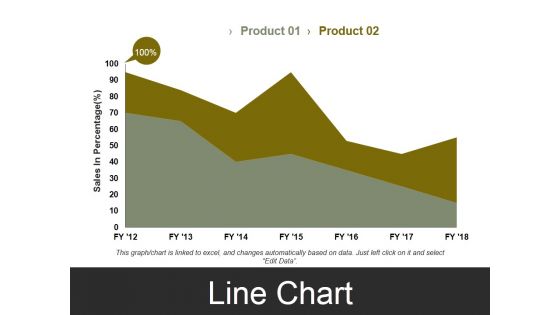
Line Chart Template 3 Ppt PowerPoint Presentation Styles Visual Aids
This is a line chart template 3 ppt powerpoint presentation styles visual aids. This is a two stage process. The stages in this process are sales in percentage, business, marketing, finance, graph.
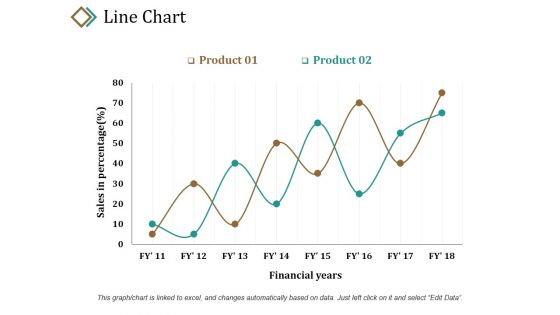
Line Chart Ppt PowerPoint Presentation Layouts Example
This is a line chart ppt powerpoint presentation layouts example. This is a two stage process. The stages in this process are sales in percentage, product, financial years, growth, success.
Bar Chart Ppt PowerPoint Presentation Icon Layout
This is a bar chart ppt powerpoint presentation icon layout. This is a one stage process. The stages in this process are sales in percentage, financial years, bar chart, finance, marketing.
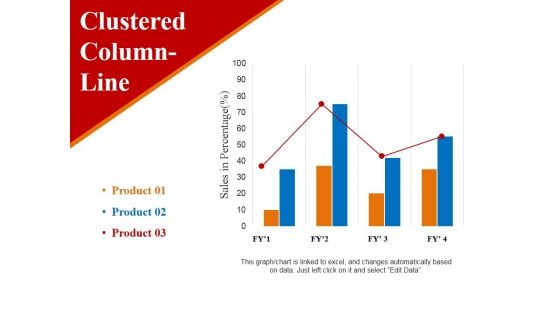
clustered column line ppt powerpoint presentation ideas example
This is a clustered column line ppt powerpoint presentation ideas example. This is a three stage process. The stages in this process are sales in percentage, business, marketing, finance, graph.
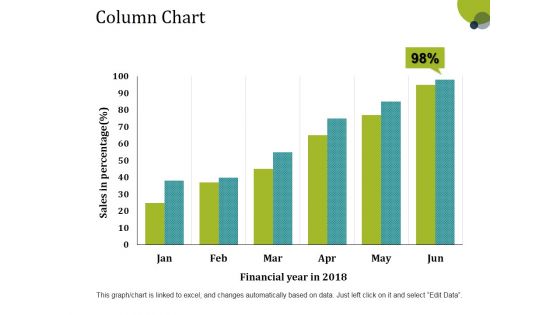
Column Chart Ppt PowerPoint Presentation Layouts Tips
This is a column chart ppt powerpoint presentation layouts tips. This is a six stage process. The stages in this process are sales in percentage, financial year, bar graph, growth, success.
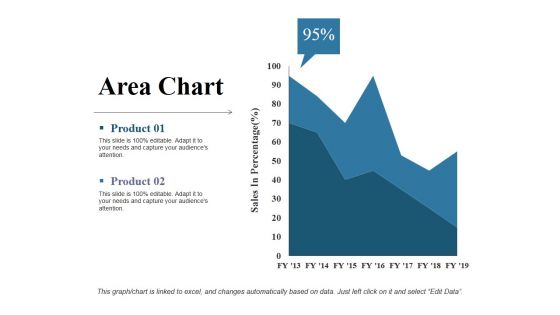
Area Chart Ppt PowerPoint Presentation Slides Example
This is a area chart ppt powerpoint presentation slides example. This is a two stage process. The stages in this process are sales in percentage, product, area chart, business, finance.
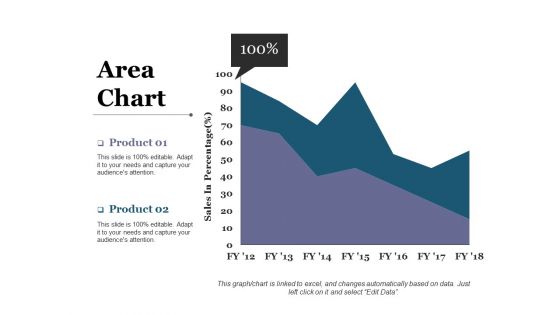
Area Chart Ppt PowerPoint Presentation Model Introduction
This is a area chart ppt powerpoint presentation model introduction. This is a two stage process. The stages in this process are sales in percentage, area chart, percentage, business, marketing.
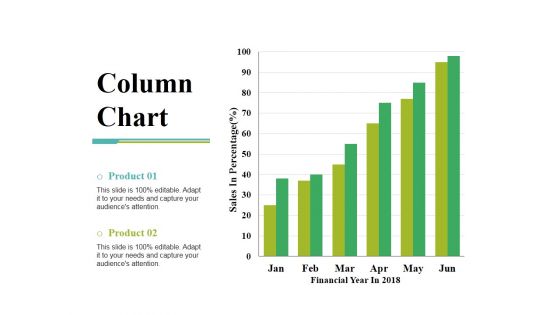
Column Chart Ppt PowerPoint Presentation Gallery Slide Portrait
This is a column chart ppt powerpoint presentation gallery slide portrait. This is a two stage process. The stages in this process are sales in percentage, financial year, product, bar graph, growth.
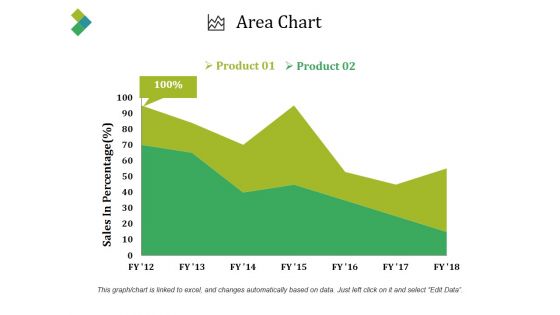
Area Chart Ppt PowerPoint Presentation Infographics Good
This is a area chart ppt powerpoint presentation infographics good. This is a two stage process. The stages in this process are sales in percentage, product, area chart, business, percentage.
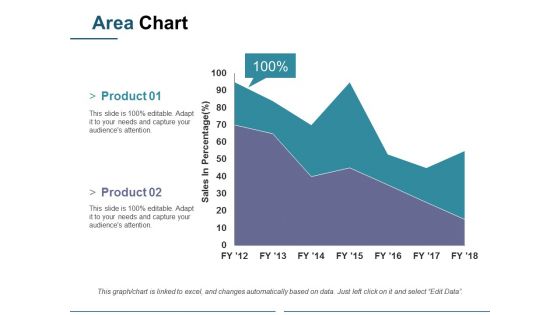
Area Chart Ppt PowerPoint Presentation Pictures Vector
This is a area chart ppt powerpoint presentation pictures vector. This is a two stage process. The stages in this process are sales in percentage, business, marketing, graph, percentage.
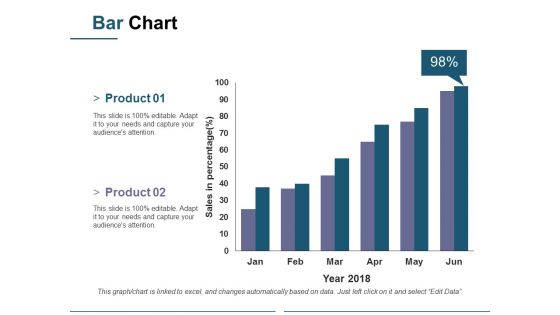
Bar Chart Ppt PowerPoint Presentation Model Sample
This is a bar chart ppt powerpoint presentation model sample. This is a two stage process. The stages in this process are sales in percentage, business, marketing, graph, percentage, year.
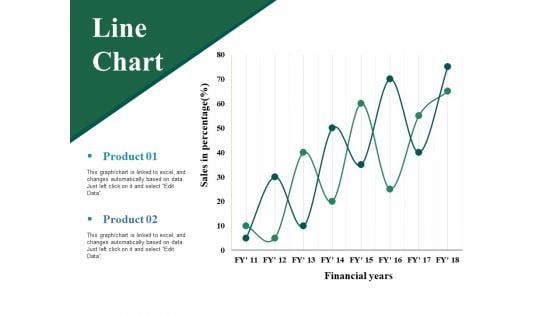
Line Chart Ppt PowerPoint Presentation Professional Grid
This is a line chart ppt powerpoint presentation professional grid. This is a two stage process. The stages in this process are sales in percentage, financial years, product, line chart.
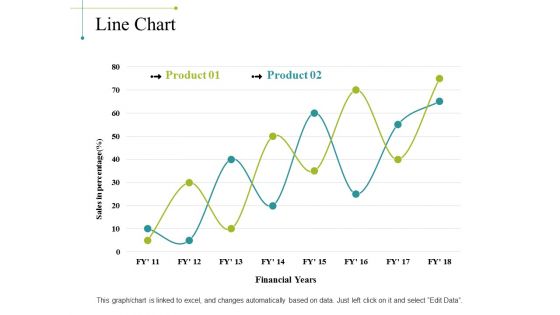
Line Chart Ppt PowerPoint Presentation Portfolio Background Image
This is a line chart ppt powerpoint presentation portfolio background image. This is a two stage process. The stages in this process are sales in percentage, financial years, chart, business, marketing, finance.

Clustered Column Ppt PowerPoint Presentation Infographic Template Backgrounds
This is a clustered column ppt powerpoint presentation infographic template backgrounds. This is a two stage process. The stages in this process are sales in percentage, financial year, product.
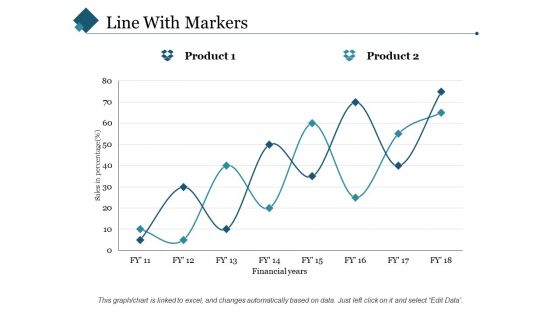
Line With Markers Ppt PowerPoint Presentation Styles Slide Portrait
This is a line with markers ppt powerpoint presentation styles slide portrait. This is a two stage process. The stages in this process are sales in percentage, financial years, product.
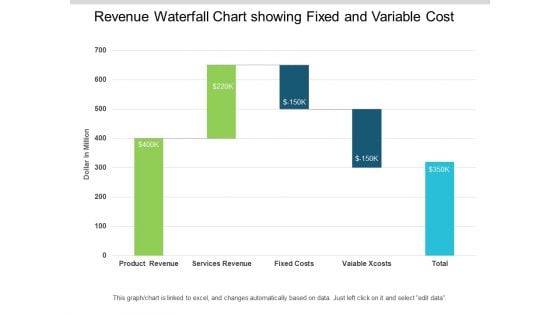
Revenue Waterfall Chart Showing Fixed And Variable Cost Ppt PowerPoint Presentation Infographic Template Images
This is a revenue waterfall chart showing fixed and variable cost ppt powerpoint presentation infographic template images. This is a five stage process. The stages in this process are sales waterfall, waterfall chart, business.
Waterfall Chart Showing Effective Pricing And Profitability Insight Ppt PowerPoint Presentation Icon Graphics
This is a waterfall chart showing effective pricing and profitability insight ppt powerpoint presentation icon graphics. This is a seven stage process. The stages in this process are sales waterfall, waterfall chart, business.
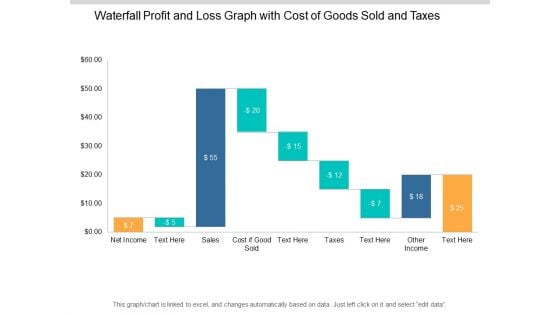
Waterfall Profit And Loss Graph With Cost Of Goods Sold And Taxes Ppt PowerPoint Presentation Show Slideshow
This is a waterfall profit and loss graph with cost of goods sold and taxes ppt powerpoint presentation show slideshow. This is a nine stage process. The stages in this process are sales waterfall, waterfall chart, business.
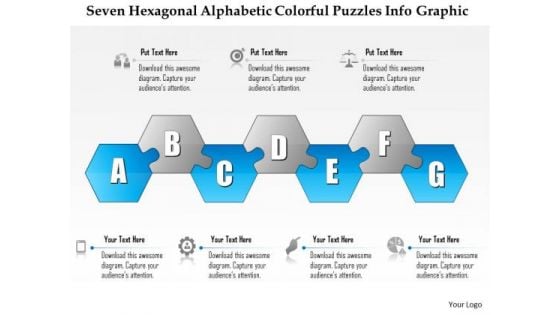
Business Diagram Seven Hexagonal Alphabetic Colorful Puzzles Info Graphic Presentation Template
This innovative power point template has been designed with seven hexagonal alphabetic colorful puzzles graphic. Use this multistage diagram for displaying sequential order of any process flow. Use this template slide and build a strong presentation for business planning.

Shopping Bags With Gifts Festival PowerPoint Templates And PowerPoint Themes 1112
We present our Shopping Bags With Gifts Festival PowerPoint Templates And PowerPoint Themes 1112.Use our Festival PowerPoint Templates because, Highlight the results of you thought process and convince your team of the reasons for selecting a particular path to follow. Use our Holidays PowerPoint Templates because, This business powerpoint template helps expound on the logic of your detailed thought process to take your company forward. Use our Events PowerPoint Templates because,Designed to attract the attention of your audience. Use our Business PowerPoint Templates because,Marketing Strategy Business Template:- Maximising sales of your product is the intended destination. Use our Sales PowerPoint Templates because, Business 3D Circular Puzzle:- Your business and plans for its growth consist of processes that are highly co-related.Use these PowerPoint slides for presentations relating to Shopping bags with gifts, festival, holidays, events, business, sales. The prominent colors used in the PowerPoint template are Red, White, Green Our Shopping Bags With Gifts Festival PowerPoint Templates And PowerPoint Themes 1112 team are great exponents of visual art. They have created some beauties for you.

Bank CRM Software To Improve Client Experience Incorporating Banking Operational Growth
This slide shows the impact of implementation of CRM system in banking sector in business context. It includes 360 degree view of customer, quicker processes, improved sales and marketing efforts and more productive staff. Boost your pitch with our creative Bank CRM Software To Improve Client Experience Incorporating Banking Operational Growth. Deliver an awe-inspiring pitch that will mesmerize everyone. Using these presentation templates you will surely catch everyones attention. You can browse the ppts collection on our website. We have researchers who are experts at creating the right content for the templates. So you do not have to invest time in any additional work. Just grab the template now and use them. This slide shows the impact of implementation of CRM system in banking sector in business context. It includes 360 degree view of customer, quicker processes, improved sales and marketing efforts and more productive staff.
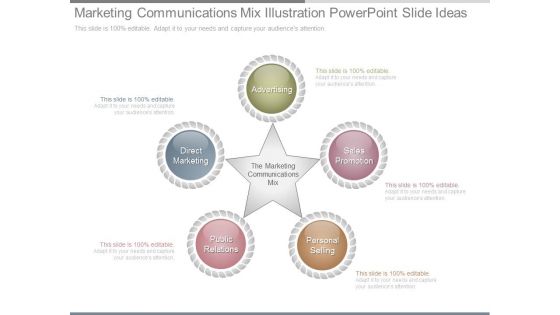
Marketing Communications Mix Illustration Powerpoint Slide Ideas
This is a marketing communications mix illustration powerpoint slide ideas. This is a five stage process. The stages in this process are advertising, sales promotion, personal selling, public relations, direct marketing, the marketing communications mix.
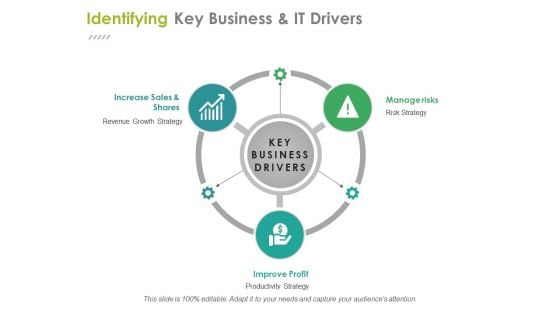
Identifying Key Business And It Drivers Ppt PowerPoint Presentation Ideas Files
This is a identifying key business and it drivers ppt powerpoint presentation ideas files. This is a three stage process. The stages in this process are increase sales and shares, improve profit, manage risks, business, management.

Financial Data Analysis Sample Diagram Presentation Slide
This is a financial data analysis sample diagram presentation slide. This is a four stage process. The stages in this process are finance, sales and marketing, operations, credit and risk.
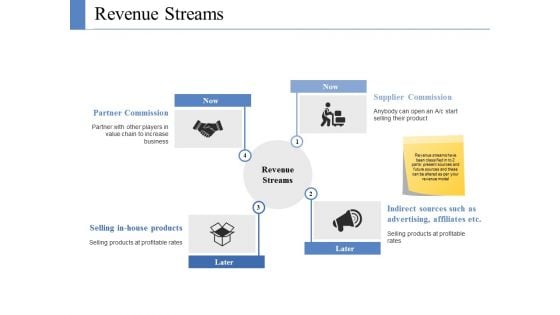
Revenue Streams Ppt PowerPoint Presentation Gallery Graphic Images
This is a revenue streams ppt powerpoint presentation gallery graphic images. This is a six stage process. The stages in this process are advertising, sales commission, subscription, affiliate, sponsored content.

Revenue Streams Ppt PowerPoint Presentation Infographic Template Graphics Template
This is a revenue streams ppt powerpoint presentation infographic template graphics template. This is a six stage process. The stages in this process are advertising, sales commission, subscription, affiliate, sponsored content.
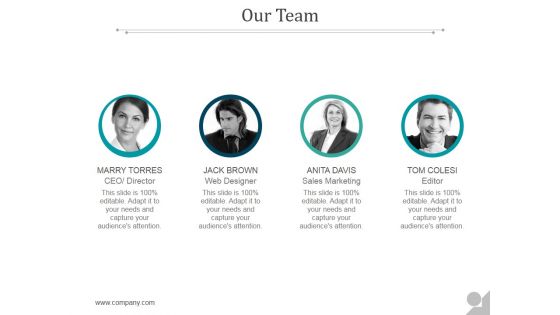
Our Team Ppt PowerPoint Presentation Slides
This is a our team ppt powerpoint presentation slides. This is a four stage process. The stages in this process are busindirector, web designer, sales marketing, editor.
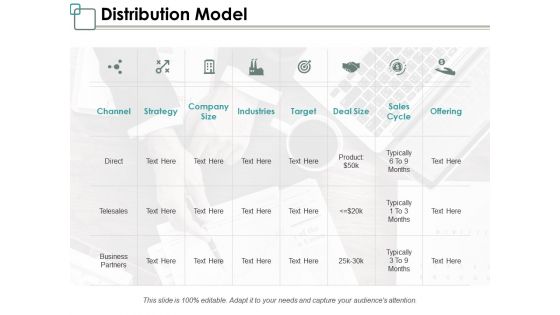
Distribution Model Ppt PowerPoint Presentation Ideas Model
This is a distribution model ppt powerpoint presentation ideas model. This is a eight stage process. The stages in this process are strategy, industries, target, sales cycle.
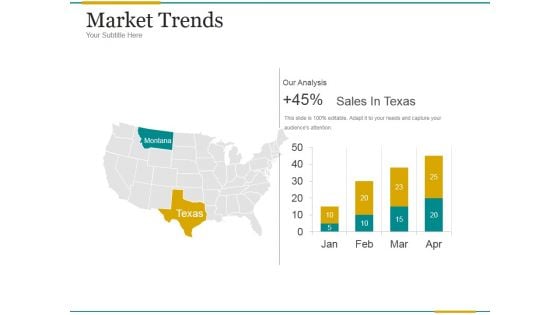
Market Trends Ppt PowerPoint Presentation Samples
This is a market trends ppt powerpoint presentation samples. This is a two stage process. The stages in this process are montana, our analysis, sales in texas.
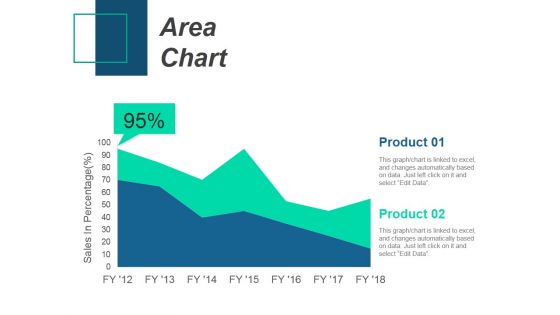
Area Chart Ppt PowerPoint Presentation Inspiration Images
This is a area chart ppt powerpoint presentation inspiration images. This is a two stage process. The stages in this process are area chart, product, sales in percentage.

Example Of Network Marketing Diagram Powerpoint Slide Information
This is a example of network marketing diagram powerpoint slide information. This is a four stage process. The stages in this process are ceo, president, manager, sales rep.
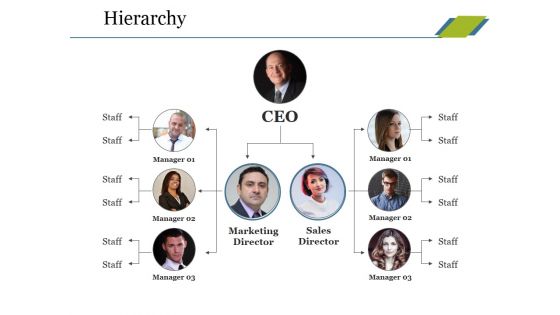
Hierarchy Ppt PowerPoint Presentation Inspiration Brochure
This is a hierarchy ppt powerpoint presentation inspiration brochure. This is a three stage process. The stages in this process are ceo, marketing director, sales director, manager, staff.

Corporate Development Teams Efforts Model Powerpoint Presentation
This is a corporate development teams efforts model powerpoint presentation. This is a seven stage process. The stages in this process are profit, direction, training, sales intelligence.
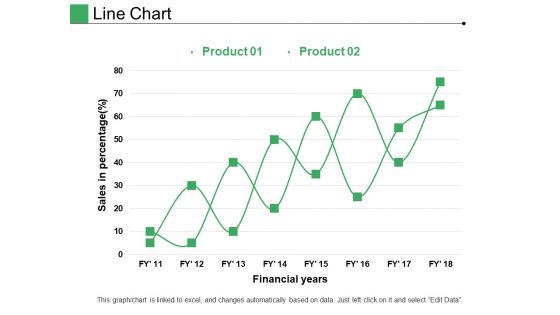
Line Chart Ppt PowerPoint Presentation Pictures Layout
This is a line chart ppt powerpoint presentation pictures layout. This is a two stage process. The stages in this process are product, financial years, sales in percentage.
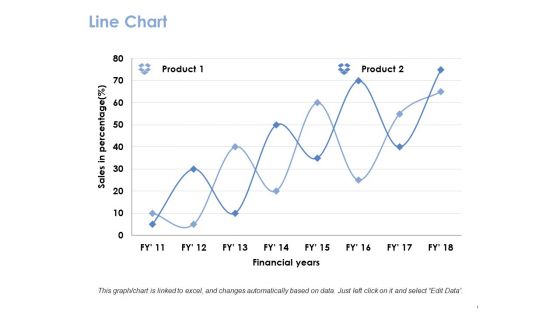
Line Chart Ppt PowerPoint Presentation Gallery Guide
This is a line chart ppt powerpoint presentation gallery guide. This is a two stage process. The stages in this process are product, financial years, sales in percentage.
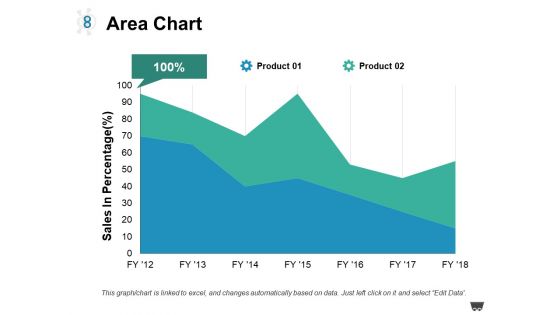
Area Chart Ppt PowerPoint Presentation Model Guidelines
This is a area chart ppt powerpoint presentation model guidelines. This is a two stage process. The stages in this process are product, area chart, sales in percentage.
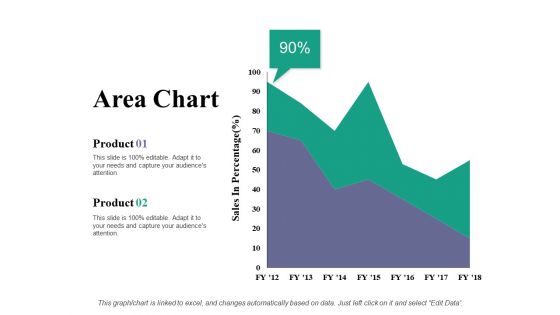
Area Chart Ppt PowerPoint Presentation Portfolio Examples
This is a area chart ppt powerpoint presentation portfolio examples. This is a two stage process. The stages in this process are product, area chart, sales in percentage.
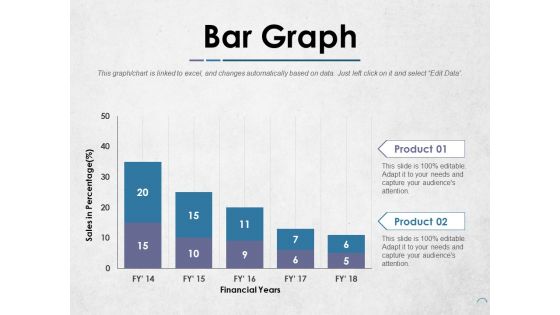
Bar Graph Ppt PowerPoint Presentation Infographics Templates
This is a bar graph ppt powerpoint presentation infographics templates. This is a two stage process. The stages in this process are product, financial years, sales in percentage.
Line Chart Ppt PowerPoint Presentation Icon Inspiration
This is a line chart ppt powerpoint presentation icon inspiration. This is a two stage process. The stages in this process are product, financial years, sales in percentage.


 Continue with Email

 Home
Home


