Snapshot
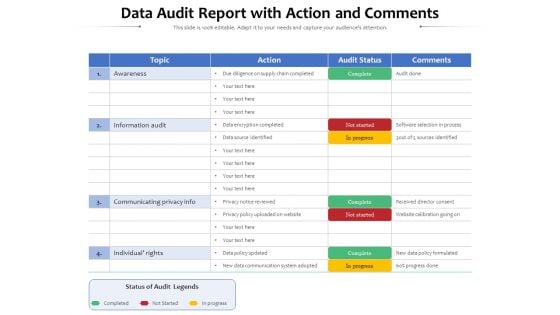
Data Audit Report With Action And Comments Ppt PowerPoint Presentation File Slide Portrait PDF
Pitch your topic with ease and precision using this data audit report with action and comments ppt powerpoint presentation file slide portrait pdf. This layout presents information on awareness, information audit, communicating privacy info, individual rights, topic, actions. It is also available for immediate download and adjustment. So, changes can be made in the color, design, graphics or any other component to create a unique layout.
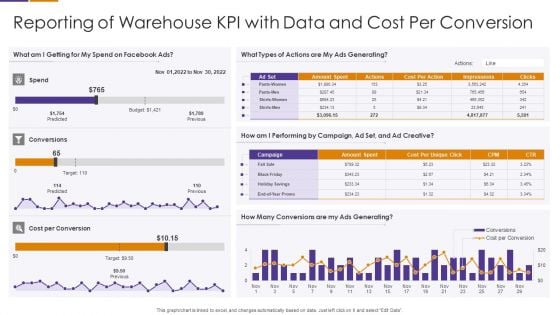
Reporting Of Warehouse KPI With Data And Cost Per Conversion Formats PDF
Pitch your topic with ease and precision using this Reporting Of Warehouse KPI With Data And Cost Per Conversion Formats PDF This layout presents information on Cost Per Conversion, Conversions Are My Ads Generating, Performing By Campaign It is also available for immediate download and adjustment. So, changes can be made in the color, design, graphics or any other component to create a unique layout.
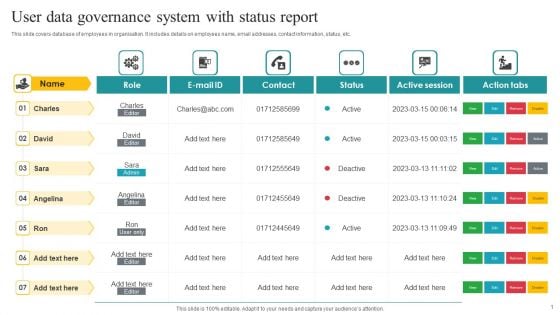
User Data Governance System With Status Report Ppt Gallery Slides PDF
This slide covers database of employees in organisation. It includes details on employees name, email addresses, contact information, status, etc. Showcasing this set of slides titled User Data Governance System With Status Report Ppt Gallery Slides PDF. The topics addressed in these templates are Role, Active Session, Action Tabs. All the content presented in this PPT design is completely editable. Download it and make adjustments in color, background, font etc. as per your unique business setting.
Cloud Based Email Security Market Report Issues Faced By Companies Data Ppt Icon Templates PDF
Various issues faced by the end user in E Mail marketing Industry are shown in this slide. Presenting cloud based email security market report issues faced by companies data ppt icon templates pdf to provide visual cues and insights. Share and navigate important information on six stages that need your due attention. This template can be used to pitch topics like security for confidential data, protection against malware, protection phishing scams, threat of weak password. In addtion, this PPT design contains high resolution images, graphics, etc, that are easily editable and available for immediate download.
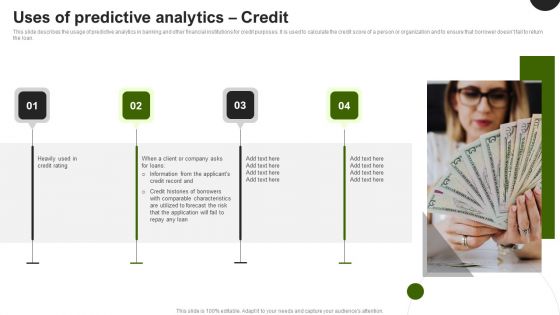
Predictive Analytics In The Age Of Big Data Uses Of Predictive Analytics Credit Ideas PDF
This slide describes the usage of predictive analytics in banking and other financial institutions for credit purposes. It is used to calculate the credit score of a person or organization and to ensure that borrower doesnot fail to return the loan. Present like a pro with Predictive Analytics In The Age Of Big Data Uses Of Predictive Analytics Credit Ideas PDF Create beautiful presentations together with your team, using our easy to use presentation slides. Share your ideas in real time and make changes on the fly by downloading our templates. So whether you are in the office, on the go, or in a remote location, you can stay in sync with your team and present your ideas with confidence. With Slidegeeks presentation got a whole lot easier. Grab these presentations today.

Telecom Cost Management Reporting Categories Mockup PDF
This slide shows telecom expense reporting that helps to compile and organize data. It includes three types of reporting portal, application programming interface API , key performance indictor reporting. Presenting Telecom Cost Management Reporting Categories Mockup PDF to dispense important information. This template comprises three stages. It also presents valuable insights into the topics including API Reporting, KPI Reporting, Portal Reporting. This is a completely customizable PowerPoint theme that can be put to use immediately. So, download it and address the topic impactfully.
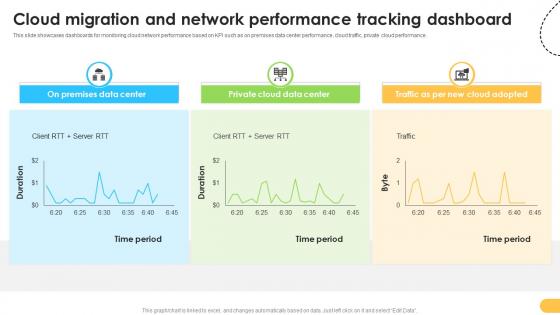
Cloud Migration And Network Performance Data Migration From On Premises
This slide showcases dashboards for monitoring cloud network performance based on KPI such as on premises data center performance, cloud traffic, private cloud performance. Present like a pro with Cloud Migration And Network Performance Data Migration From On Premises. Create beautiful presentations together with your team, using our easy-to-use presentation slides. Share your ideas in real-time and make changes on the fly by downloading our templates. So whether you are in the office, on the go, or in a remote location, you can stay in sync with your team and present your ideas with confidence. With Slidegeeks presentation got a whole lot easier. Grab these presentations today. This slide showcases dashboards for monitoring cloud network performance based on KPI such as on premises data center performance, cloud traffic, private cloud performance.
Effective Data Migration Cloud Migration And Network Performance Tracking
This slide showcases dashboards for monitoring cloud network performance based on KPI such as on premises data center performance, cloud traffic, private cloud performance. Present like a pro with Effective Data Migration Cloud Migration And Network Performance Tracking. Create beautiful presentations together with your team, using our easy-to-use presentation slides. Share your ideas in real-time and make changes on the fly by downloading our templates. So whether you are in the office, on the go, or in a remote location, you can stay in sync with your team and present your ideas with confidence. With Slidegeeks presentation got a whole lot easier. Grab these presentations today. This slide showcases dashboards for monitoring cloud network performance based on KPI such as on premises data center performance, cloud traffic, private cloud performance.
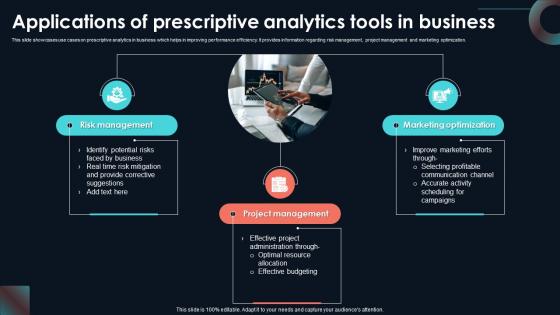
Applications Of Prescriptive Analytics Tools Developing Strategic Insights Using Big Data Analytics SS V
This slide showcases use cases on prescriptive analytics in business which helps in improving performance efficiency. It provides information regarding risk management, project management and marketing optimization. Do you have to make sure that everyone on your team knows about any specific topic I yes, then you should give Applications Of Prescriptive Analytics Tools Developing Strategic Insights Using Big Data Analytics SS V a try. Our experts have put a lot of knowledge and effort into creating this impeccable Applications Of Prescriptive Analytics Tools Developing Strategic Insights Using Big Data Analytics SS V. You can use this template for your upcoming presentations, as the slides are perfect to represent even the tiniest detail. You can download these templates from the Slidegeeks website and these are easy to edit. So grab these today This slide showcases use cases on prescriptive analytics in business which helps in improving performance efficiency. It provides information regarding risk management, project management and marketing optimization.

Step 6 Implement Analytic Strategies For Inventory Optimization Data Analytics SS V
This slide outlines analytics strategies aimed at helping businesses optimize inventory ad streamline operations. It covers replenishment optimization, prevent stockouts, speed order fulfilment, fast recalls and reduced costs This Step 6 Implement Analytic Strategies For Inventory Optimization Data Analytics SS V is perfect for any presentation, be it in front of clients or colleagues. It is a versatile and stylish solution for organizing your meetings. The Step 6 Implement Analytic Strategies For Inventory Optimization Data Analytics SS V features a modern design for your presentation meetings. The adjustable and customizable slides provide unlimited possibilities for acing up your presentation. Slidegeeks has done all the homework before launching the product for you. So, do not wait, grab the presentation templates today This slide outlines analytics strategies aimed at helping businesses optimize inventory ad streamline operations. It covers replenishment optimization, prevent stockouts, speed order fulfilment, fast recalls and reduced costs

B2B Digital Marketing Program With Key Metrics Ppt Slides Sample PDF
This slide represents the plan for b2b marketing. It includes details related to objectives, substantiation, strategies and tactics to achieve goals and key performance indicators. Pitch your topic with ease and precision using this B2B Digital Marketing Program With Key Metrics Ppt Slides Sample PDF. This layout presents information on Objectives, Substantiation, Achieve Goals. It is also available for immediate download and adjustment. So, changes can be made in the color, design, graphics or any other component to create a unique layout.

Data Analytics Management Why Big Data Management Is Important Elements PDF
This slide depicts the importance of big data and how collected data will help organizations in cost-saving, time savings, new product launching, and decision making.Presenting Data Analytics Management Why Big Data Management Is Important Elements PDF to provide visual cues and insights. Share and navigate important information on four stages that need your due attention. This template can be used to pitch topics like Analysis Collected, Business Models, Allowing Discover. In addtion, this PPT design contains high resolution images, graphics, etc, that are easily editable and available for immediate download.

Working Of AWS IoT Analytics To IoT Fleet Monitoring Ppt Sample IoT SS V
This slide provides an overview of the IoT analytics working to evaluate the amount of data collected. The architecture includes data collection, processing, storage, analysis and building. This Working Of AWS IoT Analytics To IoT Fleet Monitoring Ppt Sample IoT SS V is perfect for any presentation, be it in front of clients or colleagues. It is a versatile and stylish solution for organizing your meetings. The Working Of AWS IoT Analytics To IoT Fleet Monitoring Ppt Sample IoT SS V features a modern design for your presentation meetings. The adjustable and customizable slides provide unlimited possibilities for acing up your presentation. Slidegeeks has done all the homework before launching the product for you. So, do not wait, grab the presentation templates today This slide provides an overview of the IoT analytics working to evaluate the amount of data collected. The architecture includes data collection, processing, storage, analysis and building.
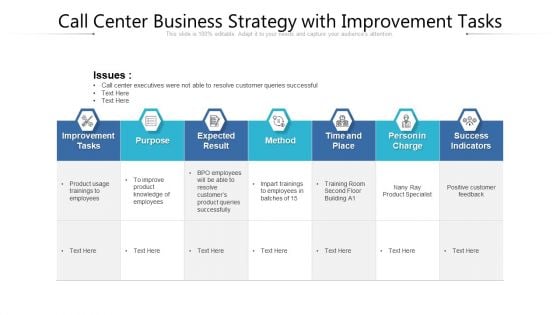
Call Center Business Strategy With Improvement Tasks Ppt PowerPoint Presentation Show Graphic Images PDF
Pitch your topic with ease and precision using thiscall center business strategy with improvement tasks ppt powerpoint presentation show graphic images pdf. This layout presents information on product usage trainings to employees, improvement tasks, nany ray product specialist. It is also available for immediate download and adjustment. So, changes can be made in the color, design, graphics or any other component to create a unique layout.
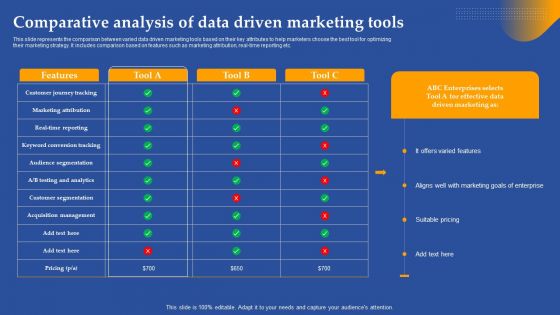
Comparative Analysis Of Data Driven Marketing Tools Ppt Summary Slide Download PDF
This slide represents the comparison between varied data driven marketing tools based on their key attributes to help marketers choose the best tool for optimizing their marketing strategy. It includes comparison based on features such as marketing attribution, real-time reporting etc. Make sure to capture your audiences attention in your business displays with our gratis customizable Comparative Analysis Of Data Driven Marketing Tools Ppt Summary Slide Download PDF. These are great for business strategies, office conferences, capital raising or task suggestions. If you desire to acquire more customers for your tech business and ensure they stay satisfied, create your own sales presentation with these plain slides.
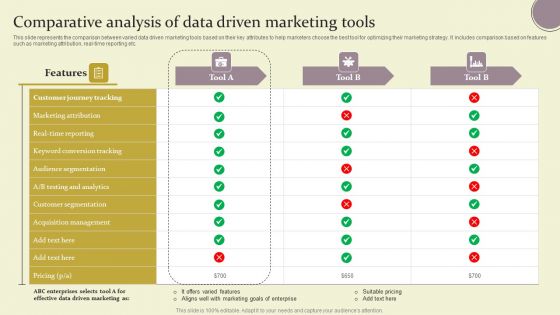
Comparative Analysis Of Data Driven Marketing Tools Ppt Gallery Guidelines PDF
This slide represents the comparison between varied data driven marketing tools based on their key attributes to help marketers choose the best tool for optimizing their marketing strategy. It includes comparison based on features such as marketing attribution, real-time reporting etc. Make sure to capture your audiences attention in your business displays with our gratis customizable Comparative Analysis Of Data Driven Marketing Tools Ppt Gallery Guidelines PDF. These are great for business strategies, office conferences, capital raising or task suggestions. If you desire to acquire more customers for your tech business and ensure they stay satisfied, create your own sales presentation with these plain slides.
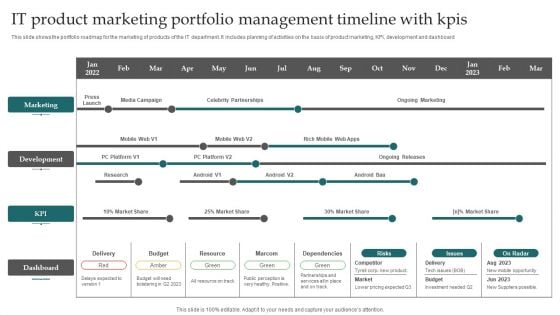
IT Product Marketing Portfolio Management Timeline With Kpis Elements PDF
This slide shows the portfolio roadmap for the marketing of products of the IT department. It includes planning of activities on the basis of product marketing, KPI, development and dashboard. Showcasing this set of slides titled IT Product Marketing Portfolio Management Timeline With Kpis Elements PDF. The topics addressed in these templates are Marketing, Development, Budget. All the content presented in this PPT design is completely editable. Download it and make adjustments in color, background, font etc. as per your unique business setting.
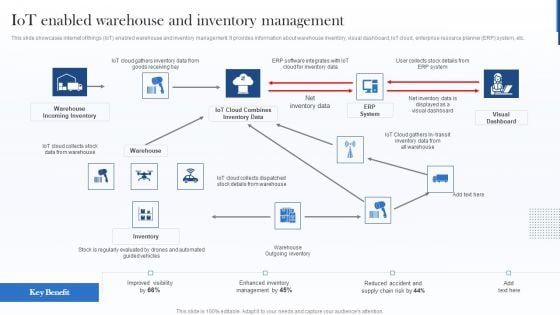
Iot Enabled Warehouse And Inventory Management Demonstration PDF
This slide showcases internet of things IoT enabled warehouse and inventory management. It provides information about warehouse inventory, visual dashboard, IoT cloud, enterprise resource planner ERP system, etc. Deliver and pitch your topic in the best possible manner with this Iot Enabled Warehouse And Inventory Management Demonstration PDF. Use them to share invaluable insights on Warehouse, Inventory Data, Dashboard and impress your audience. This template can be altered and modified as per your expectations. So, grab it now.
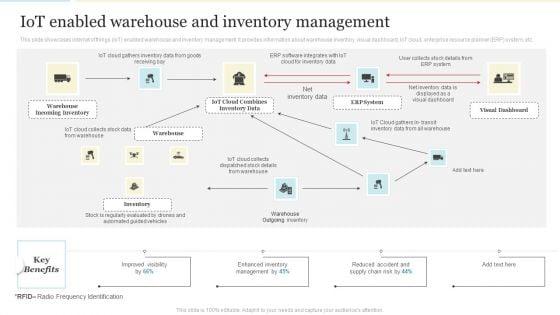
Iot Enabled Warehouse And Inventory Management Sample PDF
This slide showcases internet of things IoT enabled warehouse and inventory management. It provides information about warehouse inventory, visual dashboard, IoT cloud, enterprise resource planner ERP system, etc. Deliver an awe inspiring pitch with this creative Iot Enabled Warehouse And Inventory Management Sample PDF bundle. Topics like Inventory Data, Warehouse, Dashboard can be discussed with this completely editable template. It is available for immediate download depending on the needs and requirements of the user.
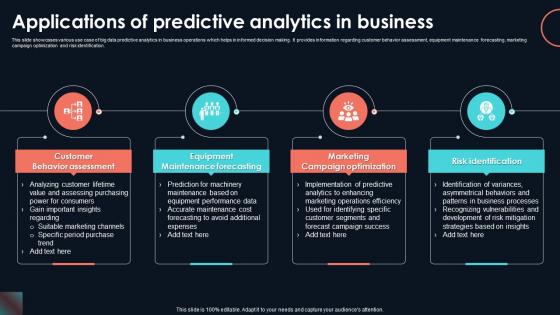
Applications Of Predictive Analytics In Developing Strategic Insights Using Big Data Analytics SS V
This slide showcases various use case of big data predictive analytics in business operations which helps in informed decision making. It provides information regarding customer behavior assessment, equipment maintenance forecasting, marketing campaign optimization and risk identification. There are so many reasons you need a Applications Of Predictive Analytics In Developing Strategic Insights Using Big Data Analytics SS V. The first reason is you can not spend time making everything from scratch, Thus, Slidegeeks has made presentation templates for you too. You can easily download these templates from our website easily. This slide showcases various use case of big data predictive analytics in business operations which helps in informed decision making. It provides information regarding customer behavior assessment, equipment maintenance forecasting, marketing campaign optimization and risk identification.
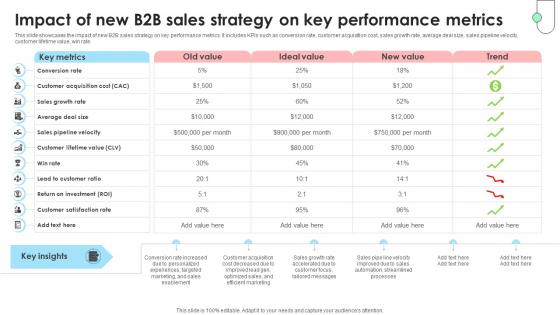
Navigating B2B Sales Impact Of New B2B Sales Strategy On Key SA SS V
This slide showcases the impact of new B2B sales strategy on key performance metrics. It includes KPIs such as conversion rate, customer acquisition cost, sales growth rate, average deal size, sales pipeline velocity, customer lifetime value, win rate. Do you know about Slidesgeeks Navigating B2B Sales Impact Of New B2B Sales Strategy On Key SA SS V These are perfect for delivering any kind od presentation. Using it, create PowerPoint presentations that communicate your ideas and engage audiences. Save time and effort by using our pre-designed presentation templates that are perfect for a wide range of topic. Our vast selection of designs covers a range of styles, from creative to business, and are all highly customizable and easy to edit. Download as a PowerPoint template or use them as Google Slides themes. This slide showcases the impact of new B2B sales strategy on key performance metrics. It includes KPIs such as conversion rate, customer acquisition cost, sales growth rate, average deal size, sales pipeline velocity, customer lifetime value, win rate.
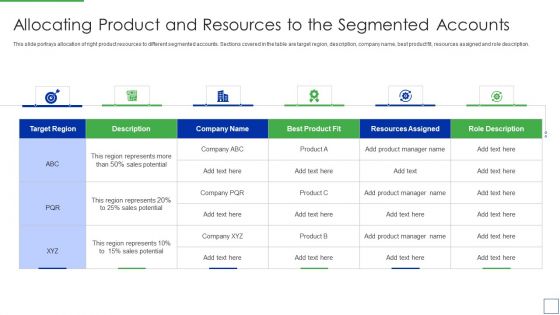
Product Portfolio Management For New Target Region Allocating Product And Resources Brochure PDF
This slide shows the dashboard related to project such as tasks, performance metrics and many more.Deliver an awe inspiring pitch with this creative Efficient Ways For Successful Project Administration Project And Tasks Implementation Dashboard Infographics PDF bundle. Topics like Project And Tasks Implementation Dashboard can be discussed with this completely editable template. It is available for immediate download depending on the needs and requirements of the user.
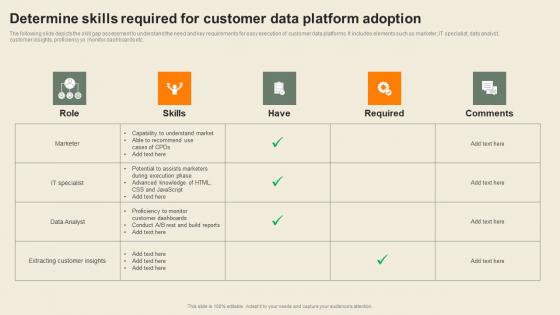
Determine Skills Required For Customer Data Usability Of CDP Software Tool Clipart Pdf
The following slide depicts the skill gap assessment to understand the need and key requirements for easy execution of customer data platforms. It includes elements such as marketer, IT specialist, data analyst, customer insights, proficiency yo monitor dashboards etc. Explore a selection of the finest Determine Skills Required For Customer Data Usability Of CDP Software Tool Clipart Pdf here. With a plethora of professionally designed and pre-made slide templates, you can quickly and easily find the right one for your upcoming presentation. You can use our Determine Skills Required For Customer Data Usability Of CDP Software Tool Clipart Pdf to effectively convey your message to a wider audience. Slidegeeks has done a lot of research before preparing these presentation templates. The content can be personalized and the slides are highly editable. Grab templates today from Slidegeeks. The following slide depicts the skill gap assessment to understand the need and key requirements for easy execution of customer data platforms. It includes elements such as marketer, IT specialist, data analyst, customer insights, proficiency yo monitor dashboards etc.
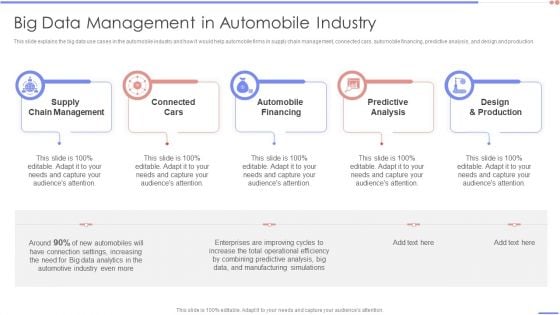
Data Analytics Management Big Data Management In Automobile Industry Template PDF
This slide explains the big data use cases in the automobile industry and how it would help automobile firms in supply chain management, connected cars, automobile financing, predictive analysis, and design and production.This is a Data Analytics Management Big Data Management In Automobile Industry Template PDF template with various stages. Focus and dispense information on five stages using this creative set, that comes with editable features. It contains large content boxes to add your information on topics like Chain Management, Connected Cars, Automobile Financing. You can also showcase facts, figures, and other relevant content using this PPT layout. Grab it now.
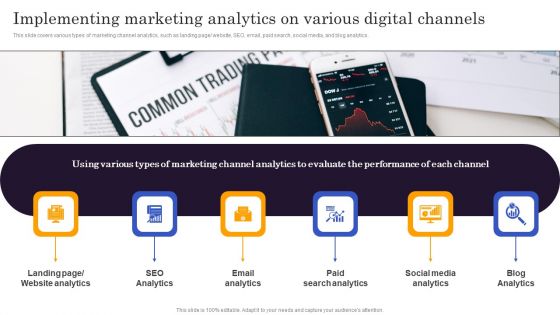
Marketers Guide To Data Analysis Optimization Implementing Marketing Analytics On Various Digital Channels Template PDF
This slide covers various types of marketing channel analytics, such as landing page website, SEO, email, paid search, social media, and blog analytics. This modern and well arranged Marketers Guide To Data Analysis Optimization Implementing Marketing Analytics On Various Digital Channels Template PDF provides lots of creative possibilities. It is very simple to customize and edit with the Powerpoint Software. Just drag and drop your pictures into the shapes. All facets of this template can be edited with Powerpoint no extra software is necessary. Add your own material, put your images in the places assigned for them, adjust the colors, and then you can show your slides to the world, with an animated slide included.
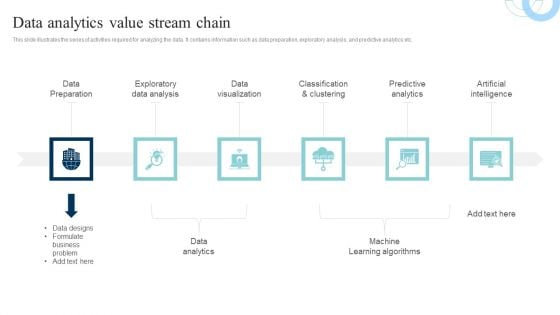
Data Evaluation And Processing Toolkit Data Analytics Value Stream Chain Microsoft PDF
This slide illustrates the series of activities required for analyzing the data. It contains information such as data preparation, exploratory analysis, and predictive analytics etc. Formulating a presentation can take up a lot of effort and time, so the content and message should always be the primary focus. The visuals of the PowerPoint can enhance the presenters message, so our Data Evaluation And Processing Toolkit Data Analytics Value Stream Chain Microsoft PDF was created to help save time. Instead of worrying about the design, the presenter can concentrate on the message while our designers work on creating the ideal templates for whatever situation is needed. Slidegeeks has experts for everything from amazing designs to valuable content, we have put everything into Data Evaluation And Processing Toolkit Data Analytics Value Stream Chain Microsoft PDF.
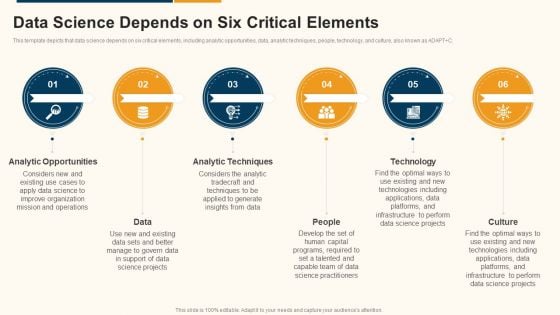
Data Interpretation And Analysis Playbook Data Science Depends On Six Critical Elements Diagrams PDF
This template depicts that data science depends on six critical elements, including analytic opportunities, data, analytic techniques, people, technology, and culture, also known as ADAPT pluse C. Presenting data interpretation and analysis playbook data science depends on six critical elements diagrams pdf to provide visual cues and insights. Share and navigate important information on six stages that need your due attention. This template can be used to pitch topics like analytic opportunities, data, analytic techniques, people, technology, culture. In addtion, this PPT design contains high resolution images, graphics, etc, that are easily editable and available for immediate download.

NPS Reports And Dashboard Ppt PowerPoint Presentation Complete Deck With Slides
This complete presentation has PPT slides on wide range of topics highlighting the core areas of your business needs. It has professionally designed templates with relevant visuals and subject driven content. This presentation deck has total of sixteen slides. Get access to the customizable templates. Our designers have created editable templates for your convenience. You can edit the colour, text and font size as per your need. You can add or delete the content if required. You are just a click to away to have this ready made presentation. Click the download button now.

Overview Of Descriptive Analytics In Developing Strategic Insights Using Big Data Analytics SS V
This slide provides introduction of descriptive analytics used in business for analyzing performance efficiency. It includes elements such as decision making, sales performance, growth opportunities, valuable insights etc. Formulating a presentation can take up a lot of effort and time, so the content and message should always be the primary focus. The visuals of the PowerPoint can enhance the presenters message, so our Overview Of Descriptive Analytics In Developing Strategic Insights Using Big Data Analytics SS V was created to help save time. Instead of worrying about the design, the presenter can concentrate on the message while our designers work on creating the ideal templates for whatever situation is needed. Slidegeeks has experts for everything from amazing designs to valuable content, we have put everything into Overview Of Descriptive Analytics In Developing Strategic Insights Using Big Data Analytics SS V This slide provides introduction of descriptive analytics used in business for analyzing performance efficiency. It includes elements such as decision making, sales performance, growth opportunities, valuable insights etc.
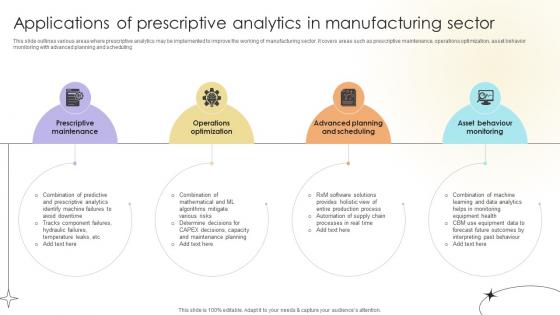
Applications Of Prescriptive Analytics In Manufacturing Sector Data Analytics SS V
This slide outlines various areas where prescriptive analytics may be implemented to improve the working of manufacturing sector. It covers areas such as prescriptive maintenance, operations optimization, asset behavior monitoring with advanced planning and scheduling.Do you have an important presentation coming up Are you looking for something that will make your presentation stand out from the rest Look no further than Applications Of Prescriptive Analytics In Manufacturing Sector Data Analytics SS V. With our professional designs, you can trust that your presentation will pop and make delivering it a smooth process. And with Slidegeeks, you can trust that your presentation will be unique and memorable. So why wait Grab Applications Of Prescriptive Analytics In Manufacturing Sector Data Analytics SS V today and make your presentation stand out from the rest This slide outlines various areas where prescriptive analytics may be implemented to improve the working of manufacturing sector. It covers areas such as prescriptive maintenance, operations optimization, asset behavior monitoring with advanced planning and scheduling.
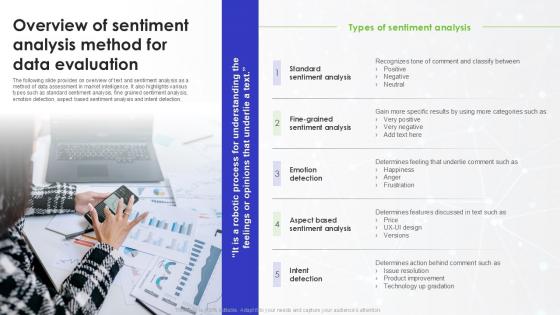
Overview Of Sentiment Analysis Method For Data Evaluation
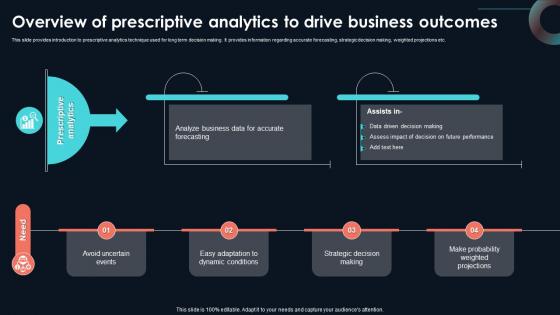
Overview Of Prescriptive Analytics To Drive Developing Strategic Insights Using Big Data Analytics SS V
This slide provides introduction to prescriptive analytics technique used for long term decision making. It provides information regarding accurate forecasting, strategic decision making, weighted projections etc. Coming up with a presentation necessitates that the majority of the effort goes into the content and the message you intend to convey. The visuals of a PowerPoint presentation can only be effective if it supplements and supports the story that is being told. Keeping this in mind our experts created Overview Of Prescriptive Analytics To Drive Developing Strategic Insights Using Big Data Analytics SS V to reduce the time that goes into designing the presentation. This way, you can concentrate on the message while our designers take care of providing you with the right template for the situation. This slide provides introduction to prescriptive analytics technique used for long term decision making. It provides information regarding accurate forecasting, strategic decision making, weighted projections etc.
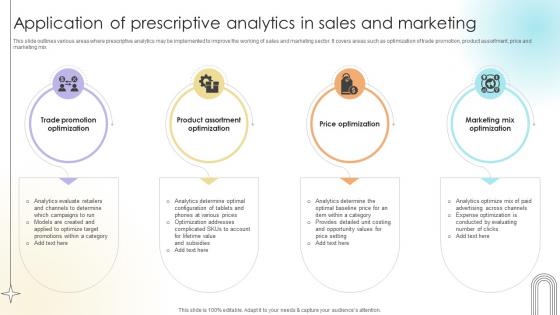
Application Of Prescriptive Analytics In Sales And Marketing Data Analytics SS V
This slide outlines various areas where prescriptive analytics may be implemented to improve the working of sales and marketing sector. It covers areas such as optimization of trade promotion, product assortment, price and marketing mix.Want to ace your presentation in front of a live audience Our Application Of Prescriptive Analytics In Sales And Marketing Data Analytics SS V can help you do that by engaging all the users towards you. Slidegeeks experts have put their efforts and expertise into creating these impeccable powerpoint presentations so that you can communicate your ideas clearly. Moreover, all the templates are customizable, and easy-to-edit and downloadable. Use these for both personal and commercial use. This slide outlines various areas where prescriptive analytics may be implemented to improve the working of sales and marketing sector. It covers areas such as optimization of trade promotion, product assortment, price and marketing mix.

Benefits Of Implementing Artificial Intelligence In Analytics Data Analytics SS V
This slide outlines key advantages of leveraging artificial intelligence in analytics aimed at helping businesses objectively predict results of the actions before implementation in real world . It covers the benefits such as enhanced speed, better predictive capabilities, improved customer experience and reduced costs.Make sure to capture your audiences attention in your business displays with our gratis customizable Benefits Of Implementing Artificial Intelligence In Analytics Data Analytics SS V. These are great for business strategies, office conferences, capital raising or task suggestions. If you desire to acquire more customers for your tech business and ensure they stay satisfied, create your own sales presentation with these plain slides. This slide outlines key advantages of leveraging artificial intelligence in analytics aimed at helping businesses objectively predict results of the actions before implementation in real world . It covers the benefits such as enhanced speed, better predictive capabilities, improved customer experience and reduced costs.
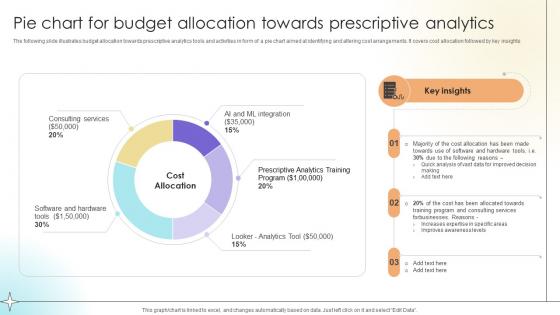
Pie Chart For Budget Allocation Towards Prescriptive Analytics Data Analytics SS V
The following slide illustrates budget allocation towards prescriptive analytics tools and activities in form of a pie chart aimed at identifying and altering cost arrangements. It covers cost allocation followed by key insights.Coming up with a presentation necessitates that the majority of the effort goes into the content and the message you intend to convey. The visuals of a PowerPoint presentation can only be effective if it supplements and supports the story that is being told. Keeping this in mind our experts created Pie Chart For Budget Allocation Towards Prescriptive Analytics Data Analytics SS V to reduce the time that goes into designing the presentation. This way, you can concentrate on the message while our designers take care of providing you with the right template for the situation. The following slide illustrates budget allocation towards prescriptive analytics tools and activities in form of a pie chart aimed at identifying and altering cost arrangements. It covers cost allocation followed by key insights.
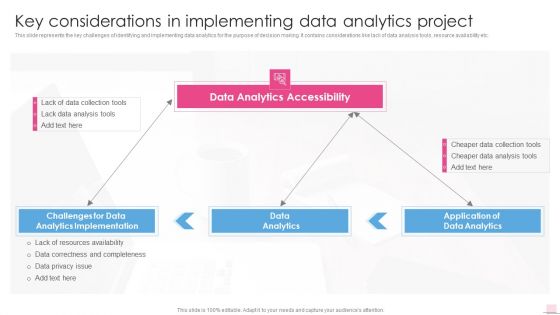
Key Considerations In Implementing Data Analytics Business Analysis Modification Toolkit Brochure PDF
This slide represents the key challenges of identifying and implementing data analytics for the purpose of decision making. It contains considerations like lack of data analysis tools, resource availability etc.Deliver an awe inspiring pitch with this creative Key Considerations In Implementing Data Analytics Business Analysis Modification Toolkit Brochure PDF bundle. Topics like Analytics Implementation, Data Analytics, Analytics Accessibility can be discussed with this completely editable template. It is available for immediate download depending on the needs and requirements of the user.
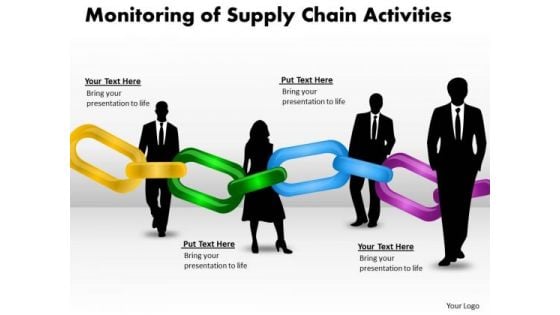
Sales Diagram Monitoring Of Supply Chain Activities Business Diagram
Be The Doer With Our Sales Diagram Monitoring Of Supply Chain Activities Business Diagram Powerpoint Templates. Put Your Thoughts Into Practice.
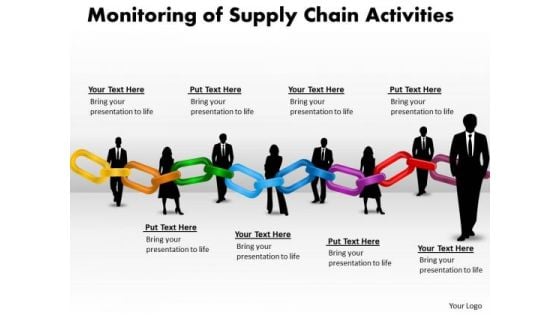
Consulting Diagram Monitoring Of Supply Chain Activities Business Cycle Diagram
Be The Doer With Our Consulting Diagram Monitoring Of Supply Chain Activities Business Cycle Diagram Powerpoint Templates. Put Your Thoughts Into Practice.
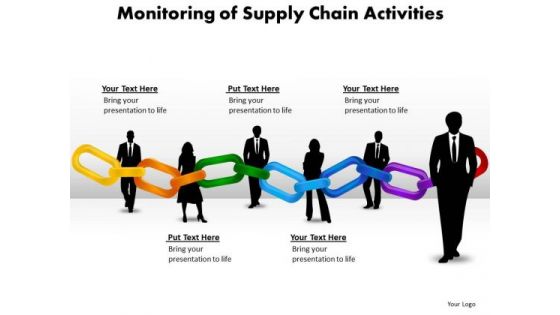
Consulting Diagram Monitoring Of Supply Chain Activities Business Framework Model
Our Consulting Diagram Monitoring Of Supply Chain Activities Business Framework Model Powerpoint Templates Heighten Concentration. Your Audience Will Be On The Edge.
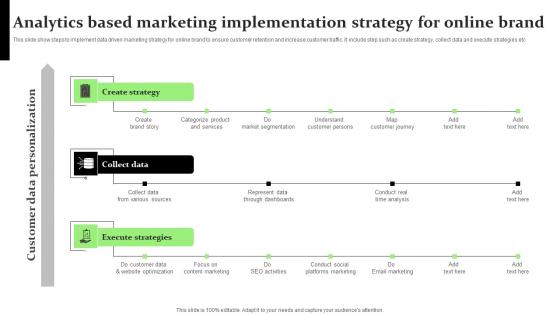
Analytics Based Marketing Implementation Strategy For Online Brand Topics Pdf
This slide show steps to implement data driven marketing strategy for online brand to ensure customer retention and increase customer traffic. It include step such as create strategy, collect data and execute strategies etc.Pitch your topic with ease and precision using this Analytics Based Marketing Implementation Strategy For Online Brand Topics Pdf This layout presents information on Market Segmentation, Understand Customer Persons, Map Customer Journey It is also available for immediate download and adjustment. So, changes can be made in the color, design, graphics or any other component to create a unique layout. This slide show steps to implement data driven marketing strategy for online brand to ensure customer retention and increase customer traffic. It include step such as create strategy, collect data and execute strategies etc.
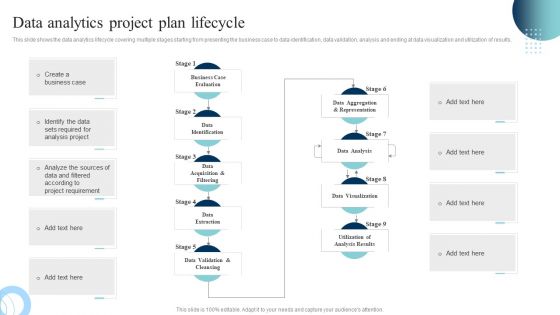
Data Evaluation And Processing Toolkit Data Analytics Project Plan Lifecycle Background PDF
This slide shows the data analytics lifecycle covering multiple stages starting from presenting the business case to data identification, data validation, analysis and ending at data visualization and utilization of results. Are you in need of a template that can accommodate all of your creative concepts This one is crafted professionally and can be altered to fit any style. Use it with Google Slides or PowerPoint. Include striking photographs, symbols, depictions, and other visuals. Fill, move around, or remove text boxes as desired. Test out color palettes and font mixtures. Edit and save your work, or work with colleagues. Download Data Evaluation And Processing Toolkit Data Analytics Project Plan Lifecycle Background PDF and observe how to make your presentation outstanding. Give an impeccable presentation to your group and make your presentation unforgettable.
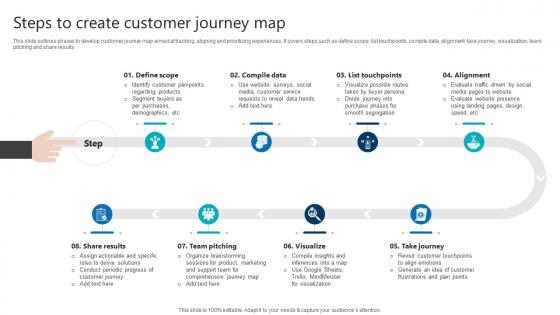
Steps To Create Customer Journey Map Product Analytics Implementation Data Analytics V
This slide outlines phases to develop customer journey map aimed at tracking, aligning and prioritizing experiences. It covers steps such as define scope, list touchpoints, compile data, alignment, take journey, visualization, team pitching and share results Welcome to our selection of the Steps To Create Customer Journey Map Product Analytics Implementation Data Analytics V. These are designed to help you showcase your creativity and bring your sphere to life. Planning and Innovation are essential for any business that is just starting out. This collection contains the designs that you need for your everyday presentations. All of our PowerPoints are 100 percent editable, so you can customize them to suit your needs. This multi-purpose template can be used in various situations. Grab these presentation templates today. This slide outlines phases to develop customer journey map aimed at tracking, aligning and prioritizing experiences. It covers steps such as define scope, list touchpoints, compile data, alignment, take journey, visualization, team pitching and share results
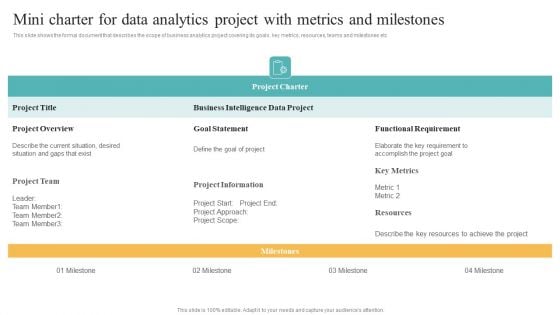
Mini Charter For Data Analytics Project With Metrics And Milestones Brochure PDF
This slide shows the formal document that describes the scope of business analytics project covering its goals, key metrics, resources, teams and milestones etc Find a pre designed and impeccable Mini Charter For Data Analytics Project With Metrics And Milestones Brochure PDF. The templates can ace your presentation without additional effort. You can download these easy to edit presentation templates to make your presentation stand out from others. So, what are you waiting for Download the template from Slidegeeks today and give a unique touch to your presentation.
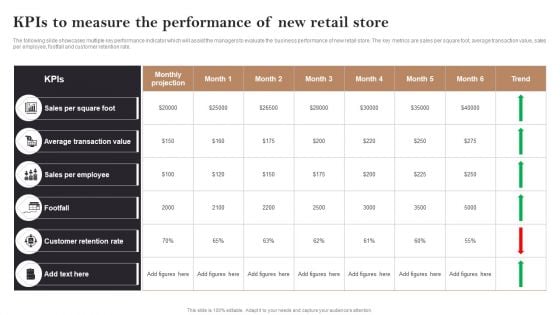
Kpis To Measure The Performance Of New Retail Store Opening Retail Store In Untapped Ideas PDF
The following slide showcases multiple key performance indicator which will assist the managers to evaluate the business performance of new retail store. The key metrics are sales per square foot, average transaction value, sales per employee, footfall and customer retention rate. Want to ace your presentation in front of a live audience Our Kpis To Measure The Performance Of New Retail Store Opening Retail Store In Untapped Ideas PDF can help you do that by engaging all the users towards you.. Slidegeeks experts have put their efforts and expertise into creating these impeccable powerpoint presentations so that you can communicate your ideas clearly. Moreover, all the templates are customizable, and easy-to-edit and downloadable. Use these for both personal and commercial use.

Step 8 Event Management Performance Evaluation Metrics Inspiration PDF
This slide showcases the key metrics that are tracked to measure event success. The indicators covered are registration trends, post survey responses, cost per attendee, NPS and conversion rate. There are so many reasons you need a Step 8 Event Management Performance Evaluation Metrics Inspiration PDF. The first reason is you can not spend time making everything from scratch, Thus, Slidegeeks has made presentation templates for you too. You can easily download these templates from our website easily.
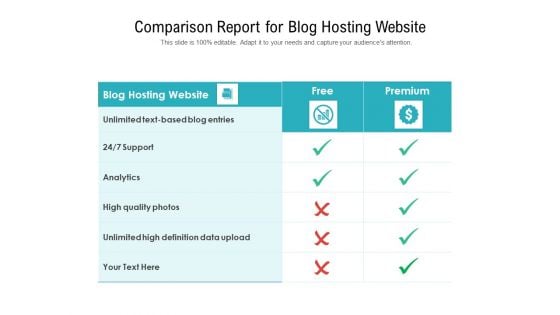
Comparison Report For Blog Hosting Website Ppt PowerPoint Presentation Inspiration Slideshow PDF
Pitch your topic with ease and precision using this comparison report for blog hosting website ppt powerpoint presentation inspiration slideshow pdf. This layout presents information on blog hosting website, premium, analytics, high quality photos, unlimited high definition data upload. It is also available for immediate download and adjustment. So, changes can be made in the color, design, graphics or any other component to create a unique layout.
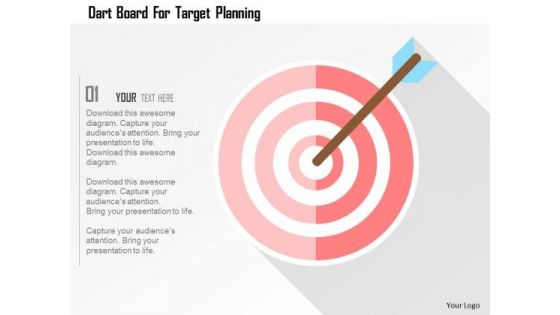
Business Diagram Dart Board For Target Planning Presentation Template
The above template displays a diagram of arrow on target board. This diagram has been professionally designed to emphasize on concept of success and strategy. Grab center stage with this slide. Capture the attention of your audience.
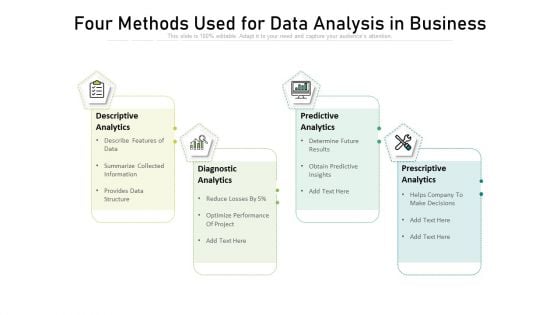
Four Methods Used For Data Analysis In Business Portrait PDF
Persuade your audience using this four methods used for data analysis in business portrait pdf.This PPT design covers four stages, thus making it a great tool to use. It also caters to a variety of topics including descriptive analytics, diagnostic analytics, predictive analytics, prescriptive analytics. Download this PPT design now to present a convincing pitch that not only emphasizes the topic but also showcases your presentation skills.
Net Promoter Score Dashboard Ppt PowerPoint Presentation Complete Deck With Slides
This complete deck acts as a great communication tool. It helps you in conveying your business message with personalized sets of graphics, icons etc. Comprising a set of ninteen slides, this complete deck can help you persuade your audience. It also induces strategic thinking as it has been thoroughly researched and put together by our experts. Not only is it easily downloadable but also editable. The color, graphics, theme any component can be altered to fit your individual needs. So grab it now.

Customer Relationship Management Dashboard Ppt PowerPoint Presentation Complete Deck With Slides
This complete deck acts as a great communication tool. It helps you in conveying your business message with personalized sets of graphics, icons etc. Comprising a set of fourtynine slides, this complete deck can help you persuade your audience. It also induces strategic thinking as it has been thoroughly researched and put together by our experts. Not only is it easily downloadable but also editable. The color, graphics, theme any component can be altered to fit your individual needs. So grab it now.
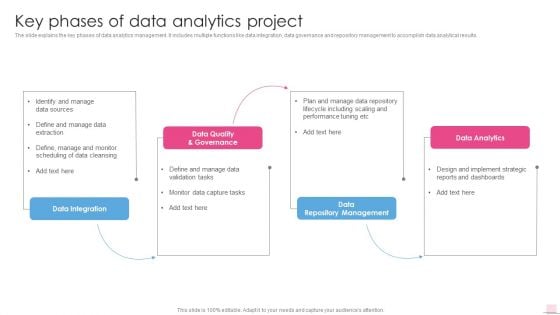
Key Phases Of Data Analytics Project Business Analysis Modification Toolkit Diagrams PDF
The slide explains the key phases of data analytics management. It includes multiple functions like data integration, data governance and repository management to accomplish data analytical results.Deliver and pitch your topic in the best possible manner with this Key Phases Of Data Analytics Project Business Analysis Modification Toolkit Diagrams PDF. Use them to share invaluable insights on Data Quality Governance, Performance Tuning, Including Scaling and impress your audience. This template can be altered and modified as per your expectations. So, grab it now.
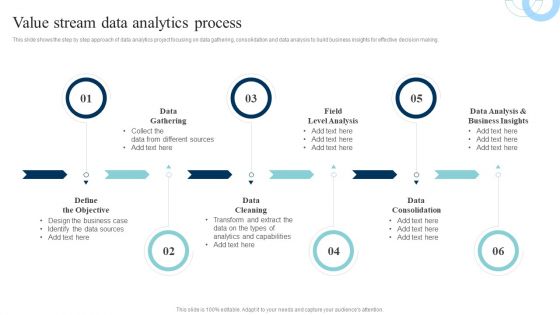
Data Evaluation And Processing Toolkit Value Stream Data Analytics Process Demonstration PDF
This slide shows the step by step approach of data analytics project focusing on data gathering, consolidation and data analysis to build business insights for effective decision making. Coming up with a presentation necessitates that the majority of the effort goes into the content and the message you intend to convey. The visuals of a PowerPoint presentation can only be effective if it supplements and supports the story that is being told. Keeping this in mind our experts created Data Evaluation And Processing Toolkit Value Stream Data Analytics Process Demonstration PDF to reduce the time that goes into designing the presentation. This way, you can concentrate on the message while our designers take care of providing you with the right template for the situation.
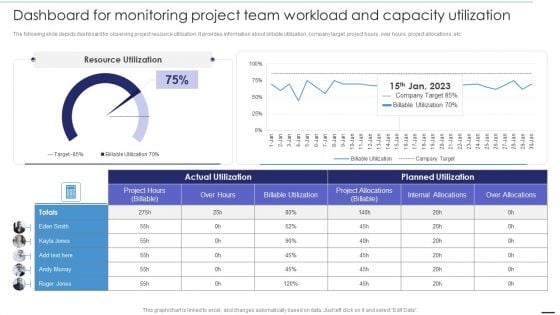
Deploying Cloud Technology Dashboard For Monitoring Project Team Workload And Capacity Utilization Ppt Show Background Designs PDF
The following slide depicts dashboard for observing project resource utilization. It provides information about billable utilization, company target, project hours, over hours, project allocations, etc. Slidegeeks is here to make your presentations a breeze with Deploying Cloud Technology Dashboard For Monitoring Project Team Workload And Capacity Utilization Ppt Show Background Designs PDF With our easy-to-use and customizable templates, you can focus on delivering your ideas rather than worrying about formatting. With a variety of designs to choose from, you are sure to find one that suits your needs. And with animations and unique photos, illustrations, and fonts, you can make your presentation pop. So whether you are giving a sales pitch or presenting to the board, make sure to check out Slidegeeks first.
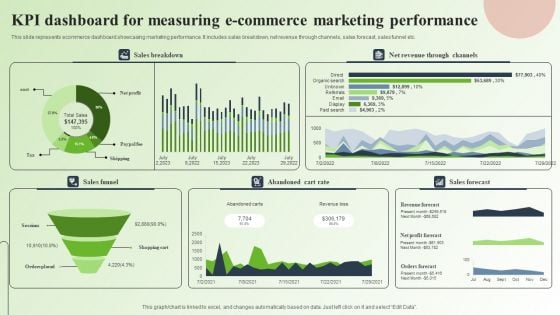
Strategic Guide For Mastering E Commerce Marketing Kpi Dashboard For Measuring E Commerce Marketing Performance Infographics PDF
This slide represents ecommerce dashboard showcasing marketing performance. It includes sales breakdown, net revenue through channels, sales forecast, sales funnel etc. Slidegeeks is here to make your presentations a breeze with Strategic Guide For Mastering E Commerce Marketing Kpi Dashboard For Measuring E Commerce Marketing Performance Infographics PDF With our easy to use and customizable templates, you can focus on delivering your ideas rather than worrying about formatting. With a variety of designs to choose from, you are sure to find one that suits your needs. And with animations and unique photos, illustrations, and fonts, you can make your presentation pop. So whether you are giving a sales pitch or presenting to the board, make sure to check out Slidegeeks first.
Acquiring Clients Through Search Engine And Native Ads Dashboard To Track Website Traffic During Performance Icons PDF
This slide showcases dashboard that can help marketers to track the website traffic during execution of performance marketing activities. Its key elements are organic sessions, organic page views, inorganic sessions by month etc. Slidegeeks is here to make your presentations a breeze with Acquiring Clients Through Search Engine And Native Ads Dashboard To Track Website Traffic During Performance Icons PDF With our easy to use and customizable templates, you can focus on delivering your ideas rather than worrying about formatting. With a variety of designs to choose from, you are sure to find one that suits your needs. And with animations and unique photos, illustrations, and fonts, you can make your presentation pop. So whether you are giving a sales pitch or presenting to the board, make sure to check out Slidegeeks first.
KPI Dashboards Per Industry Ppt PowerPoint Presentation Complete Deck With Slides
This complete deck acts as a great communication tool. It helps you in conveying your business message with personalized sets of graphics, icons etc. Comprising a set of twenty seven slides, this complete deck can help you persuade your audience. It also induces strategic thinking as it has been thoroughly researched and put together by our experts. Not only is it easily downloadable but also editable. The color, graphics, theme any component can be altered to fit your individual needs. So grab it now.
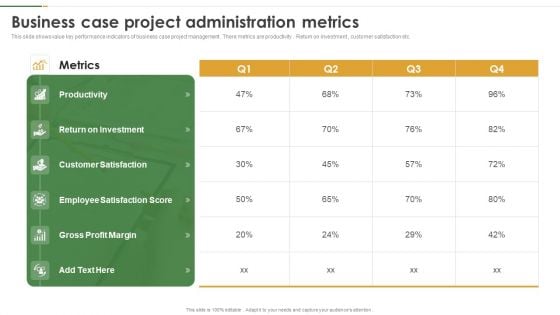
Business Case Project Administration Metrics Template PDF
This slide shows value key performance indicators of business case project management . There metrics are productivity . Return on investment , customer satisfaction etc. Showcasing this set of slides titled Business Case Project Administration Metrics Template PDF. The topics addressed in these templates are Productivity, Metrics, Return On Investment. All the content presented in this PPT design is completely editable. Download it and make adjustments in color, background, font etc. as per your unique business setting.

Corporate Intelligence Business Analysis BI Applications Ppt Gallery Background Designs PDF
Presenting corporate intelligence business analysis bi applications ppt gallery background designs pdf to provide visual cues and insights. Share and navigate important information on nine stages that need your due attention. This template can be used to pitch topics like digital dashboards, spreadsheets, data warehouse, data cleansing, data mining. In addition, this PPT design contains high-resolution images, graphics, etc, that are easily editable and available for immediate download.
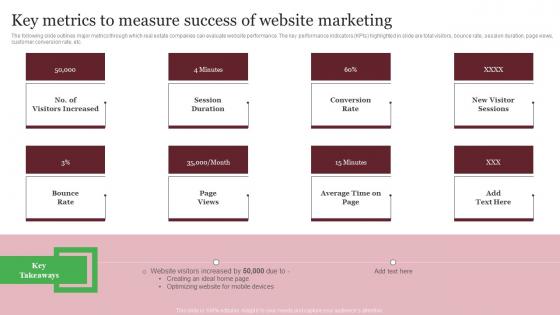
Key Metrics To Measure Success Of Website Marketing Out Of The Box Real Mockup Pdf
The following slide outlines major metrics through which real estate companies can evaluate website performance. The key performance indicators KPIs highlighted in slide are total visitors, bounce rate, session duration, page views, customer conversion rate, etc. This Key Metrics To Measure Success Of Website Marketing Out Of The Box Real Mockup Pdf from Slidegeeks makes it easy to present information on your topic with precision. It provides customization options, so you can make changes to the colors, design, graphics, or any other component to create a unique layout. It is also available for immediate download, so you can begin using it right away. Slidegeeks has done good research to ensure that you have everything you need to make your presentation stand out. Make a name out there for a brilliant performance. The following slide outlines major metrics through which real estate companies can evaluate website performance. The key performance indicators KPIs highlighted in slide are total visitors, bounce rate, session duration, page views, customer conversion rate, etc.
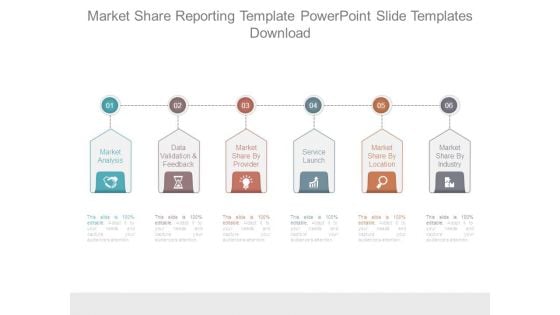
Market Share Reporting Template Powerpoint Slide Templates Download
This is a market share reporting template powerpoint slide templates download. This is a six stage process. The stages in this process are market analysis, data validation and feedback, market share by provider, service launch, market share by location, market share by industry.


 Continue with Email

 Home
Home


