Snapshot

Marketers Guide To Data Analysis Optimization Major Types Of Marketing Analytics Models Microsoft PDF
This slide covers three types of models to conduct marketing analytics. The mentioned models are descriptive models to identify what happened, predictive models to know what will happen, and prescriptive models to determine how to make it happen. Take your projects to the next level with our ultimate collection of Marketers Guide To Data Analysis Optimization Major Types Of Marketing Analytics Models Microsoft PDF. Slidegeeks has designed a range of layouts that are perfect for representing task or activity duration, keeping track of all your deadlines at a glance. Tailor these designs to your exact needs and give them a truly corporate look with your own brand colors they will make your projects stand out from the rest.
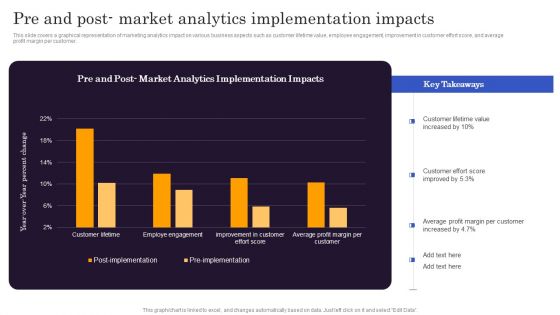
Marketers Guide To Data Analysis Optimization Pre And Post Market Analytics Implementation Impacts Formats PDF
This slide covers a graphical representation of marketing analytics impact on various business aspects such as customer lifetime value, employee engagement, improvement in customer effort score, and average profit margin per customer. Do you know about Slidesgeeks Marketers Guide To Data Analysis Optimization Pre And Post Market Analytics Implementation Impacts Formats PDF. These are perfect for delivering any kind od presentation. Using it, create PowerPoint presentations that communicate your ideas and engage audiences. Save time and effort by using our pre designed presentation templates that are perfect for a wide range of topic. Our vast selection of designs covers a range of styles, from creative to business, and are all highly customizable and easy to edit. Download as a PowerPoint template or use them as Google Slides themes.

How Big Data In Transforming Healthcare Developing Strategic Insights Using Big Data Analytics SS V
This slide showcases role of big data analytics in enhancing healthcare systems operational efficiency and improving patient outcomes. It provides information regarding drug discovery, resource allocation and health quality enhancement. Presenting this PowerPoint presentation, titled How Big Data In Transforming Healthcare Developing Strategic Insights Using Big Data Analytics SS V, with topics curated by our researchers after extensive research. This editable presentation is available for immediate download and provides attractive features when used. Download now and captivate your audience. Presenting this How Big Data In Transforming Healthcare Developing Strategic Insights Using Big Data Analytics SS V. Our researchers have carefully researched and created these slides with all aspects taken into consideration. This is a completely customizable How Big Data In Transforming Healthcare Developing Strategic Insights Using Big Data Analytics SS V that is available for immediate downloading. Download now and make an impact on your audience. Highlight the attractive features available with our PPTs. This slide showcases role of big data analytics in enhancing healthcare systems operational efficiency and improving patient outcomes. It provides information regarding drug discovery, resource allocation and health quality enhancement.
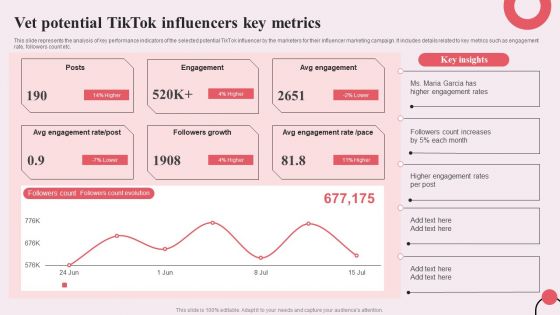
Tiktok Digital Marketing Campaign Vet Potential Tiktok Influencers Key Metrics Download PDF
This slide represents the analysis of key performance indicators of the selected potential TikTok influencer by the marketers for their influencer marketing campaign. It includes details related to key metrics such as engagement rate, followers count etc. Do you have to make sure that everyone on your team knows about any specific topic I yes, then you should give Tiktok Digital Marketing Campaign Vet Potential Tiktok Influencers Key Metrics Download PDF a try. Our experts have put a lot of knowledge and effort into creating this impeccable Tiktok Digital Marketing Campaign Vet Potential Tiktok Influencers Key Metrics Download PDF. You can use this template for your upcoming presentations, as the slides are perfect to represent even the tiniest detail. You can download these templates from the Slidegeeks website and these are easy to edit. So grab these today
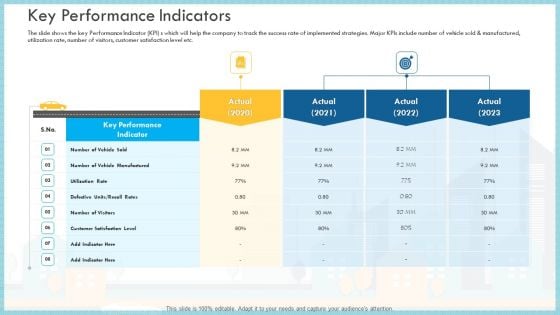
Loss Of Income And Financials Decline In An Automobile Organization Case Study Key Performance Indicators Brochure PDF
The slide shows the key Performance Indicator KPI s which will help the company to track the success rate of implemented strategies. Major KPIs include number of vehicle sold and manufactured, utilization rate, number of visitors, customer satisfaction level etc.Deliver an awe inspiring pitch with this creative loss of income and financials decline in an automobile organization case study key performance indicators brochure pdf bundle. Topics like key performance indicator, utilization rate, customer satisfaction level can be discussed with this completely editable template. It is available for immediate download depending on the needs and requirements of the user
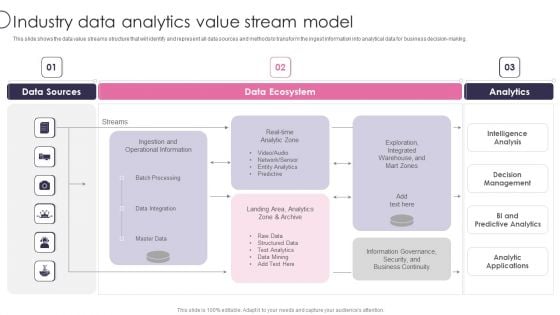
Information Transformation Process Toolkit Industry Data Analytics Value Stream Model Warehouse Template PDF
This slide shows the data value streams structure that will identify and represent all data sources and methods to transform the ingest information into analytical data for business decision making. Deliver an awe inspiring pitch with this creative Information Transformation Process Toolkit Industry Data Analytics Value Stream Model Warehouse Template PDF bundle. Topics like Data Sources, Data Ecosystem, Analytics can be discussed with this completely editable template. It is available for immediate download depending on the needs and requirements of the user.
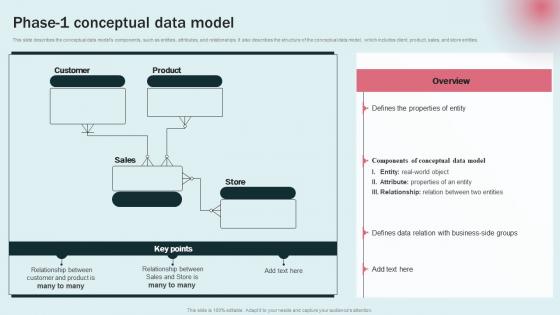
Phase 1 Conceptual Data Model Data Modeling Approaches For Modern Analytics Download Pdf
This slide describes the conceptual data models components, such as entities, attributes, and relationships. It also describes the structure of the conceptual data model, which includes client, product, sales, and store entities. This Phase 1 Conceptual Data Model Data Modeling Approaches For Modern Analytics Download Pdf is perfect for any presentation, be it in front of clients or colleagues. It is a versatile and stylish solution for organizing your meetings. The Phase 1 Conceptual Data Model Data Modeling Approaches For Modern Analytics Download Pdf features a modern design for your presentation meetings. The adjustable and customizable slides provide unlimited possibilities for acing up your presentation. Slidegeeks has done all the homework before launching the product for you. So, do not wait, grab the presentation templates today This slide describes the conceptual data models components, such as entities, attributes, and relationships. It also describes the structure of the conceptual data model, which includes client, product, sales, and store entities.
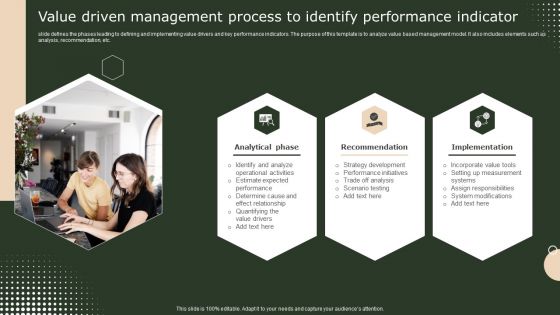
Value Driven Management Process To Identify Performance Indicator Themes PDF
slide defines the phases leading to defining and implementing value drivers and key performance indicators. The purpose of this template is to analyze value based management model. It also includes elements such as analysis, recommendation, etc. Persuade your audience using this Value Driven Management Process To Identify Performance Indicator Themes PDF. This PPT design covers three stages, thus making it a great tool to use. It also caters to a variety of topics including Recommendation, Analytical Phase, Implementation. Download this PPT design now to present a convincing pitch that not only emphasizes the topic but also showcases your presentation skills.
Ppt Music Smiley Emoticon With Guitar Operations Management PowerPoint Templates
PPT music smiley emoticon with guitar operations management powerpoint Templates-BORED Want some Entertainment in Life? Here it is Use this Music based Smiley PowerPoint Diagram to give a new start. This Diagram can be used for the following purposes: cappella, acoustic, bop, chamber, classical, folk, fusion, hard rock, harmony, hymn, instrumental, jazz, measure, melody, modern, opera, piece, plainsong, popular, ragtime, rap, refrain, rock, rock and roll, singing, song, soul, swing, tune.-PPT music smiley emoticon with guitar operations management powerpoint Templates Cut the cloth with our Ppt Music Smiley Emoticon With Guitar Operations Management PowerPoint Templates. Make your thoughts the fashion of the day.
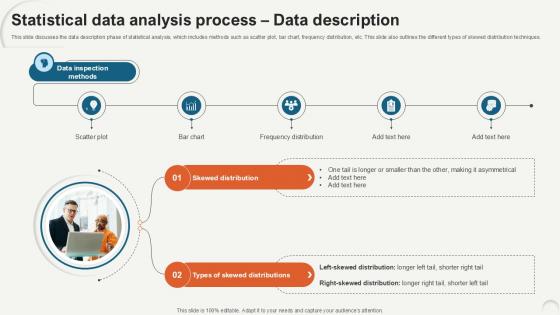
Statistical Data Analysis Process Data Description Ppt Example
This slide discusses the data description phase of statistical analysis, which includes methods such as scatter plot, bar chart, frequency distribution, etc. This slide also outlines the different types of skewed distribution techniques. Create an editable Statistical Data Analysis Process Data Description Ppt Example that communicates your idea and engages your audience. Whether you are presenting a business or an educational presentation, pre-designed presentation templates help save time. Statistical Data Analysis Process Data Description Ppt Example is highly customizable and very easy to edit, covering many different styles from creative to business presentations. Slidegeeks has creative team members who have crafted amazing templates. So, go and get them without any delay. This slide discusses the data description phase of statistical analysis, which includes methods such as scatter plot, bar chart, frequency distribution, etc. This slide also outlines the different types of skewed distribution techniques.
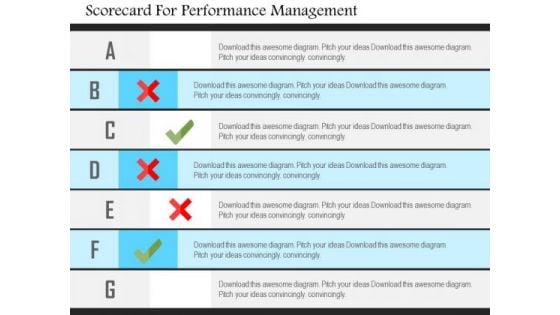
Business Diagram Scorecard For Performance Management Presentation Template
This business diagram is designed with graphics of scorecard. You may use this business slide to present performance management. This diagram provides an effective way of displaying information you can edit text, color, shade and style as per you need.
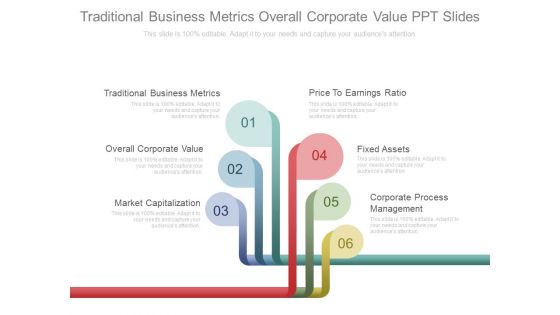
Traditional Business Metrics Overall Corporate Value Ppt Slides
This is a traditional business metrics overall corporate value ppt slides. This is a six stage process. The stages in this process are success, business, marketing.
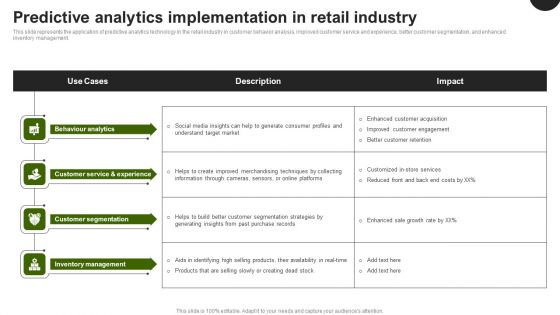
Predictive Analytics In The Age Of Big Data Predictive Analytics Implementation In Retail Industry Themes PDF
This slide represents the application of predictive analytics technology in the retail industry in customer behavior analysis, improved customer service and experience, better customer segmentation, and enhanced inventory management. Coming up with a presentation necessitates that the majority of the effort goes into the content and the message you intend to convey. The visuals of a PowerPoint presentation can only be effective if it supplements and supports the story that is being told. Keeping this in mind our experts created Predictive Analytics In The Age Of Big Data Predictive Analytics Implementation In Retail Industry Themes PDF to reduce the time that goes into designing the presentation. This way, you can concentrate on the message while our designers take care of providing you with the right template for the situation.
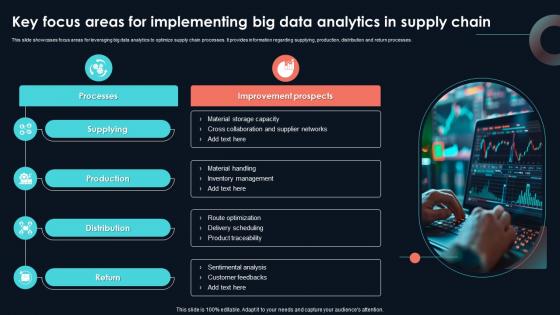
Key Focus Areas For Implementing Big Data Developing Strategic Insights Using Big Data Analytics SS V
This slide showcases focus areas for leveraging big data analytics to optimize supply chain processes. It provides information regarding supplying, production, distribution and return processes. Present like a pro with Key Focus Areas For Implementing Big Data Developing Strategic Insights Using Big Data Analytics SS V. Create beautiful presentations together with your team, using our easy-to-use presentation slides. Share your ideas in real-time and make changes on the fly by downloading our templates. So whether you are in the office, on the go, or in a remote location, you can stay in sync with your team and present your ideas with confidence. With Slidegeeks presentation got a whole lot easier. Grab these presentations today. This slide showcases focus areas for leveraging big data analytics to optimize supply chain processes. It provides information regarding supplying, production, distribution and return processes.
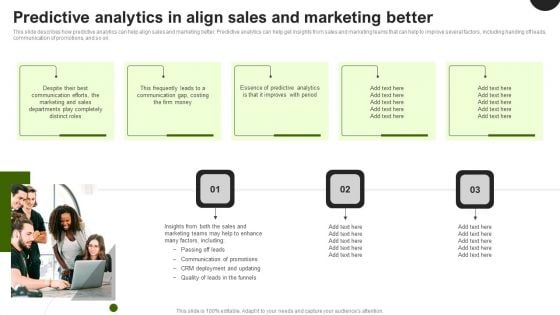
Predictive Analytics In The Age Of Big Data Predictive Analytics In Align Sales And Marketing Better Topics PDF
This slide describes how predictive analytics can help align sales and marketing better. Predictive analytics can help get insights from sales and marketing teams that can help to improve several factors, including handing off leads, communication of promotions, and so on. This modern and well arranged Predictive Analytics In The Age Of Big Data Predictive Analytics In Align Sales And Marketing Better Topics PDF provides lots of creative possibilities. It is very simple to customize and edit with the Powerpoint Software. Just drag and drop your pictures into the shapes. All facets of this template can be edited with Powerpoint no extra software is necessary. Add your own material, put your images in the places assigned for them, adjust the colors, and then you can show your slides to the world, with an animated slide included.
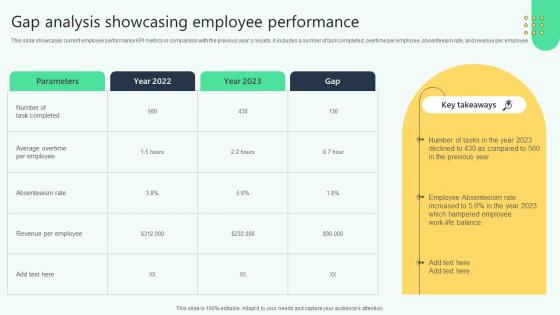
Gap Analysis Showcasing Employee Performance Analysing Hr Data For Effective Decision Making
This slide showcases current employee performance KPI metrics in comparison with the previous years results. It includes a number of task completed, overtime per employee, absenteeism rate, and revenue per employee. This modern and well-arranged Gap Analysis Showcasing Employee Performance Analysing Hr Data For Effective Decision Making provides lots of creative possibilities. It is very simple to customize and edit with the Powerpoint Software. Just drag and drop your pictures into the shapes. All facets of this template can be edited with Powerpoint, no extra software is necessary. Add your own material, put your images in the places assigned for them, adjust the colors, and then you can show your slides to the world, with an animated slide included. This slide showcases current employee performance KPI metrics in comparison with the previous years results. It includes a number of task completed, overtime per employee, absenteeism rate, and revenue per employee.
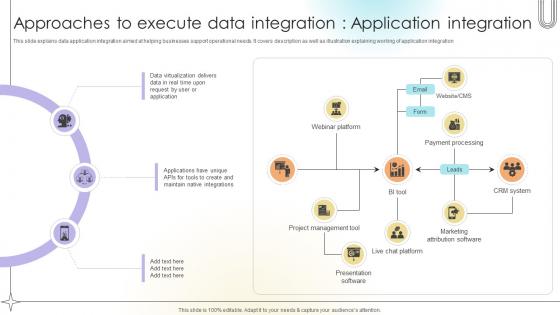
Approaches To Execute Data Integration Application Integration Data Analytics SS V
This slide explains data application integration aimed at helping businesses support operational needs. It covers description as well as illustration explaining working of application integration.Find highly impressive Approaches To Execute Data Integration Application Integration Data Analytics SS V on Slidegeeks to deliver a meaningful presentation. You can save an ample amount of time using these presentation templates. No need to worry to prepare everything from scratch because Slidegeeks experts have already done a huge research and work for you. You need to download Approaches To Execute Data Integration Application Integration Data Analytics SS V for your upcoming presentation. All the presentation templates are 100 percent editable and you can change the color and personalize the content accordingly. Download now This slide explains data application integration aimed at helping businesses support operational needs. It covers description as well as illustration explaining working of application integration.
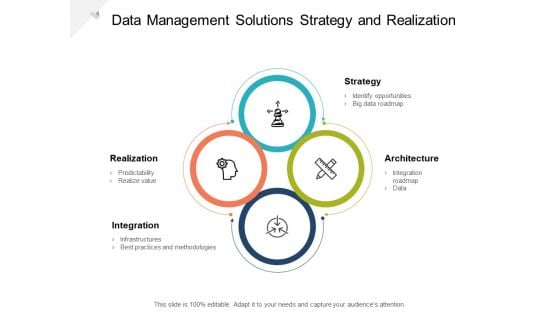
Data Management Solutions Strategy And Realization Ppt PowerPoint Presentation Pictures Show Cpb
This is a data management solutions strategy and realization ppt powerpoint presentation pictures show cpb. This is a four stage process. The stages in this process are data analysis, analytics architecture, analytics framework.
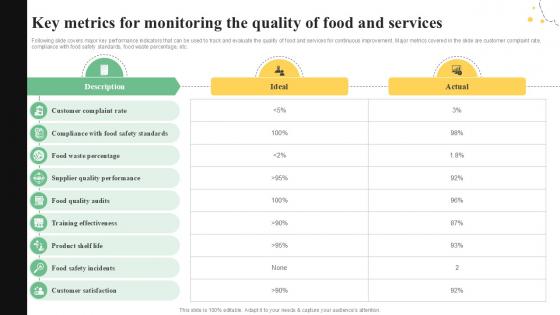
Key Metrics For Monitoring The Quality Control Guide For Food PPT Slide
Following slide covers major key performance indicators that can be used to track and evaluate the quality of food and services for continuous improvement. Major metrics covered in the slide are customer complaint rate, compliance with food safety standards, food waste percentage, etc. Explore a selection of the finest Key Metrics For Monitoring The Quality Control Guide For Food PPT Slide here. With a plethora of professionally designed and pre-made slide templates, you can quickly and easily find the right one for your upcoming presentation. You can use our Key Metrics For Monitoring The Quality Control Guide For Food PPT Slide to effectively convey your message to a wider audience. Slidegeeks has done a lot of research before preparing these presentation templates. The content can be personalized and the slides are highly editable. Grab templates today from Slidegeeks. Following slide covers major key performance indicators that can be used to track and evaluate the quality of food and services for continuous improvement. Major metrics covered in the slide are customer complaint rate, compliance with food safety standards, food waste percentage, etc.
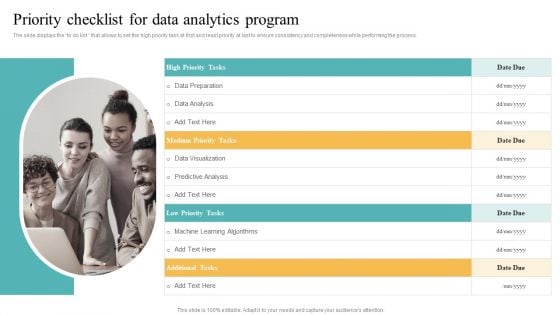
Transformation Toolkit Competitive Intelligence Information Analysis Priority Checklist For Data Analytics Program Inspiration PDF
The slide displays the to do list that allows to set the high priority task at first and least priority at last to ensure consistency and completeness while performing the process. Slidegeeks has constructed Transformation Toolkit Competitive Intelligence Information Analysis Priority Checklist For Data Analytics Program Inspiration PDF after conducting extensive research and examination. These presentation templates are constantly being generated and modified based on user preferences and critiques from editors. Here, you will find the most attractive templates for a range of purposes while taking into account ratings and remarks from users regarding the content. This is an excellent jumping off point to explore our content and will give new users an insight into our top notch PowerPoint Templates.
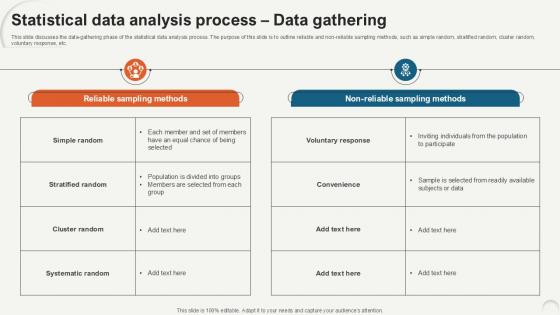
Statistical Data Analysis Process Data Gathering Ppt Example
This slide discusses the data-gathering phase of the statistical data analysis process. The purpose of this slide is to outline reliable and non-reliable sampling methods, such as simple random, stratified random, cluster random, voluntary response, etc. Slidegeeks is one of the best resources for PowerPoint templates. You can download easily and regulate Statistical Data Analysis Process Data Gathering Ppt Example for your personal presentations from our wonderful collection. A few clicks is all it takes to discover and get the most relevant and appropriate templates. Use our Templates to add a unique zing and appeal to your presentation and meetings. All the slides are easy to edit and you can use them even for advertisement purposes. This slide discusses the data-gathering phase of the statistical data analysis process. The purpose of this slide is to outline reliable and non-reliable sampling methods, such as simple random, stratified random, cluster random, voluntary response, etc.
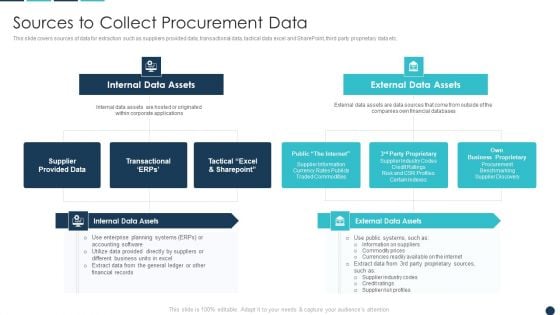
Procurement Analytics Tools And Strategies Sources To Collect Procurement Data Guidelines PDF
This slide covers sources of data for extraction such as suppliers provided data, transactional data, tactical data excel and SharePoint, third party proprietary data etc.Deliver and pitch your topic in the best possible manner with this Procurement Analytics Tools And Strategies Sources To Collect Procurement Data Guidelines PDF. Use them to share invaluable insights on Internal Data, External Data, Business Proprietary and impress your audience. This template can be altered and modified as per your expectations. So, grab it now.
CRM System Deployment Plan Implementation Steps Determine Metrics Supporting Icons PDF
This slide covers various KPIs that need to be measured to achieve organizational goals. It includes metrics such as salespersons performance report, number of leads converted, leads generated through campaigns, monthly sales report, number of unresolved cases, etc. This is a CRM System Deployment Plan Implementation Steps Determine Metrics Supporting Icons PDF template with various stages. Focus and dispense information on one stages using this creative set, that comes with editable features. It contains large content boxes to add your information on topics like Report And Dashboard, Metrics, Resource. You can also showcase facts, figures, and other relevant content using this PPT layout. Grab it now.

Benefits Data Modeling DBMS Data Modeling Approaches For Modern Analytics Topics Pdf
This slide covers the benefits of data modeling such as reducing data redundancy, improved coordination, reducing complexity, minimizing cost of production, and well defined data relationships. Slidegeeks is one of the best resources for PowerPoint templates. You can download easily and regulate Benefits Data Modeling DBMS Data Modeling Approaches For Modern Analytics Topics Pdf for your personal presentations from our wonderful collection. A few clicks is all it takes to discover and get the most relevant and appropriate templates. Use our Templates to add a unique zing and appeal to your presentation and meetings. All the slides are easy to edit and you can use them even for advertisement purposes. This slide covers the benefits of data modeling such as reducing data redundancy, improved coordination, reducing complexity, minimizing cost of production, and well defined data relationships.
Unlocking Potential Enhancing Team Members Performance Tracking Dashboards
This slide depicts performance tracking dashboard for project manager to analyze work being done by the team. It includes average rating for the week, total work done and weekly change, employee rating and work done. Take your projects to the next level with our ultimate collection of Unlocking Potential Enhancing Team Members Performance Tracking Dashboards. Slidegeeks has designed a range of layouts that are perfect for representing task or activity duration, keeping track of all your deadlines at a glance. Tailor these designs to your exact needs and give them a truly corporate look with your own brand colors they will make your projects stand out from the rest This slide depicts performance tracking dashboard for project manager to analyze work being done by the team. It includes average rating for the week, total work done and weekly change, employee rating and work done.
Unlocking Potential Enhancing Team Training And Development Program Tracking Dashboard
This slide depicts team development program tracking dashboard to analyze the impact of implementing training plan for the members. It includes training satisfaction rate, engagement score, drop-out rate and top 5 trainees. Find a pre-designed and impeccable Unlocking Potential Enhancing Team Training And Development Program Tracking Dashboard. The templates can ace your presentation without additional effort. You can download these easy-to-edit presentation templates to make your presentation stand out from others. So, what are you waiting for Download the template from Slidegeeks today and give a unique touch to your presentation. This slide depicts team development program tracking dashboard to analyze the impact of implementing training plan for the members. It includes training satisfaction rate, engagement score, drop-out rate and top 5 trainees.
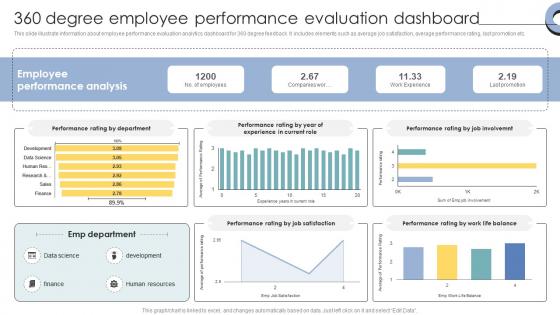
Skill Enhancement Performance 360 Degree Employee Performance Evaluation Dashboard
This slide illustrate information about employee performance evaluation analytics dashboard for 360 degree feedback. It includes elements such as average job satisfaction, average performance rating, last promotion etc. If your project calls for a presentation, then Slidegeeks is your go-to partner because we have professionally designed, easy-to-edit templates that are perfect for any presentation. After downloading, you can easily edit Skill Enhancement Performance 360 Degree Employee Performance Evaluation Dashboard and make the changes accordingly. You can rearrange slides or fill them with different images. Check out all the handy templates This slide illustrate information about employee performance evaluation analytics dashboard for 360 degree feedback. It includes elements such as average job satisfaction, average performance rating, last promotion etc.
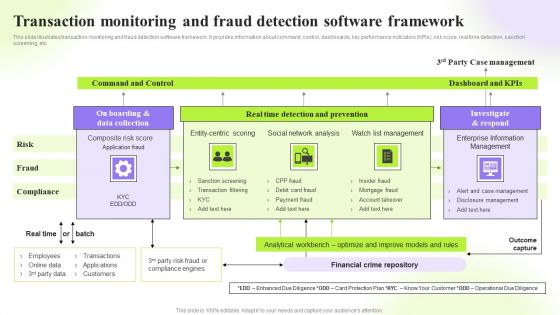
Techniques To Monitor Transactions Transaction Monitoring And Fraud Detection Sample PDF
This slide illustrates transaction monitoring and fraud detection software framework. It provides information about command, control, dashboards, key performance indicators KPIs, risk score, real time detection, sanction screening, etc. From laying roadmaps to briefing everything in detail, our templates are perfect for you. You can set the stage with your presentation slides. All you have to do is download these easy-to-edit and customizable templates. Techniques To Monitor Transactions Transaction Monitoring And Fraud Detection Sample PDF will help you deliver an outstanding performance that everyone would remember and praise you for. Do download this presentation today.
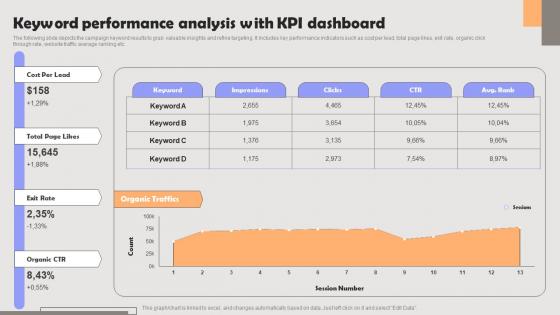
Improving PPC Campaign Results Keyword Performance Analysis With KPI Sample Pdf
The following slide depicts the campaign keyword results to grab valuable insights and refine targeting. It includes key performance indicators such as cost per lead, total page likes, exit rate, organic click through rate, website traffic average ranking etc. This Improving PPC Campaign Results Keyword Performance Analysis With KPI Sample Pdf is perfect for any presentation, be it in front of clients or colleagues. It is a versatile and stylish solution for organizing your meetings. The Improving PPC Campaign Results Keyword Performance Analysis With KPI Sample Pdf features a modern design for your presentation meetings. The adjustable and customizable slides provide unlimited possibilities for acing up your presentation. Slidegeeks has done all the homework before launching the product for you. So, do not wait, grab the presentation templates today The following slide depicts the campaign keyword results to grab valuable insights and refine targeting. It includes key performance indicators such as cost per lead, total page likes, exit rate, organic click through rate, website traffic average ranking etc.

Digital Content Performance Assessment Top Of The Funnel Digital Content Strategy SS V
The following slide depicts key performance indicators of digital content marketing to monitor results. It includes elements such as page views, social shares, click through rate, blog subscribers, conversions, opportunities influenced, average time on page etc. Find highly impressive Digital Content Performance Assessment Top Of The Funnel Digital Content Strategy SS V on Slidegeeks to deliver a meaningful presentation. You can save an ample amount of time using these presentation templates. No need to worry to prepare everything from scratch because Slidegeeks experts have already done a huge research and work for you. You need to download Digital Content Performance Assessment Top Of The Funnel Digital Content Strategy SS V for your upcoming presentation. All the presentation templates are 100 percent editable and you can change the color and personalize the content accordingly. Download now The following slide depicts key performance indicators of digital content marketing to monitor results. It includes elements such as page views, social shares, click through rate, blog subscribers, conversions, opportunities influenced, average time on page etc.
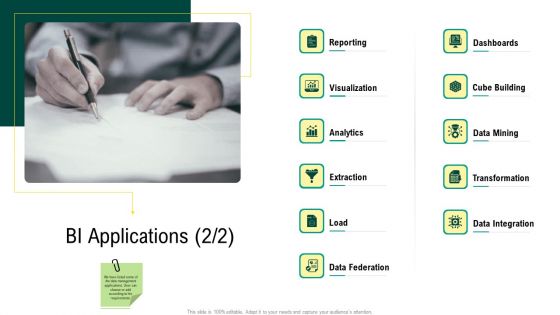
Expert Systems BI Applications Analytics Sample PDF
Presenting expert systems bi applications analytics sample pdf to provide visual cues and insights. Share and navigate important information on elven stages that need your due attention. This template can be used to pitch topics like reporting, visualization, analytics, extraction, data mining, cube building, transformation. In addtion, this PPT design contains high-resolution images, graphics, etc, that are easily editable and available for immediate download.
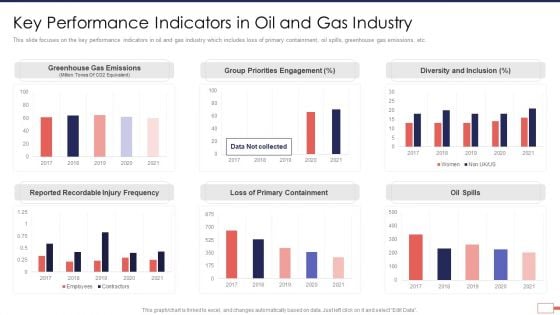
Iot Digital Twin Technology Post Covid Expenditure Management Key Performance Indicators Background PDF
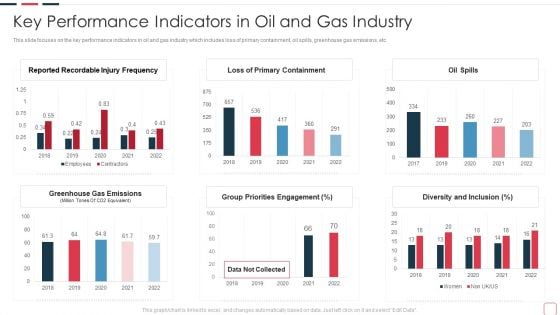
This slide focuses on the key performance indicators in oil and gas industry which includes loss of primary containment, oil spills, greenhouse gas emissions, etc. Deliver an awe inspiring pitch with this creative iot digital twin technology post covid expenditure management key performance indicators background pdf bundle. Topics like key performance indicators in oil and gas industry can be discussed with this completely editable template. It is available for immediate download depending on the needs and requirements of the user.
Price Benefit Internet Things Digital Twins Execution After Covid Key Performance Indicators In Oil Slides PDF
This slide focuses on the key performance indicators in oil and gas industry which includes loss of primary containment, oil spills, greenhouse gas emissions, etc. Deliver an awe inspiring pitch with this creative price benefit internet things digital twins execution after covid key performance indicators in oil slides pdf bundle. Topics like key performance indicators in oil and gas industry can be discussed with this completely editable template. It is available for immediate download depending on the needs and requirements of the user.
Hoshin Kanri Pitch Deck Key Performance Indicators Bowling Chart Introduction PDF
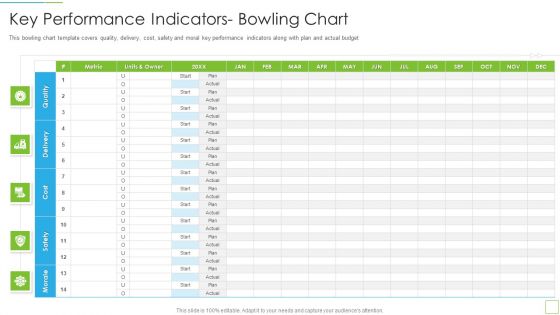
This bowling chart template covers quality, delivery, cost, safety and moral key performance indicators along with plan and actual budget Deliver an awe inspiring pitch with this creative hoshin kanri pitch deck key performance indicators bowling chart introduction pdf bundle. Topics like key performance indicators bowling chart can be discussed with this completely editable template. It is available for immediate download depending on the needs and requirements of the user.
Confidential Information Memorandum Key Performance Indicators Of The Company Inspiration PDF
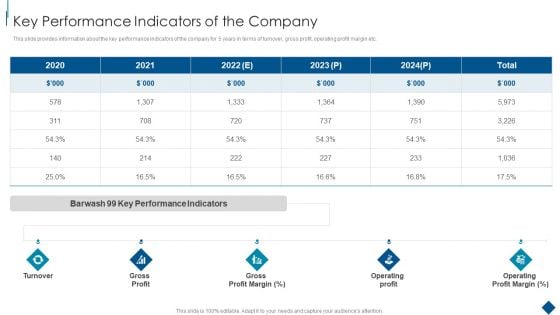
This slide provides information about the key performance indicators of the company for 5 years in terms of turnover, gross profit, operating profit margin etc. Deliver an awe inspiring pitch with this creative Confidential Information Memorandum Key Performance Indicators Of The Company Inspiration PDF bundle. Topics like Key Performance Indicators, Turnover Gross Profit, Gross Profit Margin can be discussed with this completely editable template. It is available for immediate download depending on the needs and requirements of the user.
Redis Cache Data Structure IT Before Vs After Redis Cache Portrait PDF
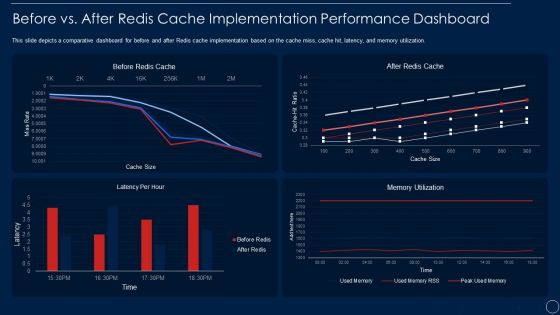
This slide depicts a comparative dashboard for before and after Redis cache implementation based on the cache miss, cache hit, latency, and memory utilization. Deliver an awe inspiring pitch with this creative redis cache data structure it before vs after redis cache portrait pdf bundle. Topics like before vs after redis cache implementation performance dashboard can be discussed with this completely editable template. It is available for immediate download depending on the needs and requirements of the user.
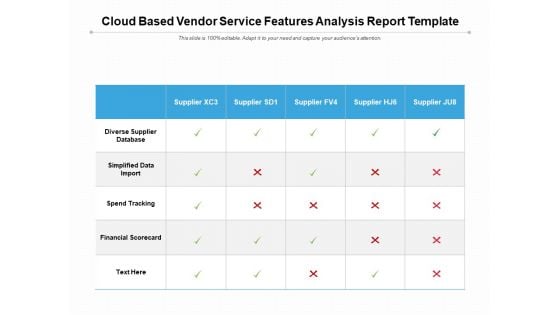
Cloud Based Vendor Service Features Analysis Report Template Ppt PowerPoint Presentation Slides Clipart Images PDF
Pitch your topic with ease and precision using this cloud based vendor service features analysis report template ppt powerpoint presentation slides clipart images pdf. This layout presents information on diverse supplier database, simplified data import, spend tracking, financial scorecard. It is also available for immediate download and adjustment. So, changes can be made in the color, design, graphics or any other component to create a unique layout.
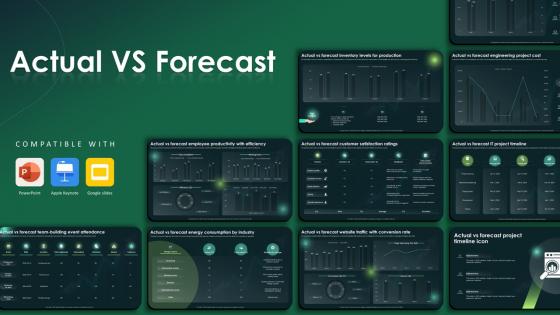
Actual Vs Forecast Powerpoint Ppt Template Bundles
This Actual Vs Forecast Powerpoint Ppt Template Bundles is designed to help you retain your audiences attention. This content-ready PowerPoint Template enables you to take your audience on a journey and share information in a way that is easier to recall. It helps you highlight the crucial parts of your work so that the audience does not get saddled with information download. This KPI Dashboard, Data Driven Marketing, Campaign Performance, Marketing Evaluation, Inventory Assessment-slide PPT Deck comes prepared with the graphs and charts you could need to showcase your information through visuals. You only need to enter your own data in them. Download this editable PowerPoint Theme and walk into that meeting with confidence. Our Actual vs. Forecast PowerPoint presentation can provide you with valuable business insights. Analyze sales figures, budgets, and financial predictions. Identify major differences, modify methods, and match projections with results to improve decision-making. Download now to accelerate your success.
Chart With Magnifying Glass For Business Research Ppt PowerPoint Presentation Inspiration Shapes
This is a chart with magnifying glass for business research ppt powerpoint presentation inspiration shapes. This is a two stage process. The stages in this process are metrics icon, kpis icon, statistics icon.
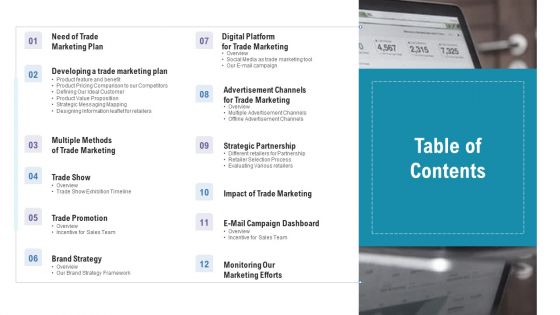
Table Of Contents Commercial Activities Marketing Tools Guidelines PDF
Presenting table of contents commercial activities marketing tools guidelines pdf to provide visual cues and insights. Share and navigate important information on twelve stages that need your due attention. This template can be used to pitch topics like trade show, trade marketing, campaign dashboard, monitoring, strategic partnership. In addtion, this PPT design contains high resolution images, graphics, etc, that are easily editable and available for immediate download.
Customer Satisfaction Metrics With NPR And Customer Effort Score Ppt Icon Graphics Tutorials PDF
The slide carries a dashboard to evaluate customer experience for bringing advancement in existing products. Various KPIs used to measure customer experience are NPS Net Promoter Score and CES Customer Effort Score. Showcasing this set of slides titled Customer Satisfaction Metrics With NPR And Customer Effort Score Ppt Icon Graphics Tutorials PDF. The topics addressed in these templates are Net Promoter Score, Customer Effort Score, Product Service Reviews. All the content presented in this PPT design is completely editable. Download it and make adjustments in color, background, font etc. as per your unique business setting.
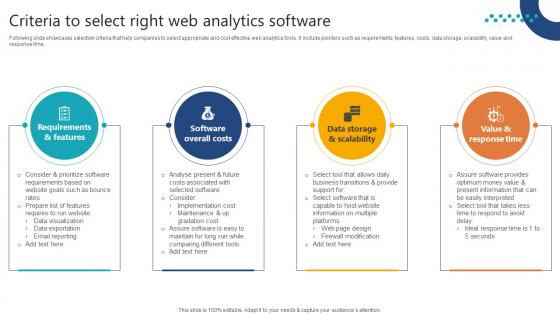
Complete Guide To Launch Criteria To Select Right Web Analytics Software
Following slide showcases selection criteria that help companies to select appropriate and cost effective web analytics tools. It include pointers such as requirements, features, costs, data storage, scalability, value and response time. If your project calls for a presentation, then Slidegeeks is your go-to partner because we have professionally designed, easy-to-edit templates that are perfect for any presentation. After downloading, you can easily edit Complete Guide To Launch Criteria To Select Right Web Analytics Software and make the changes accordingly. You can rearrange slides or fill them with different images. Check out all the handy templates Following slide showcases selection criteria that help companies to select appropriate and cost effective web analytics tools. It include pointers such as requirements, features, costs, data storage, scalability, value and response time.

Complete Guide To Launch Overview And Types Of Website Analytics Software
Following slide provides overview of website analytics software that provides data to track activities of visitors for strategy formulation. It further covers description, advantages and emerging trends. This Complete Guide To Launch Overview And Types Of Website Analytics Software from Slidegeeks makes it easy to present information on your topic with precision. It provides customization options, so you can make changes to the colors, design, graphics, or any other component to create a unique layout. It is also available for immediate download, so you can begin using it right away. Slidegeeks has done good research to ensure that you have everything you need to make your presentation stand out. Make a name out there for a brilliant performance. Following slide provides overview of website analytics software that provides data to track activities of visitors for strategy formulation. It further covers description, advantages and emerging trends.
One Page Plan With Key Performance Indicators Ppt PowerPoint Presentation Model Smartart PDF
Presenting this set of slides with name one page plan with key performance indicators ppt powerpoint presentation model smartart pdf. The topics discussed in these slides are purpose, key objectives, initiatives, key performance indicators. This is a completely editable PowerPoint presentation and is available for immediate download. Download now and impress your audience.
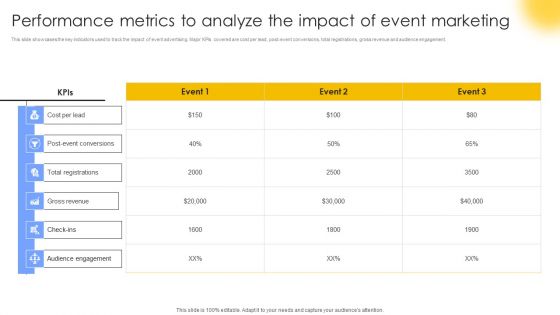
Performance Metrics To Analyze The Impact Of Event Marketing Structure PDF
This slide showcases the key indicators used to track the impact of event advertising. Major KPIs covered are cost per lead, post-event conversions, total registrations, gross revenue and audience engagement. The best PPT templates are a great way to save time, energy, and resources. Slidegeeks have 100 percent editable powerpoint slides making them incredibly versatile. With these quality presentation templates, you can create a captivating and memorable presentation by combining visually appealing slides and effectively communicating your message. Download Performance Metrics To Analyze The Impact Of Event Marketing Structure PDF from Slidegeeks and deliver a wonderful presentation.
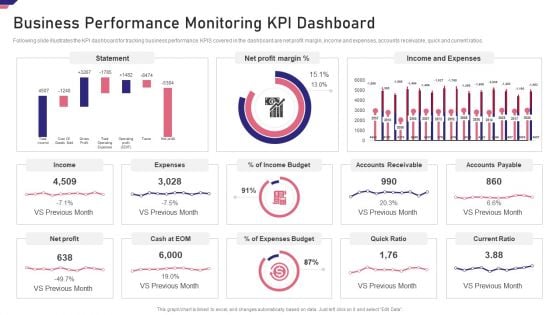
Mergers Acquisition Playbook Mergers Acquisition Playbook Business Performance Guidelines PDF
Following slide illustrates the KPI dashboard for tracking business performance. KPIS covered in the dashboard are net profit margin, income and expenses, accounts receivable, quick and current ratios.Deliver an awe inspiring pitch with this creative Mergers Acquisition Playbook Mergers Acquisition Playbook Business Performance Guidelines PDF bundle. Topics like Business Performance Monitoring KPI Dashboard can be discussed with this completely editable template. It is available for immediate download depending on the needs and requirements of the user.
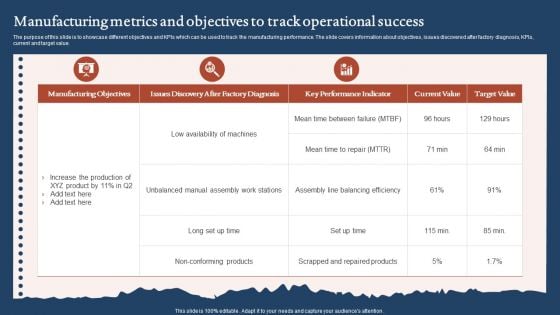
Manufacturing Metrics And Objectives To Track Operational Success Formats PDF
The purpose of this slide is to showcase different objectives and KPIs which can be used to track the manufacturing performance. The slide covers information about objectives, issues discovered after factory diagnosis, KPIs, current and target value. Showcasing this set of slides titled Manufacturing Metrics And Objectives To Track Operational Success Formats PDF. The topics addressed in these templates are Manufacturing Objectives, Key Performance Indicator, Target Value. All the content presented in this PPT design is completely editable. Download it and make adjustments in color, background, font etc. as per your unique business setting.
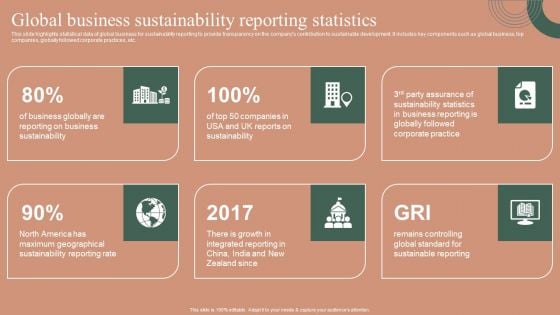
Global Business Sustainability Reporting Statistics Themes PDF
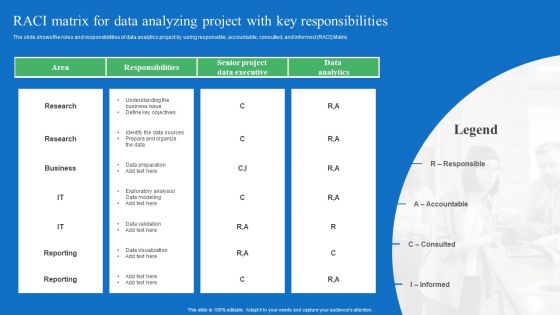
Toolkit For Data Science And Analytics Transition RACI Matrix For Data Analyzing Project With Key Responsibilities Background PDF
The slide shows the roles and responsibilities of data analytics project by using responsible, accountable, consulted, and informed RACI Matrix. Whether you have daily or monthly meetings, a brilliant presentation is necessary. Toolkit For Data Science And Analytics Transition RACI Matrix For Data Analyzing Project With Key Responsibilities Background PDF can be your best option for delivering a presentation. Represent everything in detail using Toolkit For Data Science And Analytics Transition RACI Matrix For Data Analyzing Project With Key Responsibilities Background PDF and make yourself stand out in meetings. The template is versatile and follows a structure that will cater to your requirements. All the templates prepared by Slidegeeks are easy to download and edit. Our research experts have taken care of the corporate themes as well. So, give it a try and see the results.
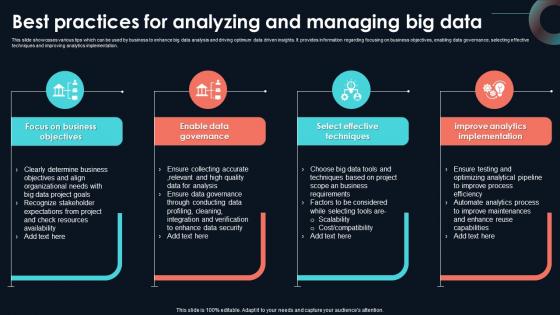
Best Practices For Analyzing And Managing Developing Strategic Insights Using Big Data Analytics SS V
This slide showcases various tips which can be used by business to enhance big data analysis and driving optimum data driven insights. It provides information regarding focusing on business objectives, enabling data governance, selecting effective techniques and improving analytics implementation. From laying roadmaps to briefing everything in detail, our templates are perfect for you. You can set the stage with your presentation slides. All you have to do is download these easy-to-edit and customizable templates. Best Practices For Analyzing And Managing Developing Strategic Insights Using Big Data Analytics SS V will help you deliver an outstanding performance that everyone would remember and praise you for. Do download this presentation today. This slide showcases various tips which can be used by business to enhance big data analysis and driving optimum data driven insights. It provides information regarding focusing on business objectives, enabling data governance, selecting effective techniques and improving analytics implementation.
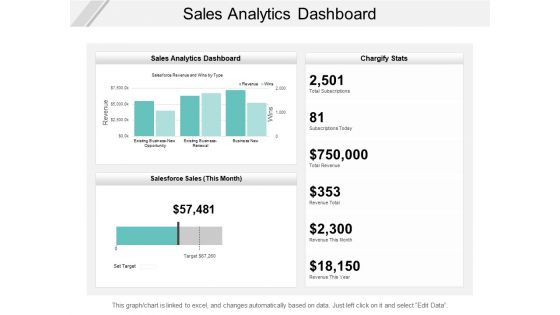
Sales Analytics Dashboard Ppt PowerPoint Presentation Outline Diagrams
Presenting this set of slides with name sales analytics dashboard ppt powerpoint presentation outline diagrams. The topics discussed in these slides are buzz marketing, process, strategy. This is a completely editable PowerPoint presentation and is available for immediate download. Download now and impress your audience.
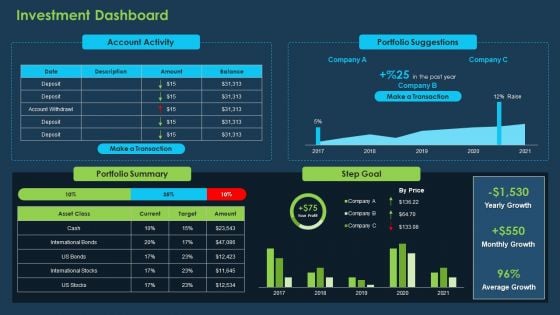
Commercial Banking Template Collection Investment Dashboard Ppt Show Samples PDF
Deliver an awe-inspiring pitch with this creative commercial banking template collection investment dashboard ppt show samples pdf bundle. Topics like portfolio suggestions, portfolio summary, step goal can be discussed with this completely editable template. It is available for immediate download depending on the needs and requirements of the user.
Recommendation Techniques Recommender Systems Performance Tracking Dashboard Brochure PDF
This slide shows the dashboard to keep a track of the performance of recommender systems. The purpose of this slide is to provide a graphical representation of recommendation engines performance to enhance the accuracy and effectiveness of the system. Find highly impressive Recommendation Techniques Recommender Systems Performance Tracking Dashboard Brochure PDF on Slidegeeks to deliver a meaningful presentation. You can save an ample amount of time using these presentation templates. No need to worry to prepare everything from scratch because Slidegeeks experts have already done a huge research and work for you. You need to download Recommendation Techniques Recommender Systems Performance Tracking Dashboard Brochure PDF for your upcoming presentation. All the presentation templates are 100 percent editable and you can change the color and personalize the content accordingly. Download now This slide shows the dashboard to keep a track of the performance of recommender systems. The purpose of this slide is to provide a graphical representation of recommendation engines performance to enhance the accuracy and effectiveness of the system.
Green Computing Green Cloud Computing Performance Tracking Dashboard
This slide depicts the performance tracking dashboard for green cloud computing. This slide aims to showcase the performance tracking report of green cloud computing by covering parameters such asPower Use Effectiveness PUE, high-density zone, history, consumption, and Average Propensity to Consume APC consumption. If you are looking for a format to display your unique thoughts, then the professionally designed Green Computing Green Cloud Computing Performance Tracking Dashboard is the one for you. You can use it as a Google Slides template or a PowerPoint template. Incorporate impressive visuals, symbols, images, and other charts. Modify or reorganize the text boxes as you desire. Experiment with shade schemes and font pairings. Alter, share or cooperate with other people on your work. Download Green Computing Green Cloud Computing Performance Tracking Dashboard and find out how to give a successful presentation. Present a perfect display to your team and make your presentation unforgettable. This slide depicts the performance tracking dashboard for green cloud computing. This slide aims to showcase the performance tracking report of green cloud computing by covering parameters such asPower Use Effectiveness PUE, high-density zone, history, consumption, and Average Propensity to Consume APC consumption.
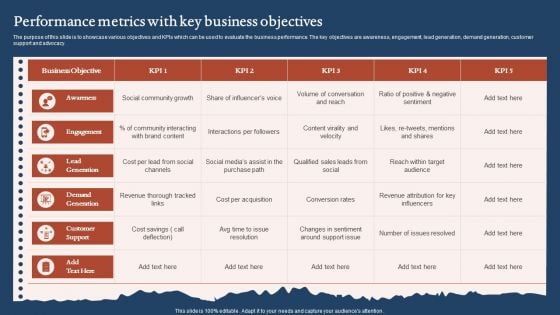
Performance Metrics With Key Business Objectives Guidelines PDF
The purpose of this slide is to showcase various objectives and KPIs which can be used to evaluate the business performance. The key objectives are awareness, engagement, lead generation, demand generation, customer support and advocacy. Pitch your topic with ease and precision using this Performance Metrics With Key Business Objectives Guidelines PDF. This layout presents information on Social Community Growth, Cost Per Acquisition, Customer Support. It is also available for immediate download and adjustment. So, changes can be made in the color, design, graphics or any other component to create a unique layout.
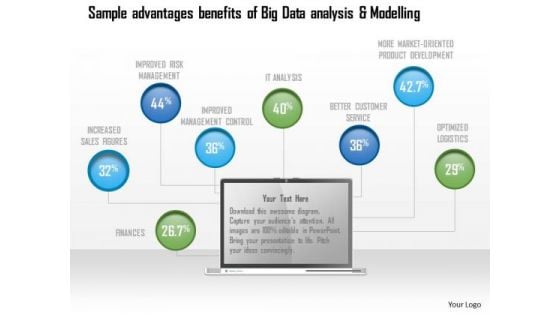
Business Diagram Sample Advantages Benefits Of Big Data Analysis And Modelling Ppt Slide
Explain the concept of sample advantages and benefits of big data analysis with this unique diagram. This slide contains the graphic of data icons. Use this slide to present data analysis and modeling related topics in any presentation.
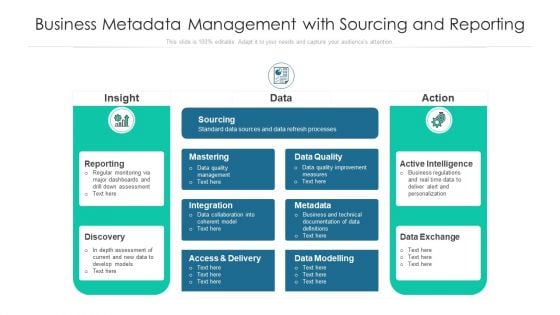
Business Metadata Management With Sourcing And Reporting Ppt PowerPoint Presentation Gallery Slides PDF
Showcasing this set of slides titled business metadata management with sourcing and reporting ppt powerpoint presentation gallery slides pdf. The topics addressed in these templates are data quality, measures, metadata. All the content presented in this PPT design is completely editable. Download it and make adjustments in color, background, font etc. as per your unique business setting.
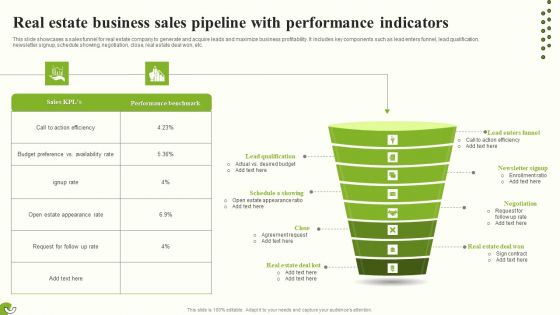
Real Estate Business Sales Pipeline With Performance Indicators Background PDF
This slide showcases a sales funnel for real estate company to generate and acquire leads and maximize business profitability. It includes key components such as lead enters funnel, lead qualification, newsletter signup, schedule showing, negotiation, close, real estate deal won, etc. Presenting Real Estate Business Sales Pipeline With Performance Indicators Background PDF to dispense important information. This template comprises eight stages. It also presents valuable insights into the topics including Budget Preference, Newsletter Signup, Real Estate Deal Won. This is a completely customizable PowerPoint theme that can be put to use immediately. So, download it and address the topic impactfully.
Accounts Receivable Key Performance Indicators Ppt PowerPoint Presentation Visual Aids Model Cpb
Presenting this set of slides with name accounts receivable key performance indicators ppt powerpoint presentation visual aids model cpb. This is a three stage process. The stages in this process are accounts receivable key performance indicators. This is a completely editable PowerPoint presentation and is available for immediate download. Download now and impress your audience.
Key Performance Indicators Examples Marketing Ppt PowerPoint Presentation Ideas Clipart Cpb
Presenting this set of slides with name key performance indicators examples marketing ppt powerpoint presentation ideas clipart cpb. This is a four stage process. The stages in this process are key performance indicators examples marketing. This is a completely editable PowerPoint presentation and is available for immediate download. Download now and impress your audience.


 Continue with Email

 Home
Home


