Snapshot

Data And Analytics Ppt PowerPoint Presentation Gallery Graphics Pictures
This is a data and analytics ppt powerpoint presentation gallery graphics pictures. This is a ten stage process. The stages in this process are graph analytics, journey sciences, augmented reality, hyper personalisation, behavioural analytics.
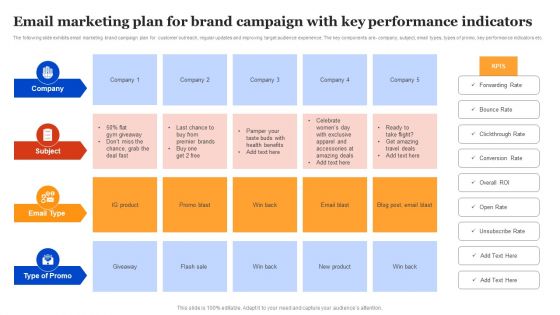
Email Marketing Plan For Brand Campaign With Key Performance Indicators Rules PDF
The following slide exhibits email marketing brand campaign plan for customer outreach, regular updates and improving target audience experience. The key components are- company, subject, email types, types of promo, key performance indicators etc. Showcasing this set of slides titled Email Marketing Plan For Brand Campaign With Key Performance Indicators Rules PDF. The topics addressed in these templates are Company, Subject, Indicators. All the content presented in this PPT design is completely editable. Download it and make adjustments in color, background, font etc. as per your unique business setting.
Information Technology Key Performance Indicators Ppt PowerPoint Presentation Infographics Tips Cpb
Presenting this set of slides with name information technology key performance indicators ppt powerpoint presentation infographics tips cpb. This is an editable Powerpoint four stages graphic that deals with topics like information technology key performance indicators to help convey your message better graphically. This product is a premium product available for immediate download and is 100 percent editable in Powerpoint. Download this now and use it in your presentations to impress your audience.
Supply Chain Key Performance Indicators Ppt PowerPoint Presentation Gallery Slideshow Cpb
Presenting this set of slides with name supply chain key performance indicators ppt powerpoint presentation gallery slideshow cpb. This is an editable Powerpoint six stages graphic that deals with topics like supply chain key performance indicators to help convey your message better graphically. This product is a premium product available for immediate download and is 100 percent editable in Powerpoint. Download this now and use it in your presentations to impress your audience.
Key Performance Indicators Employee Evaluation Ppt PowerPoint Presentation Model Visual Aids Cpb
Presenting this set of slides with name key performance indicators employee evaluation ppt powerpoint presentation model visual aids cpb. This is an editable Powerpoint five stages graphic that deals with topics like key performance indicators employee evaluation to help convey your message better graphically. This product is a premium product available for immediate download and is 100 percent editable in Powerpoint. Download this now and use it in your presentations to impress your audience.
List Business Key Performance Indicators Ppt PowerPoint Presentation Icon Designs Download
Presenting this set of slides with name list business key performance indicators ppt powerpoint presentation icon designs download. This is an editable Powerpoint four stages graphic that deals with topics like list business key performance indicators to help convey your message better graphically. This product is a premium product available for immediate download and is 100 percent editable in Powerpoint. Download this now and use it in your presentations to impress your audience.
Measuring Innovation Key Performance Indicators Ppt PowerPoint Presentation Gallery Portfolio Cpb
Presenting this set of slides with name measuring innovation key performance indicators ppt powerpoint presentation gallery portfolio cpb. This is an editable Powerpoint four stages graphic that deals with topics like measuring innovation key performance indicators to help convey your message better graphically. This product is a premium product available for immediate download and is 100 percent editable in Powerpoint. Download this now and use it in your presentations to impress your audience.

Disaster Recovery Key Performance Indicators Ppt PowerPoint Presentation Outline Graphic Tips Cpb
Presenting this set of slides with name disaster recovery key performance indicators ppt powerpoint presentation outline graphic tips cpb. This is an editable Powerpoint three stages graphic that deals with topics like disaster recovery key performance indicators to help convey your message better graphically. This product is a premium product available for immediate download and is 100 percent editable in Powerpoint. Download this now and use it in your presentations to impress your audience.
Key Performance Indicators Examples Sales Ppt PowerPoint Presentation File Example Cpb Pdf
Presenting this set of slides with name key performance indicators examples sales ppt powerpoint presentation file example cpb pdf. This is an editable Powerpoint eight stages graphic that deals with topics like key performance indicators examples sales to help convey your message better graphically. This product is a premium product available for immediate download and is 100 percent editable in Powerpoint. Download this now and use it in your presentations to impress your audience.
Key Performance Indicators Quality Assurance Examples Ppt PowerPoint Presentation Gallery Examples Cpb Pdf
Presenting this set of slides with name key performance indicators quality assurance examples ppt powerpoint presentation gallery examples cpb pdf. This is an editable Powerpoint five stages graphic that deals with topics like key performance indicators quality assurance examples to help convey your message better graphically. This product is a premium product available for immediate download and is 100 percent editable in Powerpoint. Download this now and use it in your presentations to impress your audience.
Leader Assessing Project Score Based Key Performance Indicators Ppt PowerPoint Presentation Summary Icons PDF
Persuade your audience using this leader assessing project score based key performance indicators ppt powerpoint presentation summary icons pdf. This PPT design covers three stages, thus making it a great tool to use. It also caters to a variety of topics including leader assessing project score based key performance indicators. Download this PPT design now to present a convincing pitch that not only emphasizes the topic but also showcases your presentation skills.
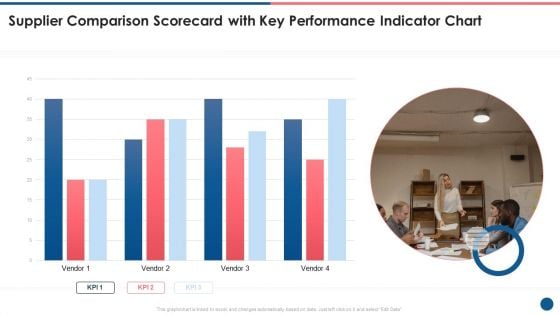
Supplier Scorecard Supplier Comparison Scorecard With Key Performance Indicator Chart Formats PDF
This is a supplier scorecard supplier comparison scorecard with key performance indicator chart formats pdf template with various stages. Focus and dispense information on one stages using this creative set, that comes with editable features. It contains large content boxes to add your information on topics like supplier comparison scorecard, key performance, indicator chart. You can also showcase facts, figures, and other relevant content using this PPT layout. Grab it now.
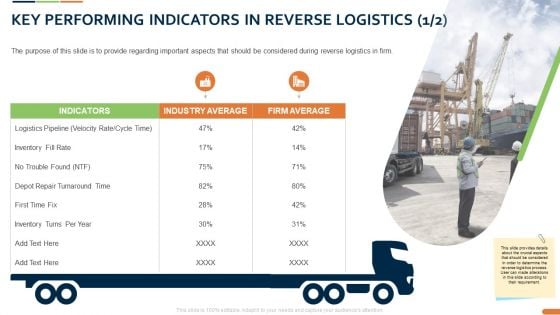
Closed Loop Supply Chain Management Key Performing Indicators In Reverse Logistics Average Ppt Infographic PDF
Presenting this set of slides with name closed loop supply chain management key performing indicators in reverse logistics average ppt infographic pdf. The topics discussed in these slides are Indicators, Industry Average, Firm Average. This is a completely editable PowerPoint presentation and is available for immediate download. Download now and impress your audience.
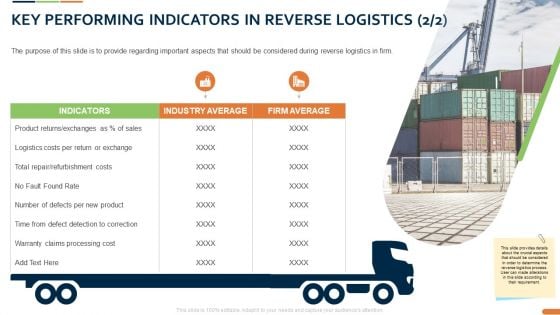
Closed Loop Supply Chain Management Key Performing Indicators In Reverse Logistics Product Ppt Summary PDF
Presenting this set of slides with name closed loop supply chain management key performing indicators in reverse logistics product ppt summary pdf. The topics discussed in these slides are Indicators, Industry Average, Firm Average. This is a completely editable PowerPoint presentation and is available for immediate download. Download now and impress your audience.
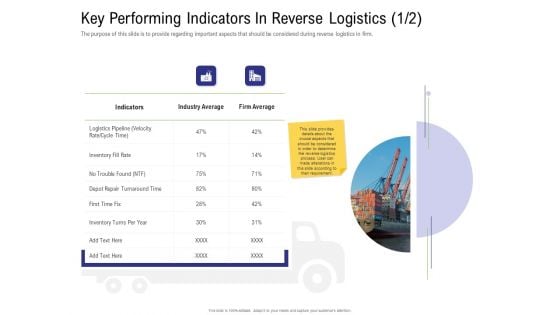
Strategy For Managing Ecommerce Returns Key Performing Indicators In Reverse Logistics Cycle Background PDF
Deliver an awe inspiring pitch with this creative strategy for managing ecommerce returns key performing indicators in reverse logistics cycle background pdf bundle. Topics like indicators, industry average, firm average, inventory can be discussed with this completely editable template. It is available for immediate download depending on the needs and requirements of the user.
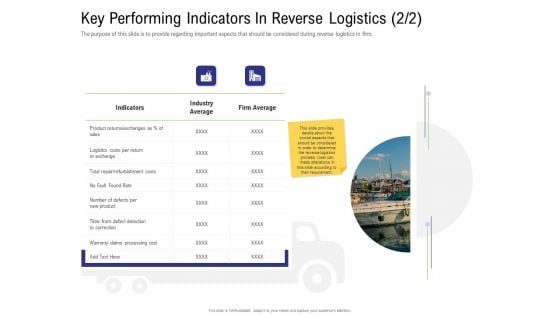
Strategy For Managing Ecommerce Returns Key Performing Indicators In Reverse Logistics Per Information PDF
Deliver and pitch your topic in the best possible manner with this strategy for managing ecommerce returns key performing indicators in reverse logistics per information pdf. Use them to share invaluable insights on indicators, industry average, firm average, inventory, logistics costs and impress your audience. This template can be altered and modified as per your expectations. So, grab it now.
Text Mining Structure Showcasing Data Analysis Icon Microsoft Pdf
Showcasing this set of slides titled Text Mining Structure Showcasing Data Analysis Icon Microsoft Pdf. The topics addressed in these templates are Text Mining Structure, Showcasing Data Analysis Icon. All the content presented in this PPT design is completely editable. Download it and make adjustments in color, background, font etc. as per your unique business setting. Our Text Mining Structure Showcasing Data Analysis Icon Microsoft Pdf are topically designed to provide an attractive backdrop to any subject. Use them to look like a presentation pro.
Data Analysis In Powerpoint And Google Slides Cpb
Presenting our innovatively designed set of slides titled Data Analysis In Powerpoint And Google Slides Cpb. This completely editable PowerPoint graphic exhibits Data Analysis that will help you convey the message impactfully. It can be accessed with Google Slides and is available in both standard screen and widescreen aspect ratios. Apart from this, you can download this well structured PowerPoint template design in different formats like PDF, JPG, and PNG. So, click the download button now to gain full access to this PPT design. Our Data Analysis In Powerpoint And Google Slides Cpb are topically designed to provide an attractive backdrop to any subject. Use them to look like a presentation pro.
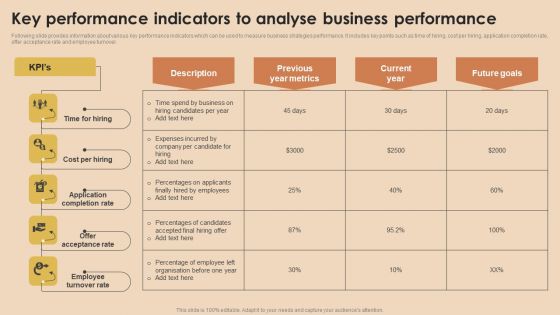
Detailed Guide For Talent Acquisition Key Performance Indicators To Analyse Mockup PDF
Following slide provides information about various key performance indicators which can be used to measure business strategies performance. It includes key points such as time of hiring, cost per hiring, application completion rate, offer acceptance rate and employee turnover. From laying roadmaps to briefing everything in detail, our templates are perfect for you. You can set the stage with your presentation slides. All you have to do is download these easy to edit and customizable templates. Detailed Guide For Talent Acquisition Key Performance Indicators To Analyse Mockup PDF will help you deliver an outstanding performance that everyone would remember and praise you for. Do download this presentation today.
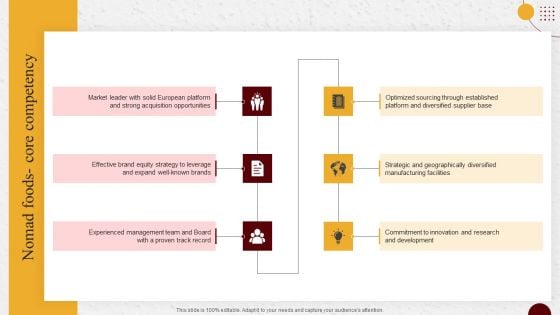
Industry Report Of Packaged Food Products Part 2 Nomad Foods Core Competency Clipart PDF
The Industry Report Of Packaged Food Products Part 2 Nomad Foods Core Competency Clipart PDF is a compilation of the most recent design trends as a series of slides. It is suitable for any subject or industry presentation, containing attractive visuals and photo spots for businesses to clearly express their messages. This template contains a variety of slides for the user to input data, such as structures to contrast two elements, bullet points, and slides for written information. Slidegeeks is prepared to create an impression.

Submission Of Project Viability Report For Bank Loan Table Of Contents Elements PDF
Purpose of this slide is to address staffing strategy matrix. Here each strategy is identified as either directly applicable to a specific work type or indirectly applicable. The Submission Of Project Viability Report For Bank Loan Table Of Contents Elements PDF is a compilation of the most recent design trends as a series of slides. It is suitable for any subject or industry presentation, containing attractive visuals and photo spots for businesses to clearly express their messages. This template contains a variety of slides for the user to input data, such as structures to contrast two elements, bullet points, and slides for written information. Slidegeeks is prepared to create an impression.
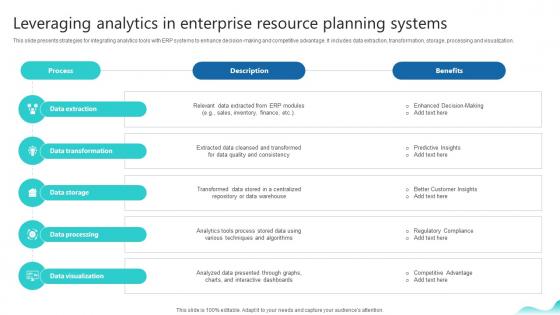
Leveraging Analytics In Enterprise Resource Planning Erp And Digital Transformation For Maximizing DT SS V
This slide presents strategies for integrating analytics tools with ERP systems to enhance decision-making and competitive advantage. It includes data extraction, transformation, storage, processing and visualization.Are you in need of a template that can accommodate all of your creative concepts This one is crafted professionally and can be altered to fit any style. Use it with Google Slides or PowerPoint. Include striking photographs, symbols, depictions, and other visuals. Fill, move around, or remove text boxes as desired. Test out color palettes and font mixtures. Edit and save your work, or work with colleagues. Download Leveraging Analytics In Enterprise Resource Planning Erp And Digital Transformation For Maximizing DT SS V and observe how to make your presentation outstanding. Give an impeccable presentation to your group and make your presentation unforgettable. This slide presents strategies for integrating analytics tools with ERP systems to enhance decision-making and competitive advantage. It includes data extraction, transformation, storage, processing and visualization.
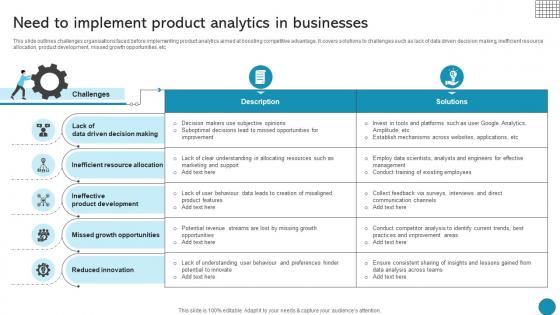
Need To Implement Product Analytics In Businesses Driving Business Success Integrating Product
This slide outlines challenges organisations faced before implementing product analytics aimed at boosting competitive advantage. It covers solutions to challenges such as lack of data driven decision making, inefficient resource allocation, product development, missed growth opportunities, etc Want to ace your presentation in front of a live audience Our Need To Implement Product Analytics In Businesses Driving Business Success Integrating Product can help you do that by engaging all the users towards you. Slidegeeks experts have put their efforts and expertise into creating these impeccable powerpoint presentations so that you can communicate your ideas clearly. Moreover, all the templates are customizable, and easy-to-edit and downloadable. Use these for both personal and commercial use. This slide outlines challenges organisations faced before implementing product analytics aimed at boosting competitive advantage. It covers solutions to challenges such as lack of data driven decision making, inefficient resource allocation, product development, missed growth opportunities, etc
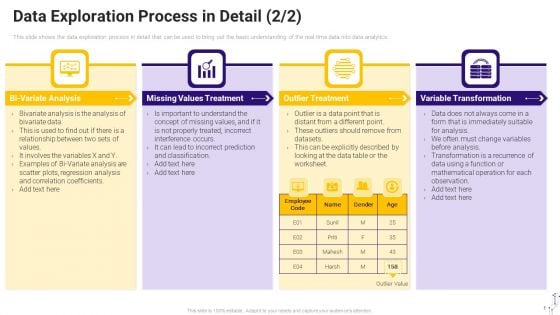
Effective Data Arrangement For Data Accessibility And Processing Readiness Data Exploration Process In Detail Analysis Ideas PDF
This slide shows the data exploration process in detail that can be used to bring out the basic understanding of the real time data into data analytics. This is a effective data arrangement for data accessibility and processing readiness data exploration process in detail analysis ideas pdf template with various stages. Focus and dispense information on four stages using this creative set, that comes with editable features. It contains large content boxes to add your information on topics like treatment, outlier treatment, variable transformation. You can also showcase facts, figures, and other relevant content using this PPT layout. Grab it now.
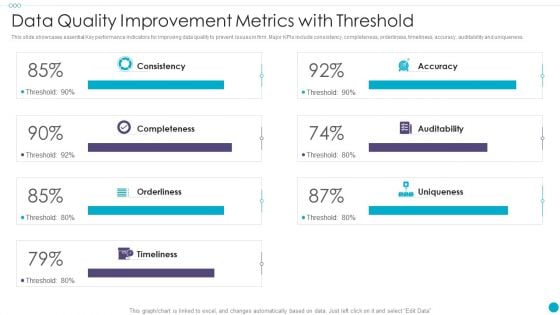
Data Quality Improvement Metrics With Threshold Formats PDF
This slide showcases essential Key performance indicators for improving data quality to prevent issues in firm. Major KPIs include consistency, completeness, orderliness, timeliness, accuracy, auditability and uniqueness. Pitch your topic with ease and precision using this Data Quality Improvement Metrics With Threshold Formats PDF This layout presents information on Auditability, Completeness, Consistency It is also available for immediate download and adjustment. So, changes can be made in the color, design, graphics or any other component to create a unique layout.

Predictive Analytics For Empowering Roadmap For Predictive Analytics Model Inspiration Pdf
This slide represents the roadmap for predictive analytics model development, including the steps to be performed in the process, such as highlighting and formulating a problem, data preparation, information exploration, transforming and choosing, making, validating, and so on. Do you know about Slidesgeeks Predictive Analytics For Empowering Roadmap For Predictive Analytics Model Inspiration Pdf These are perfect for delivering any kind od presentation. Using it, create PowerPoint presentations that communicate your ideas and engage audiences. Save time and effort by using our pre-designed presentation templates that are perfect for a wide range of topic. Our vast selection of designs covers a range of styles, from creative to business, and are all highly customizable and easy to edit. Download as a PowerPoint template or use them as Google Slides themes. This slide represents the roadmap for predictive analytics model development, including the steps to be performed in the process, such as highlighting and formulating a problem, data preparation, information exploration, transforming and choosing, making, validating, and so on.

Market Research Study Template Ppt Sample
This is a market research study template ppt sample. This is a four stage process. The stages in this process are market size estimation, market crack down and data triangulation, market forecast model, key data points.
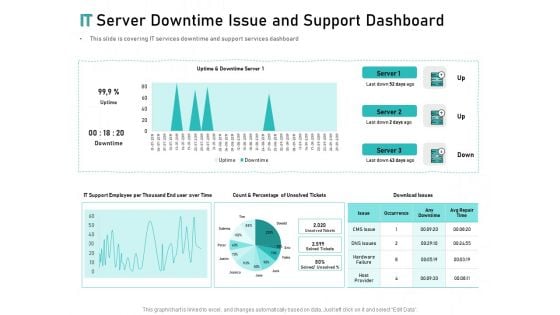
Tech Support Services Cost And Pricing IT Server Downtime Issue And Support Dashboard Ppt PowerPoint Presentation Summary Inspiration
Presenting this set of slides with name tech support services cost and pricing it server downtime issue and support dashboard ppt powerpoint presentation summary inspiration. The topics discussed in these slide is it server downtime issue and support dashboard. This is a completely editable PowerPoint presentation and is available for immediate download. Download now and impress your audience.
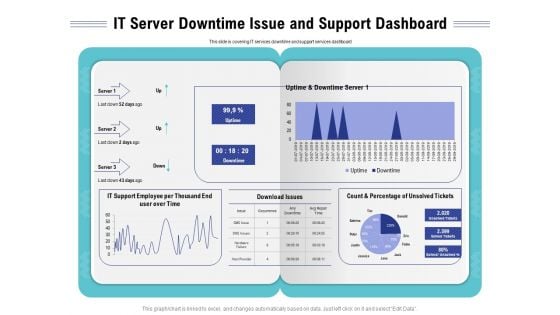
Cloud Managed Services Pricing Guide IT Server Downtime Issue And Support Dashboard Ppt Portfolio Infographic Template PDF
Presenting this set of slides with name cloud managed services pricing guide it server downtime issue and support dashboard ppt portfolio infographic template pdf. The topics discussed in these slide is it server downtime issue and support dashboard. This is a completely editable PowerPoint presentation and is available for immediate download. Download now and impress your audience.
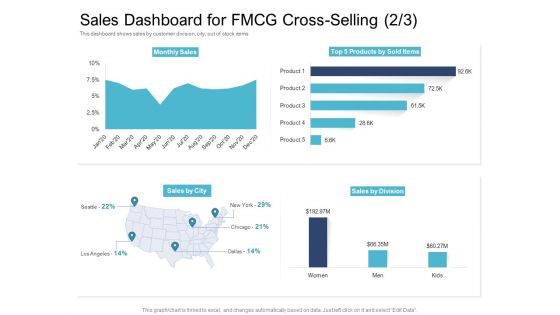
Cross Selling Initiatives For Online And Offline Store Sales Dashboard For FMCG Cross Selling Sales Elements PDF
Deliver an awe inspiring pitch with this creative cross selling initiatives for online and offline store sales dashboard for fmcg cross selling sales elements pdf bundle. Topics like sales dashboard for fmcg cross selling can be discussed with this completely editable template. It is available for immediate download depending on the needs and requirements of the user.
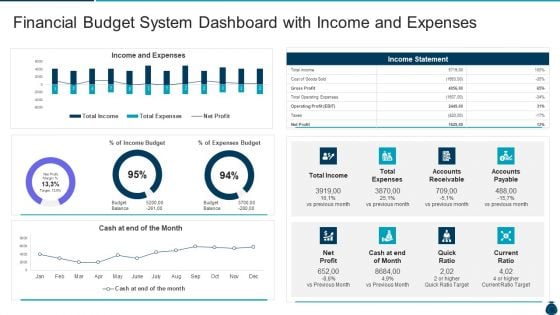
Key Elements And Techniques Of A Budgeting System Financial Budget System Dashboard With Income And Expenses Rules PDF
Deliver an awe inspiring pitch with this creative key elements and techniques of a budgeting system financial budget system dashboard with income and expenses rules pdf bundle. Topics like financial budget system dashboard with income and expenses can be discussed with this completely editable template. It is available for immediate download depending on the needs and requirements of the user.
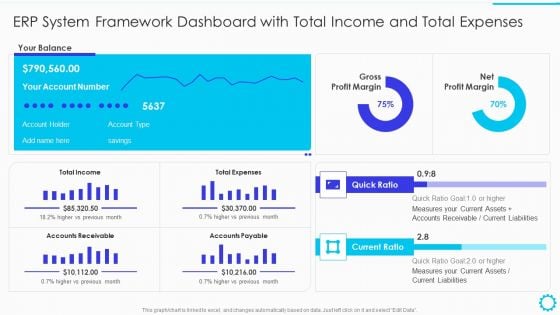
Summary Of Cloud ERP System Framework ERP System Framework Dashboard With Total Income And Total Expenses Guidelines PDF
Deliver an awe inspiring pitch with this creative Summary Of Cloud ERP System Framework ERP System Framework Dashboard With Total Income And Total Expenses Guidelines PDF bundle. Topics like ERP System Framework Dashboard With Total Income And Total Expenses can be discussed with this completely editable template. It is available for immediate download depending on the needs and requirements of the user.
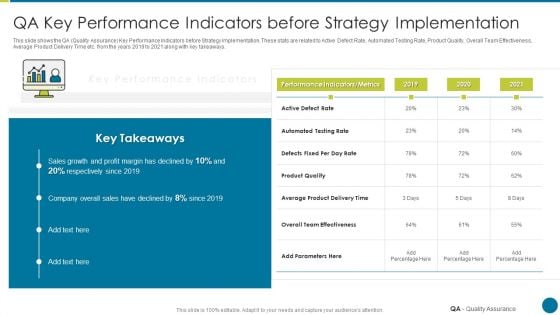
QA Modification For Product Quality Development And Consumer Satisfaction QA Key Performance Indicators Infographics PDF
This slide shows the QA Quality Assurance Key Performance Indicators before Strategy Implementation. These stats are related to Active Defect Rate, Automated Testing Rate, Product Quality, Overall Team Effectiveness, Average Product Delivery Time etc. from the years 2019 to 2021 along with key takeaways. Deliver an awe inspiring pitch with this creative qa modification for product quality development and consumer satisfaction qa key performance indicators infographics pdf bundle. Topics like overall team effectiveness, product quality, performance, product quality can be discussed with this completely editable template. It is available for immediate download depending on the needs and requirements of the user.
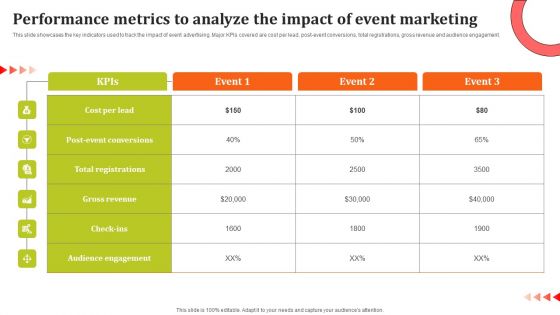
Performance Metrics To Analyze The Impact Of Event Marketing Ppt Model Layouts PDF
This slide showcases the key indicators used to track the impact of event advertising. Major KPIs covered are cost per lead, post-event conversions, total registrations, gross revenue and audience engagement. This modern and well arranged Performance Metrics To Analyze The Impact Of Event Marketing Ppt Model Layouts PDF provides lots of creative possibilities. It is very simple to customize and edit with the Powerpoint Software. Just drag and drop your pictures into the shapes. All facets of this template can be edited with Powerpoint no extra software is necessary. Add your own material, put your images in the places assigned for them, adjust the colors, and then you can show your slides to the world, with an animated slide included.

Information Studies Phases Of Data Science Operationalize Pictures PDF
This slide describes the operational phase of data science and what tasks are performed in this phase, such as deliver final reports, pilot project implementation, and how it will be helpful in monitoring performance. This is a Information Studies Phases Of Data Science Operationalize Pictures PDF template with various stages. Focus and dispense information on three stages using this creative set, that comes with editable features. It contains large content boxes to add your information on topics like Technical Documents, Implemented, Production Platform. You can also showcase facts, figures, and other relevant content using this PPT layout. Grab it now.
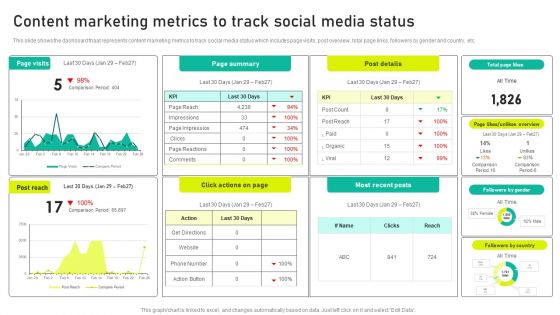
Content Marketing Metrics To Track Social Media Status Ppt Pictures Show PDF
This slide shows the dashboard thaat represents content marketing metrics to track social media status which includes page visits, post overview, total page links, followers by gender and country, etc. Formulating a presentation can take up a lot of effort and time, so the content and message should always be the primary focus. The visuals of the PowerPoint can enhance the presenters message, so our Content Marketing Metrics To Track Social Media Status Ppt Pictures Show PDF was created to help save time. Instead of worrying about the design, the presenter can concentrate on the message while our designers work on creating the ideal templates for whatever situation is needed. Slidegeeks has experts for everything from amazing designs to valuable content, we have put everything into Content Marketing Metrics To Track Social Media Status Ppt Pictures Show PDF.
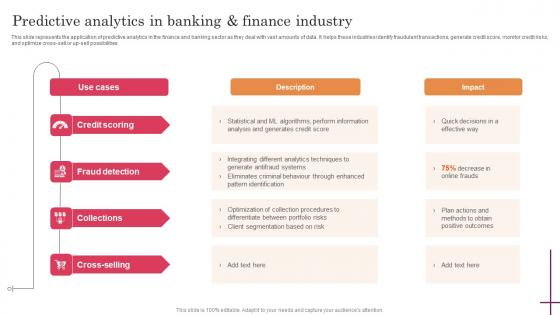
Predictive Analytics In Banking And Finance Industry Predictive Analytics For Improved Structure Pdf
This slide represents the application of predictive analytics in the finance and banking sector as they deal with vast amounts of data. It helps these industries identify fraudulent transactions, generate credit score, monitor credit risks, and optimize cross-sell or up-sell possibilities. Explore a selection of the finest Predictive Analytics In Banking And Finance Industry Predictive Analytics For Improved Structure Pdf here. With a plethora of professionally designed and pre-made slide templates, you can quickly and easily find the right one for your upcoming presentation. You can use our Predictive Analytics In Banking And Finance Industry Predictive Analytics For Improved Structure Pdf to effectively convey your message to a wider audience. Slidegeeks has done a lot of research before preparing these presentation templates. The content can be personalized and the slides are highly editable. Grab templates today from Slidegeeks. This slide represents the application of predictive analytics in the finance and banking sector as they deal with vast amounts of data. It helps these industries identify fraudulent transactions, generate credit score, monitor credit risks, and optimize cross-sell or up-sell possibilities.
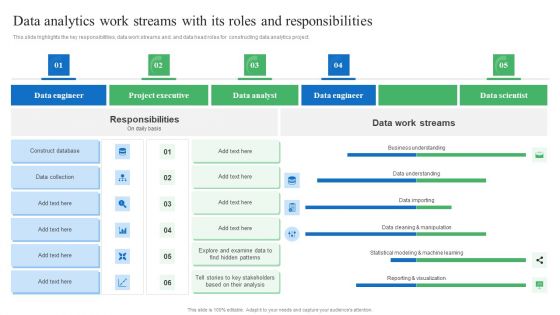
Data Analytics Work Streams With Its Roles And Responsibilities Rules PDF
This slide highlights the key responsibilities, data work streams and. and data head roles for constructing data analytics project. Here you can discover an assortment of the finest PowerPoint and Google Slides templates. With these templates, you can create presentations for a variety of purposes while simultaneously providing your audience with an eye catching visual experience. Download Data Analytics Work Streams With Its Roles And Responsibilities Rules PDF to deliver an impeccable presentation. These templates will make your job of preparing presentations much quicker, yet still, maintain a high level of quality. Slidegeeks has experienced researchers who prepare these templates and write high quality content for you. Later on, you can personalize the content by editing the Data Analytics Work Streams With Its Roles And Responsibilities Rules PDF.
Actual Time Transaction Monitoring Software And Strategies TMS And Data Analytics Process Flow Icons PDF
This slide represents transaction monitoring system process flow. It provides information about data analytics, risk framework, alerting, ad hoc analysis, case management, external source entrance, stop list, politically exposed persons PEP, watch list, etc. There are so many reasons you need a Actual Time Transaction Monitoring Software And Strategies TMS And Data Analytics Process Flow Icons PDF. The first reason is you can not spend time making everything from scratch, Thus, Slidegeeks has made presentation templates for you too. You can easily download these templates from our website easily.
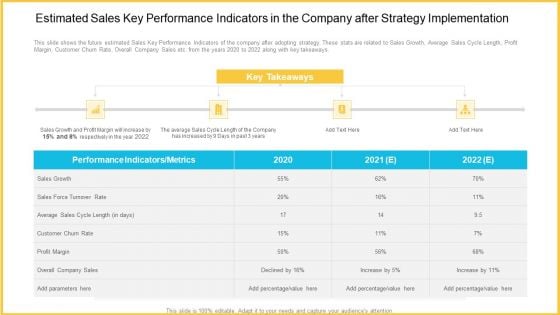
Estimated Sales Key Performance Indicators In The Company After Strategy Implementation Diagrams PDF
This slide shows the future estimated Sales Key Performance Indicators of the company after adopting strategy. These stats are related to Sales Growth, Average Sales Cycle Length, Profit Margin, Customer Churn Rate, Overall Company Sales etc. from the years 2020 to 2022 along with key takeaways. Deliver an awe-inspiring pitch with this creative estimated sales key performance indicators in the company after strategy implementation diagrams pdf. bundle. Topics like sales growth, sales force turnover rate, customer churn rate, profit margin, overall company sales can be discussed with this completely editable template. It is available for immediate download depending on the needs and requirements of the user.
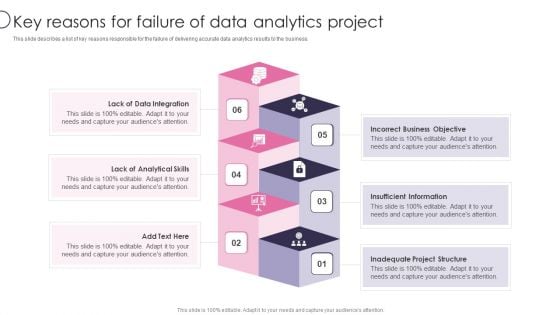
Information Transformation Process Toolkit Key Reasons For Failure Of Data Analytics Project Portrait PDF
This slide describes a list of key reasons responsible for the failure of delivering accurate data analytics results to the business. Deliver an awe inspiring pitch with this creative Information Transformation Process Toolkit Key Reasons For Failure Of Data Analytics Project Portrait PDF bundle. Topics like Incorrect Business Objective, Insufficient Information, Inadequate Project Structure can be discussed with this completely editable template. It is available for immediate download depending on the needs and requirements of the user.
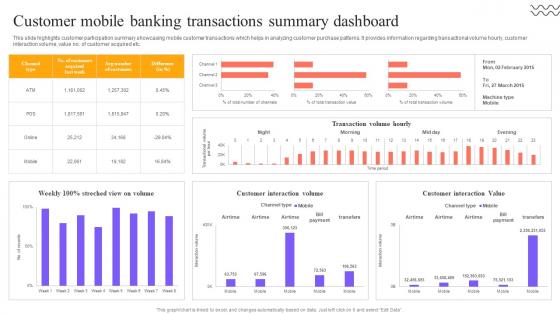
Digital Approach To Client Customer Mobile Banking Transactions Summary Dashboard
This slide highlights customer participation summary showcasing mobile customer transactions which helps in analyzing customer purchase patterns. It provides information regarding transactional volume hourly, customer interaction volume, value no. of customer acquired etc. Formulating a presentation can take up a lot of effort and time, so the content and message should always be the primary focus. The visuals of the PowerPoint can enhance the presenters message, so our Digital Approach To Client Customer Mobile Banking Transactions Summary Dashboard was created to help save time. Instead of worrying about the design, the presenter can concentrate on the message while our designers work on creating the ideal templates for whatever situation is needed. Slidegeeks has experts for everything from amazing designs to valuable content, we have put everything into Digital Approach To Client Customer Mobile Banking Transactions Summary Dashboard. This slide highlights customer participation summary showcasing mobile customer transactions which helps in analyzing customer purchase patterns. It provides information regarding transactional volume hourly, customer interaction volume, value no. of customer acquired etc.
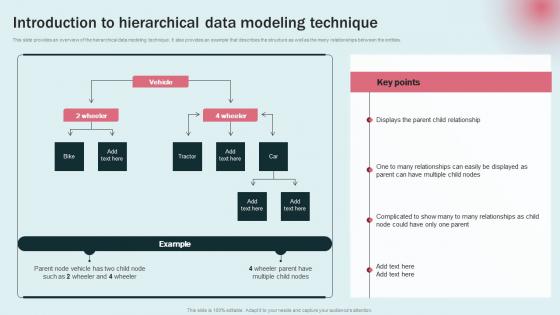
Introduction To Hierarchical Data Modeling Approaches For Modern Analytics Portrait Pdf
This slide provides an overview of the hierarchical data modeling technique. It also provides an example that describes the structure as well as the many relationships between the entities. Formulating a presentation can take up a lot of effort and time, so the content and message should always be the primary focus. The visuals of the PowerPoint can enhance the presenters message, so our Introduction To Hierarchical Data Modeling Approaches For Modern Analytics Portrait Pdf was created to help save time. Instead of worrying about the design, the presenter can concentrate on the message while our designers work on creating the ideal templates for whatever situation is needed. Slidegeeks has experts for everything from amazing designs to valuable content, we have put everything into Introduction To Hierarchical Data Modeling Approaches For Modern Analytics Portrait Pdf This slide provides an overview of the hierarchical data modeling technique. It also provides an example that describes the structure as well as the many relationships between the entities.
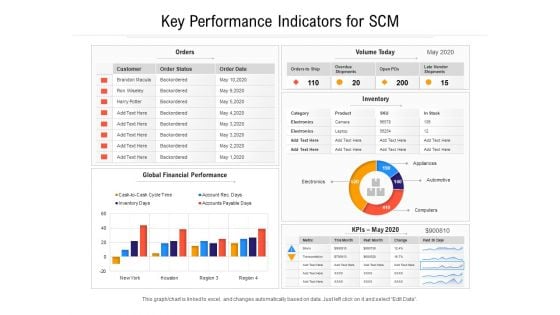
Key Performance Indicators For SCM Ppt PowerPoint Presentation File Graphic Tips PDF
Presenting this set of slides with name key performance indicators for scm ppt powerpoint presentation file graphic tips pdf. The topics discussed in these slides are global, financial, perform. This is a completely editable PowerPoint presentation and is available for immediate download. Download now and impress your audience.
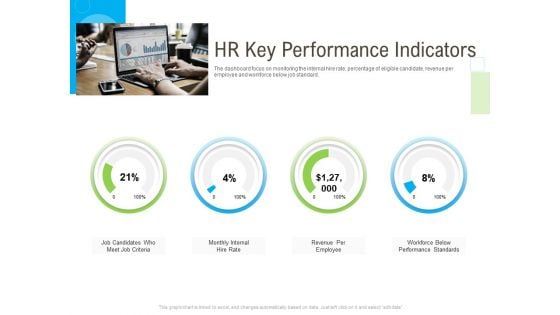
Rapid Innovation In HR Technology Space HR Key Performance Indicators Slides PDF
Deliver an awe inspiring pitch with this creative rapid innovation in hr technology space hr key performance indicators slides pdf bundle. Topics like criteria, workforce, performance, revenue, internal can be discussed with this completely editable template. It is available for immediate download depending on the needs and requirements of the user.

Partnership Marketing Plan With Key Performance Indicators Ppt PowerPoint Presentation File Rules PDF
Pitch your topic with ease and precision using this partnership marketing plan with key performance indicators ppt powerpoint presentation file rules pdf. This layout presents information on performance, goals, initiatives. It is also available for immediate download and adjustment. So, changes can be made in the color, design, graphics or any other component to create a unique layout.
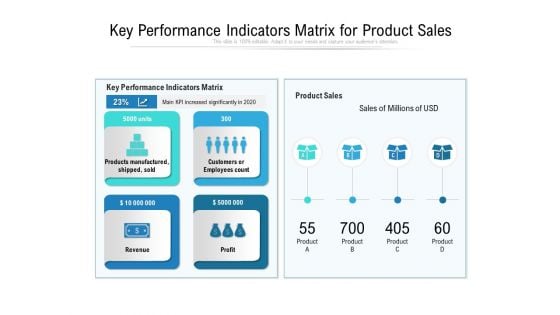
Key Performance Indicators Matrix For Product Sales Ppt PowerPoint Presentation File Clipart PDF
Presenting key performance indicators matrix for product sales ppt powerpoint presentation file clipart pdf to dispense important information. This template comprises four stages. It also presents valuable insights into the topics including manufactured, revenue, performance. This is a completely customizable PowerPoint theme that can be put to use immediately. So, download it and address the topic impactfully.
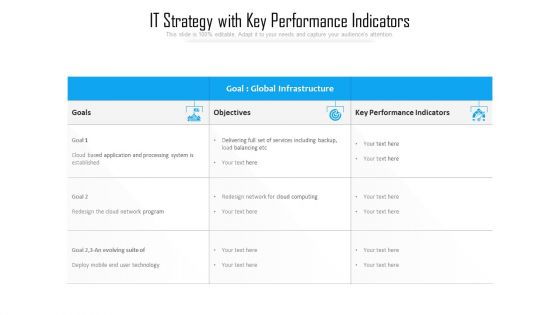
IT Strategy With Key Performance Indicators Ppt PowerPoint Presentation Gallery Example Introduction PDF
Pitch your topic with ease and precision using this it strategy with key performance indicators ppt powerpoint presentation gallery example introduction pdf. This layout presents information on goals, objectives, performance. It is also available for immediate download and adjustment. So, changes can be made in the color, design, graphics or any other component to create a unique layout.

Data Analytics System Model To Make Decisions Ppt PowerPoint Presentation Summary Graphics PDF
Showcasing this set of slides titled data analytics system model to make decisions ppt powerpoint presentation summary graphics pdf. The topics addressed in these templates are collect data, analyze make decisions, communicate. All the content presented in this PPT design is completely editable. Download it and make adjustments in color, background, font etc. as per your unique business setting.
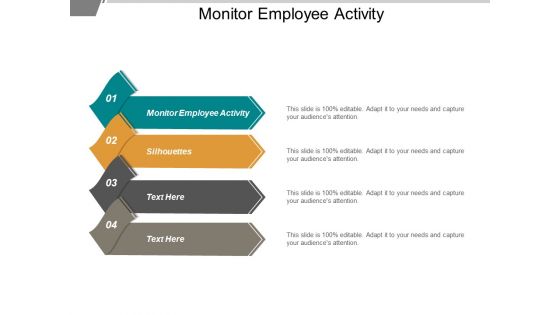
Monitor Employee Activity Ppt PowerPoint Presentation Layouts Samples
This is a monitor employee activity ppt powerpoint presentation layouts samples. This is a four stage process. The stages in this process are monitor employee activity.
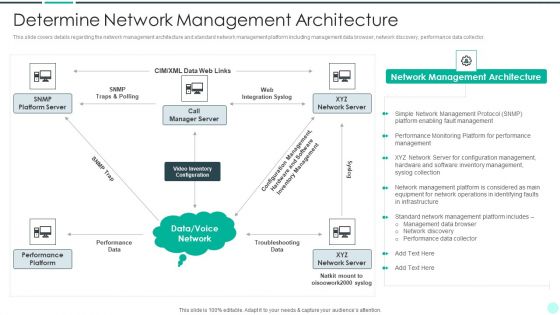
Executing Advance Data Analytics At Workspace Determine Network Management Architecture Graphics PDF
This slide covers details regarding the network management architecture and standard network management platform including management data browser, network discovery, performance data collector. Deliver an awe inspiring pitch with this creative executing advance data analytics at workspace determine network management architecture graphics pdf bundle. Topics like determine network management architecture can be discussed with this completely editable template. It is available for immediate download depending on the needs and requirements of the user.
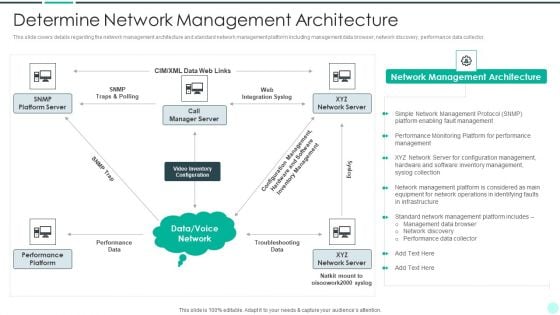
Executing Advance Data Analytics At Workspace Determine Network Management Architecture Brochure PDF
This slide covers details regarding the network management architecture and standard network management platform including management data browser, network discovery, performance data collector. Deliver an awe inspiring pitch with this creative executing advance data analytics at workspace determine network management architecture brochure pdf bundle. Topics like determine network management architecture can be discussed with this completely editable template. It is available for immediate download depending on the needs and requirements of the user.
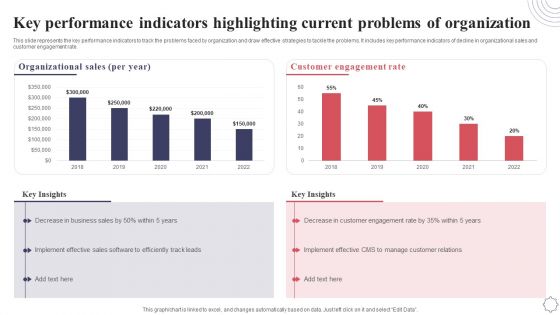
Key Performance Indicators Highlighting Current Problems Of Organization Application Deployment Project Plan Rules PDF
This slide represents the key performance indicators to track the problems faced by organization and draw effective strategies to tackle the problems. It includes key performance indicators of decline in organizational sales and customer engagement rate. Coming up with a presentation necessitates that the majority of the effort goes into the content and the message you intend to convey. The visuals of a PowerPoint presentation can only be effective if it supplements and supports the story that is being told. Keeping this in mind our experts created Key Performance Indicators Highlighting Current Problems Of Organization Application Deployment Project Plan Rules PDF to reduce the time that goes into designing the presentation. This way, you can concentrate on the message while our designers take care of providing you with the right template for the situation.
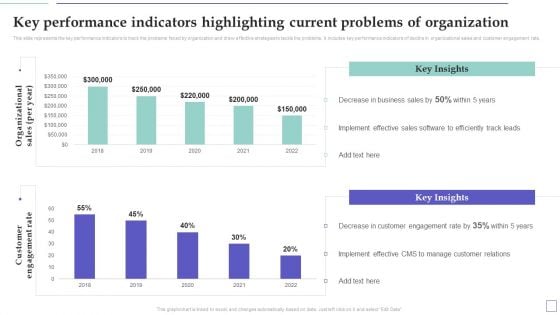
System Deployment Project Key Performance Indicators Highlighting Current Problems Information PDF
This slide represents the key performance indicators to track the problems faced by organization and draw effective strategies to tackle the problems. It includes key performance indicators of decline in organizational sales and customer engagement rate. Coming up with a presentation necessitates that the majority of the effort goes into the content and the message you intend to convey. The visuals of a PowerPoint presentation can only be effective if it supplements and supports the story that is being told. Keeping this in mind our experts created System Deployment Project Key Performance Indicators Highlighting Current Problems Information PDF to reduce the time that goes into designing the presentation. This way, you can concentrate on the message while our designers take care of providing you with the right template for the situation.

Strategic Plan For Enterprise Key Performance Indicators Highlighting Current Problems Diagrams PDF
This slide represents the key performance indicators to track the problems faced by organization and draw effective strategies to tackle the problems. It includes key performance indicators of decline in organizational sales and customer engagement rate. Coming up with a presentation necessitates that the majority of the effort goes into the content and the message you intend to convey. The visuals of a PowerPoint presentation can only be effective if it supplements and supports the story that is being told. Keeping this in mind our experts created Strategic Plan For Enterprise Key Performance Indicators Highlighting Current Problems Diagrams PDF to reduce the time that goes into designing the presentation. This way, you can concentrate on the message while our designers take care of providing you with the right template for the situation.

Net Promoter Score Data Analysis Ppt Powerpoint Slides
This is a net promoter score data analysis ppt powerpoint slides. This is a ten stage process. The stages in this process are very willing, neutral, not at all willing, promoters, passives, detractors, net promoter score, percentage promoters, minus, percentage detractors.
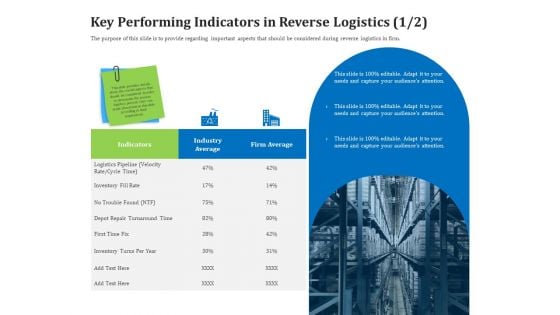
Reverse Logistics Management Key Performing Indicators In Reverse Logistics Cycle Ppt Slides Good PDF
The purpose of this slide is to provide regarding important aspects that should be considered during reverse logistics in firm. Deliver an awe inspiring pitch with this creative reverse logistics management key performing indicators in reverse logistics cycle ppt slides good pdf bundle. Topics like indicators, industry average, firm average, inventory can be discussed with this completely editable template. It is available for immediate download depending on the needs and requirements of the user.
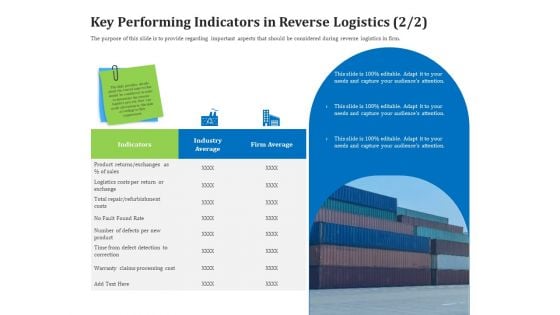
Reverse Logistics Management Key Performing Indicators In Reverse Logistics Per Ppt Styles Templates PDF
The purpose of this slide is to provide regarding important aspects that should be considered during reverse logistics in firm. Deliver and pitch your topic in the best possible manner with this reverse logistics management key performing indicators in reverse logistics per ppt styles templates pdf. Use them to share invaluable insights on indicators, industry average, firm average, inventory, logistics costs and impress your audience. This template can be altered and modified as per your expectations. So, grab it now.
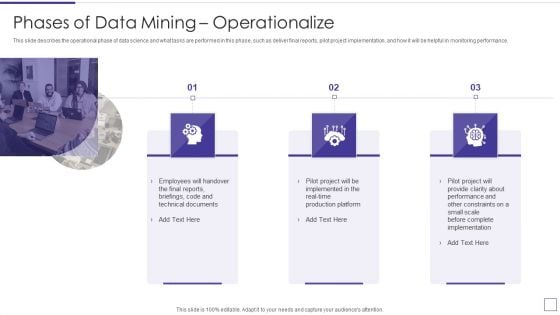
Data Mining Implementation Phases Of Data Mining Operationalize Professional PDF
This slide describes the operational phase of data science and what tasks are performed in this phase, such as deliver final reports, pilot project implementation, and how it will be helpful in monitoring performance.Presenting data mining implementation phases of data mining operationalize professional pdf to provide visual cues and insights. Share and navigate important information on three stages that need your due attention. This template can be used to pitch topics like employees will handover, technical documents, complete implementation In addtion, this PPT design contains high resolution images, graphics, etc, that are easily editable and available for immediate download.
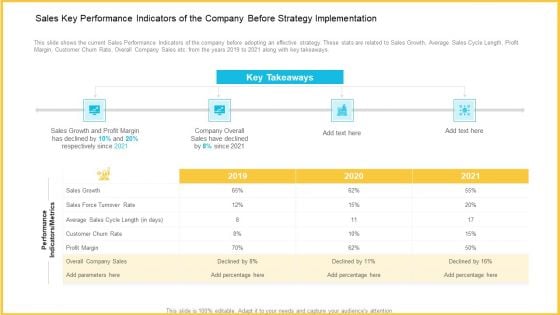
Sales Key Performance Indicators Of The Company Before Strategy Implementation Inspiration PDF
This slide shows the current Sales Performance Indicators of the company before adopting an effective strategy. These stats are related to Sales Growth, Average Sales Cycle Length, Profit Margin, Customer Churn Rate, Overall Company Sales etc. from the years 2019 to 2021 along with key takeaways. Deliver an awe-inspiring pitch with this creative sales key performance indicators of the company before strategy implementation inspiration pdf. bundle. Topics like sales growth, sales force turnover rate, customer churn rate, profit margin, overall company sales can be discussed with this completely editable template. It is available for immediate download depending on the needs and requirements of the user.


 Continue with Email

 Home
Home


