Snapshot
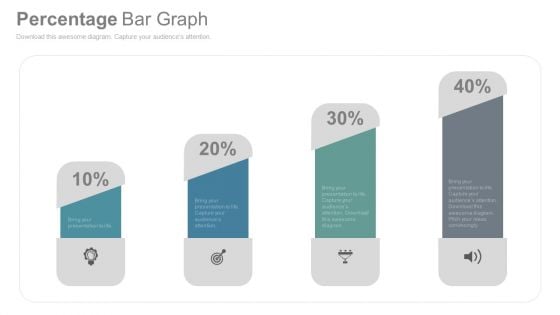
Bar Graph To Compare Business Data PowerPoint Slides
This is the slide which can solve many purposes of yours. Be it growth in your company, need to show your company?s status in the market as compared to others, or how your business has improved so far. An ideal PowerPoint template to display all of these. You can easily use this graph to show the growth of your company using the percentage icons. You can use this visual to show the status of your company in the market in comparison with others. You can edit the icons and replace them with the logo of your company and the others. You can also show it to your colleagues how your company has built its image in the market or how it has improved over the time. A perfect bar graph image which needs to be included in your business PPT presentations.
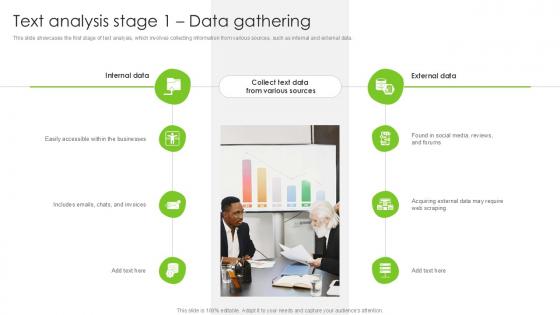
Text Analysis Stage 1 Data Gathering PPT Slide SS
This slide showcases the first stage of text analysis, which involves collecting information from various sources, such as internal and external data. Are you searching for a Text Analysis Stage 1 Data Gathering PPT Slide SS that is uncluttered, straightforward, and original Its easy to edit, and you can change the colors to suit your personal or business branding. For a presentation that expresses how much effort you have put in, this template is ideal With all of its features, including tables, diagrams, statistics, and lists, its perfect for a business plan presentation. Make your ideas more appealing with these professional slides. Download Text Analysis Stage 1 Data Gathering PPT Slide SS from Slidegeeks today. This slide showcases the first stage of text analysis, which involves collecting information from various sources, such as internal and external data.
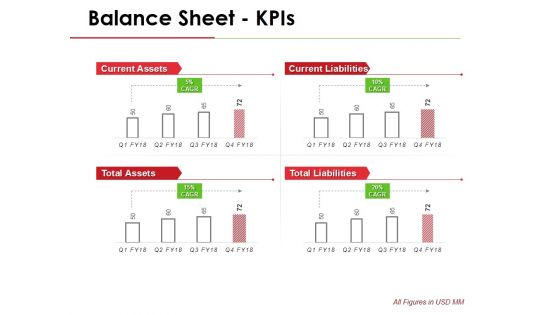
Balance Sheet Kpis Template 1 Ppt PowerPoint Presentation Layouts Design Ideas
This is a balance sheet kpis template 1 ppt powerpoint presentation layouts design ideas. This is a four stage process. The stages in this process are current assets, current liabilities, total assets, total liabilities.
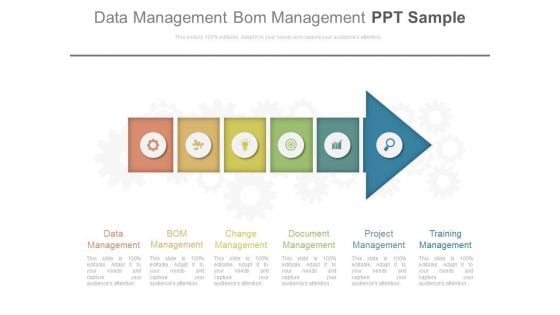
Data Management Bom Management Ppt Sample
This is a data management bom management ppt sample. This is a six stage process. The stages in this process are arrows, business, marketing.
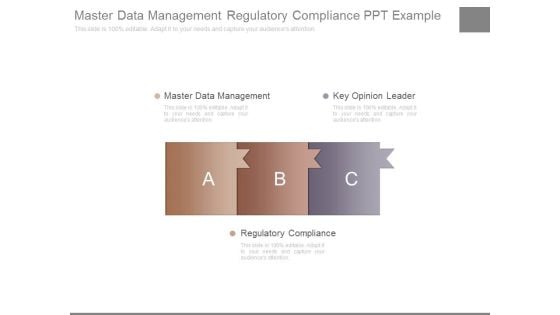
Master Data Management Regulatory Compliance Ppt Example
This is a master data management regulatory compliance ppt example. This is a three stage process. The stages in this process are business, marketing.
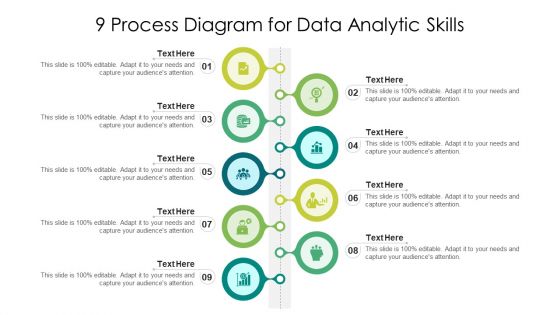
9 Process Diagram For Data Analytic Skills Ppt PowerPoint Presentation Ideas PDF
Persuade your audience using this 9 process diagram for data analytic skills ppt powerpoint presentation ideas pdf. This PPT design covers nine stages, thus making it a great tool to use. It also caters to a variety of topics including 9 process diagram for data analytic skills. Download this PPT design now to present a convincing pitch that not only emphasizes the topic but also showcases your presentation skills.
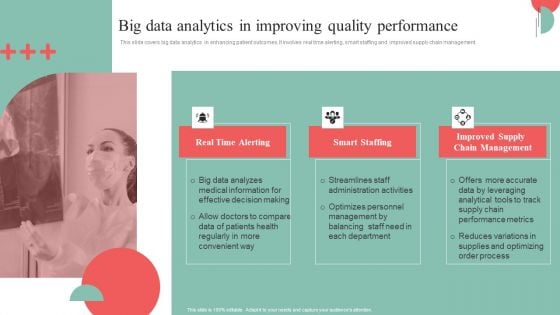
Incorporating HIS To Enhance Healthcare Services Big Data Analytics In Improving Quality Performance Microsoft PDF
This slide covers big data analytics in enhancing patient outcomes. It involves real time alerting, smart staffing and improved supply chain management. There are so many reasons you need a Incorporating HIS To Enhance Healthcare Services Big Data Analytics In Improving Quality Performance Microsoft PDF. The first reason is you cannot spend time making everything from scratch, Thus, Slidegeeks has made presentation templates for you too. You can easily download these templates from our website easily.
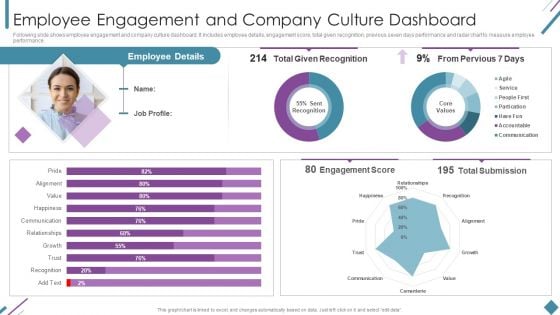
Metrics To Measure Business Performance Employee Engagement And Company Culture Demonstration PDF
Following slide shows employee engagement and company culture dashboard. It includes employee details, engagement score, total given recognition, previous seven days performance and radar chart to measure employee performance. Deliver and pitch your topic in the best possible manner with this Metrics To Measure Business Performance Employee Engagement And Company Culture Demonstration PDF. Use them to share invaluable insights on Employee Details, Total Given Recognition, Engagement Score and impress your audience. This template can be altered and modified as per your expectations. So, grab it now.
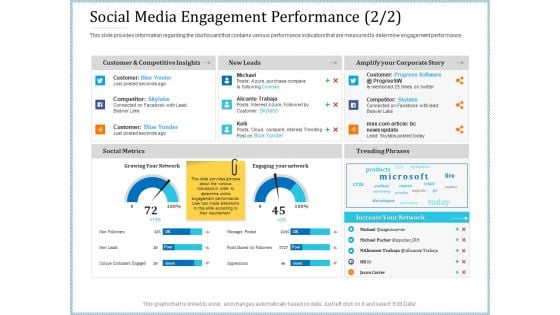
Leveraged Client Engagement Social Media Engagement Performance Leads Sample PDF
This slide provides information regarding the dashboard that contains various performance indicators that are measured to determine engagement performance. Deliver and pitch your topic in the best possible manner with this leveraged client engagement social media engagement performance leads sample pdf. Use them to share invaluable insights on performance, analysis, growing, social metrics and impress your audience. This template can be altered and modified as per your expectations. So, grab it now.
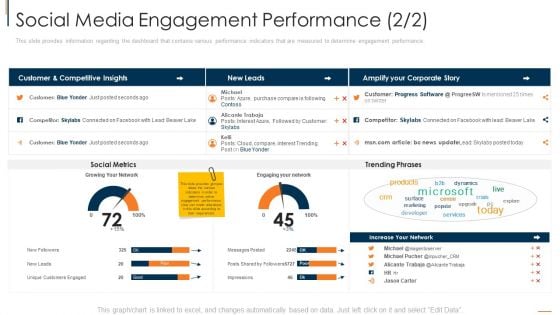
Social Media Engagement Performance Network Introduction PDF
This slide provides information regarding the dashboard that contains various performance indicators that are measured to determine engagement performance. Deliver an awe inspiring pitch with this creative social media engagement performance network introduction pdf bundle. Topics like purchase, social metrics, network, customers can be discussed with this completely editable template. It is available for immediate download depending on the needs and requirements of the user.
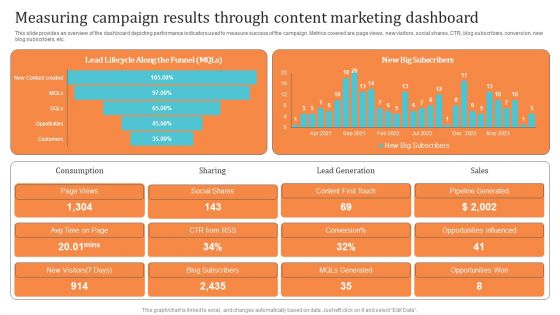
Content Advertising Campaign Measuring Campaign Results Background PDF
This slide provides an overview of the dashboard depicting performance indicators used to measure success of the campaign. Metrics covered are page views, new visitors, social shares, CTR, blog subscribers, conversion, new blog subscribers, etc. There are so many reasons you need a Content Advertising Campaign Measuring Campaign Results Background PDF. The first reason is you cannot spend time making everything from scratch, Thus, Slidegeeks has made presentation templates for you too. You can easily download these templates from our website easily.

Performance Analysis Of Corrective Regression Testing Ppt Sample
The purpose of this slide is to indicate the performance analysis of the organizations current security infrastructure. The key components include where we are, the gap, where we want to be, and recommended solutions. Slidegeeks is one of the best resources for PowerPoint templates. You can download easily and regulate Performance Analysis Of Corrective Regression Testing Ppt Sample for your personal presentations from our wonderful collection. A few clicks is all it takes to discover and get the most relevant and appropriate templates. Use our Templates to add a unique zing and appeal to your presentation and meetings. All the slides are easy to edit and you can use them even for advertisement purposes. The purpose of this slide is to indicate the performance analysis of the organizations current security infrastructure. The key components include where we are, the gap, where we want to be, and recommended solutions.
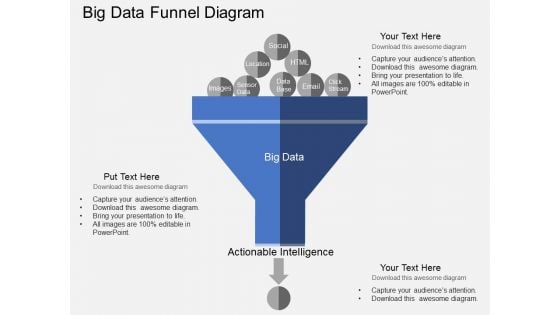
Big Data Funnel Diagram Powerpoint Templates
Our above business slide has been designed with graphics of big data funnel diagram. This slide is suitable to present data analysis, storage and sharing. Use this business diagram to present your work in a more smart and precise manner.
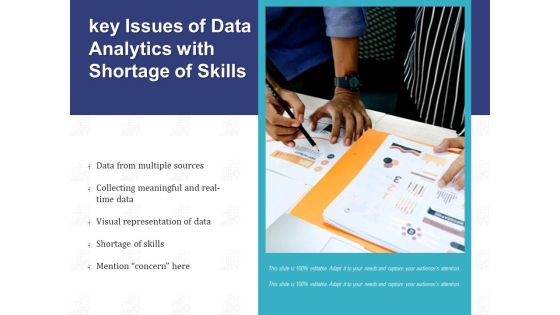
Key Issues Of Data Analytics With Shortage Of Skills Ppt PowerPoint Presentation File Inspiration PDF
Presenting key issues of data analytics with shortage of skills ppt powerpoint presentation file inspiration pdf to dispense important information. This template comprises one stages. It also presents valuable insights into the topics including data, skills, visual representation. This is a completely customizable PowerPoint theme that can be put to use immediately. So, download it and address the topic impactfully.
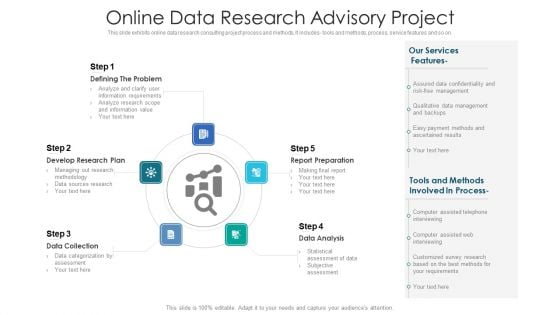
Online Data Research Advisory Project Ppt PowerPoint Presentation File Themes PDF
This slide exhibits online data research consulting project process and methods, It includes- tools and methods, process, service features and so on. Presenting online data research advisory project ppt powerpoint presentation file themes pdf to dispense important information. This template comprises five stages. It also presents valuable insights into the topics including report preparation, data analysis, data collection, develop research plan, problem. This is a completely customizable PowerPoint theme that can be put to use immediately. So, download it and address the topic impactfully.
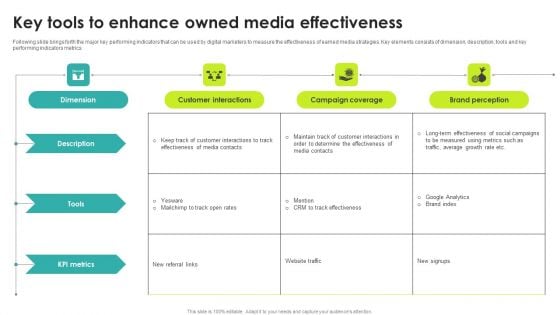
Key Tools To Enhance Owned Media Effectiveness Summary PDF
Following slide brings forth the major key performing indicators that can be used by digital marketers to measure the effectiveness of earned media strategies. Key elements consists of dimension, description, tools and key performing indicators metrics Showcasing this set of slides titled Key Tools To Enhance Owned Media Effectiveness Summary PDF. The topics addressed in these templates are Dimension, Description, Tools . All the content presented in this PPT design is completely editable. Download it and make adjustments in color, background, font etc. as per your unique business setting.
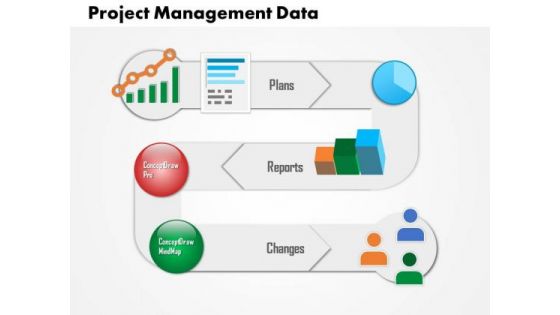
Business Diagram Project Management Data PowerPoint Ppt Presentation
This slide provides diagram for project management data. It contains spiral diagram with icons depicting plans reports and changes. Download this awesome diagram to capture your audiences attention.

Vertical Steps For Data Management Powerpoint Template
This PowerPoint template contains diagram of vertical steps. You may use this PPT slide to depict data management. The color coding of this template is specifically designed to highlight you points.
Information Transformation Process Toolkit Essential Business Requirements For Data Analytics In Venn Diagram Icons PDF
In this slide, we are showing the basic key components including people, process and technology that are required for data analytics strategy management process. This is a Information Transformation Process Toolkit Essential Business Requirements For Data Analytics In Venn Diagram Icons PDF template with various stages. Focus and dispense information on three stages using this creative set, that comes with editable features. It contains large content boxes to add your information on topics like Analytics, Processes, Technologies. You can also showcase facts, figures, and other relevant content using this PPT layout. Grab it now.
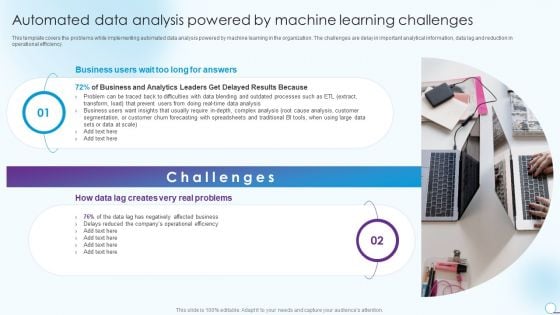
Automated Data Analysis Powered By Machine Learning Challenges Ideas PDF
This template covers the problems while implementing automated data analysis powered by machine learning in the organization. The challenges are delay in important analytical information, data lag and reduction in operational efficiency. Presenting Automated Data Analysis Powered By Machine Learning Challenges Ideas PDF to provide visual cues and insights. Share and navigate important information on two stages that need your due attention. This template can be used to pitch topics like Data Analysis Business, Complex Analysis, Root Cause Analysis. In addtion, this PPT design contains high resolution images, graphics, etc, that are easily editable and available for immediate download.

Utilize Analytics To Reach Out To Potential Partners Partner Relationship Ppt Template
This slide presents the steps to utilize analytics to identify channels to attract potential partners. It includes steps such as, set up tracking, monitor data and analyze data. There are so many reasons you need a Utilize Analytics To Reach Out To Potential Partners Partner Relationship Ppt Template. The first reason is you can not spend time making everything from scratch, Thus, Slidegeeks has made presentation templates for you too. You can easily download these templates from our website easily. This slide presents the steps to utilize analytics to identify channels to attract potential partners. It includes steps such as, set up tracking, monitor data and analyze data.
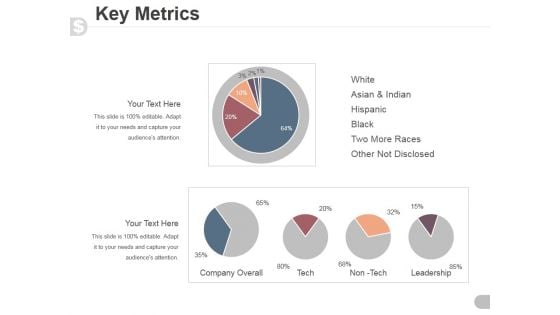
Key Metrics Ppt PowerPoint Presentation Visual Aids
This is a key metrics ppt powerpoint presentation visual aids. This is a five stage process. The stages in this process are white, asian and indian, hispanic, black, two more races, other not disclosed.

Information Transformation Process Toolkit Data Analysis Project Plan Diagrams PDF
The slide outline the key steps for data analytics methodology. It initiates with defining business objectives to data understanding, modelling and ends at data visualization and presentation. Presenting Information Transformation Process Toolkit Data Analysis Project Plan Diagrams PDF to provide visual cues and insights. Share and navigate important information on six stages that need your due attention. This template can be used to pitch topics like Business Issue Understanding, Data Understanding, Data Preparation. In addtion, this PPT design contains high resolution images, graphics, etc, that are easily editable and available for immediate download.
Four Staged Numeric Tags For Data Representation Powerpoint Template
Our above PowerPoint slide contains diagram of four numeric tags. Download this business slide for data representations. Use this diagram to impart more clarity to data and to create more sound impact on viewers.

Business Intelligence And Big Value Stream Data Analytics Process Download PDF
This slide shows the step by step approach of data analytics project focusing on data gathering, consolidation and data analysis to build business insights for effective decision making. Presenting business intelligence and big value stream data analytics process download pdf to provide visual cues and insights. Share and navigate important information on six stages that need your due attention. This template can be used to pitch topics like data gathering, field level analysis, data analysis and business insights, data cleaning, data consolidation. In addtion, this PPT design contains high resolution images, graphics, etc, that are easily editable and available for immediate download.
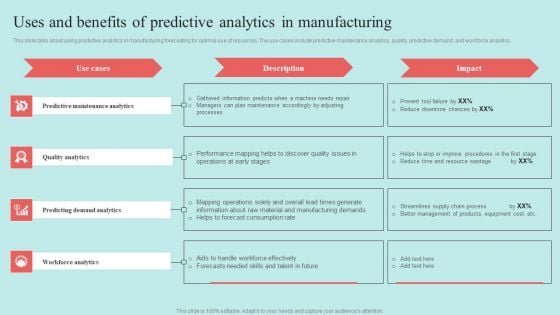
Predictive Data Model Uses And Benefits Of Predictive Analytics In Manufacturing Introduction PDF
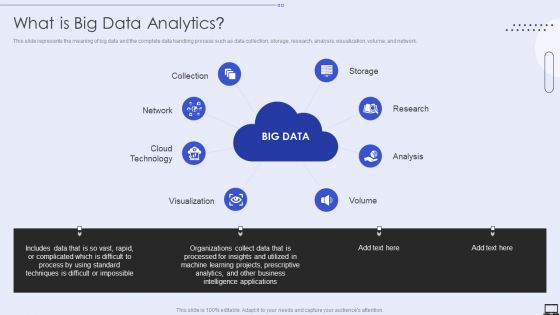
What Is Big Data Analytics Ppt PowerPoint Presentation File Background Images PDF
This is a What Is Big Data Analytics Ppt PowerPoint Presentation File Background Images PDF template with various stages. Focus and dispense information on eight stages using this creative set, that comes with editable features. It contains large content boxes to add your information on topics like Cloud Technology, Visualization, Analysis. You can also showcase facts, figures, and other relevant content using this PPT layout. Grab it now.
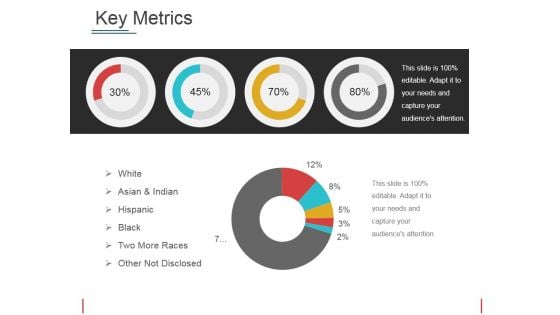
Key Metrics Ppt PowerPoint Presentation Model Professional
This is a key metrics ppt powerpoint presentation model professional. This is a four stage process. The stages in this process are white, asian and indian, hispanic, black, two more races, other not disclosed.
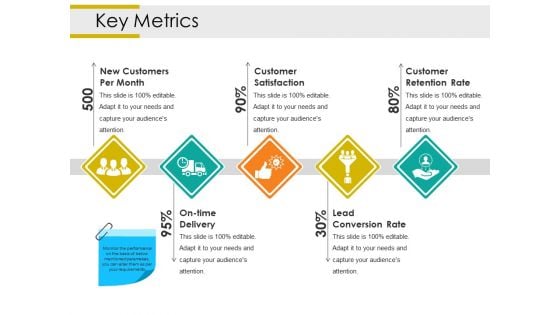
Key Metrics Ppt PowerPoint Presentation Layouts Good
This is a key metrics ppt powerpoint presentation layouts good. This is a five stage process. The stages in this process are new customers per month, customer satisfaction, customer retention rate, lead conversion rate, on time delivery.
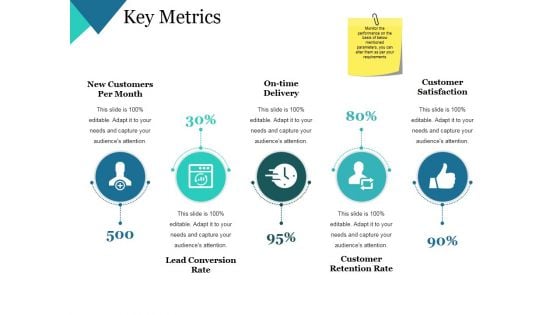
Key Metrics Ppt PowerPoint Presentation Themes
This is a key metrics ppt powerpoint presentation themes. This is a five stage process. The stages in this process are new customers per month, on time delivery, customer satisfaction, customer retention rate, lead conversion rate.
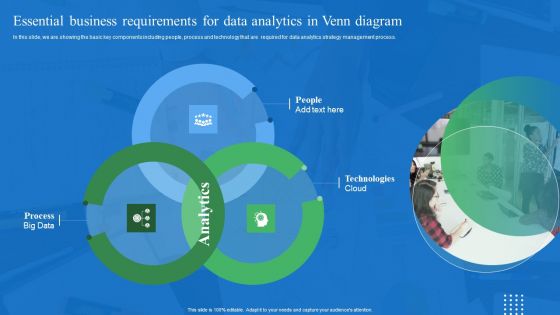
Essential Business Requirements For Data Analytics In Venn Diagram Introduction PDF
In this slide, we are showing the basic key components including people, process and technology that are required for data analytics strategy management process. Here you can discover an assortment of the finest PowerPoint and Google Slides templates. With these templates, you can create presentations for a variety of purposes while simultaneously providing your audience with an eye catching visual experience. Download Essential Business Requirements For Data Analytics In Venn Diagram Introduction PDF to deliver an impeccable presentation. These templates will make your job of preparing presentations much quicker, yet still, maintain a high level of quality. Slidegeeks has experienced researchers who prepare these templates and write high quality content for you. Later on, you can personalize the content by editing the Essential Business Requirements For Data Analytics In Venn Diagram Introduction PDF.
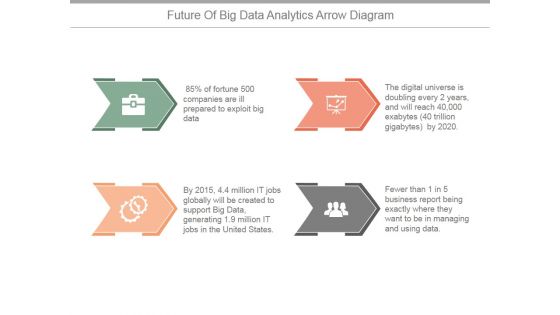
Future Of Big Data Analytics Arrow Diagram Ppt PowerPoint Presentation Summary
This is a future of big data analytics arrow diagram ppt powerpoint presentation summary. This is a four stage process. The stages in this process are big data, process, business, marketing, icons.
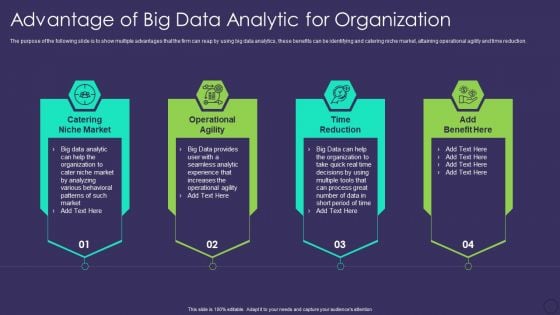
Comprehensive Business Digitization Deck Advantage Of Big Data Analytic For Organization Sample PDF
The purpose of the following slide is to show multiple advantages that the firm can reap by using big data analytics, these benefits can be identifying and catering niche market, attaining operational agility and time reduction. Presenting comprehensive business digitization deck advantage of big data analytic for organization sample pdf to provide visual cues and insights. Share and navigate important information on four stages that need your due attention. This template can be used to pitch topics like catering niche market, operational agility, time reduction. In addtion, this PPT design contains high resolution images, graphics, etc, that are easily editable and available for immediate download.
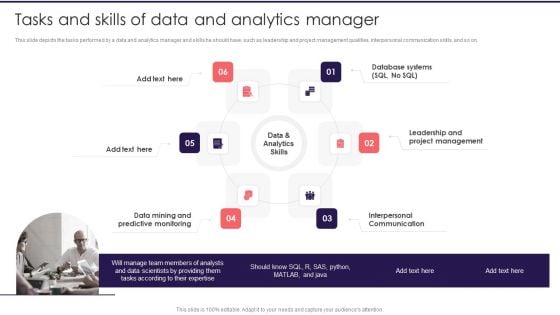
Information Studies Tasks And Skills Of Data And Analytics Manager Introduction PDF
This slide depicts the tasks performed by a data and analytics manager and skills he should have, such as leadership and project management qualities, interpersonal communication skills, and so on. Presenting Information Studies Tasks And Skills Of Data And Analytics Manager Introduction PDF to provide visual cues and insights. Share and navigate important information on six stages that need your due attention. This template can be used to pitch topics like Interpersonal Communication, Leadership Project Management, Database Systems. In addtion, this PPT design contains high resolution images, graphics, etc, that are easily editable and available for immediate download.
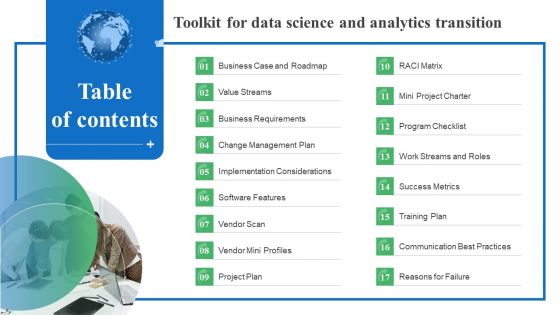
Table Of Contenst Toolkit For Data Science And Analytics Transition Professional PDF
Here you can discover an assortment of the finest PowerPoint and Google Slides templates. With these templates, you can create presentations for a variety of purposes while simultaneously providing your audience with an eye catching visual experience. Download Table Of Contenst Toolkit For Data Science And Analytics Transition Professional PDF to deliver an impeccable presentation. These templates will make your job of preparing presentations much quicker, yet still, maintain a high level of quality. Slidegeeks has experienced researchers who prepare these templates and write high quality content for you. Later on, you can personalize the content by editing the Table Of Contenst Toolkit For Data Science And Analytics Transition Professional PDF.
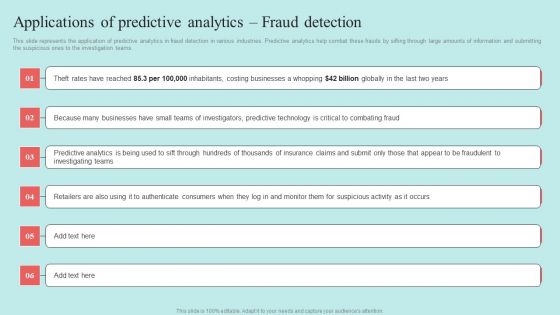
Predictive Data Model Applications Of Predictive Analytics Fraud Detection Microsoft PDF

Social Data And Communication Data Representation Powerpoint Template
This PPT slide has been designed with text layout. This PowerPoint template is designed to display text message in visual manner. This professional slide helps in making an instant impact on viewers.
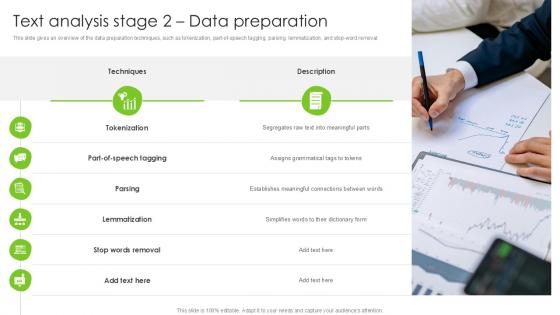
Text Analysis Stage 2 Data Preparation PPT Sample SS
This slide gives an overview of the data preparation techniques, such as tokenization, part-of-speech tagging, parsing, lemmatization, and stop-word removal. Retrieve professionally designed Text Analysis Stage 2 Data Preparation PPT Sample SS to effectively convey your message and captivate your listeners. Save time by selecting pre-made slideshows that are appropriate for various topics, from business to educational purposes. These themes come in many different styles, from creative to corporate, and all of them are easily adjustable and can be edited quickly. Access them as PowerPoint templates or as Google Slides themes. You do not have to go on a hunt for the perfect presentation because Slidegeeks got you covered from everywhere. This slide gives an overview of the data preparation techniques, such as tokenization, part-of-speech tagging, parsing, lemmatization, and stop-word removal.
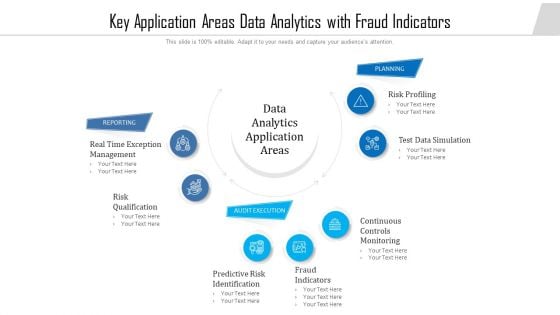
Key Application Areas Data Analytics With Fraud Indicators Ppt PowerPoint Presentation File Background Designs PDF
Persuade your audience using this key application areas data analytics with fraud indicators ppt powerpoint presentation file background designs pdf. This PPT design covers seven stages, thus making it a great tool to use. It also caters to a variety of topics including risk, planning, analytics. Download this PPT design now to present a convincing pitch that not only emphasizes the topic but also showcases your presentation skills.
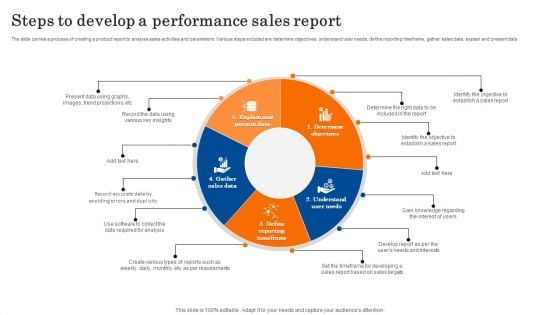
Steps To Develop A Performance Sales Report Mockup PDF
The slide carries a process of creating a product report to analyse sales activities and parameters. Various steps included are determine objectives, understand user needs, define reporting timeframe, gather sales data, explain and present data. Persuade your audience using this Steps To Develop A Performance Sales Report Mockup PDF. This PPT design covers five stages, thus making it a great tool to use. It also caters to a variety of topics including Determine Objectives, Understand User Needs, Define Reporting Timeframe. Download this PPT design now to present a convincing pitch that not only emphasizes the topic but also showcases your presentation skills.

Various Metrics To Analyze Business Project Evaluation Inspiration PDF
This slide signifies the various key performance indicator or metrics to evaluate project investment. It covers information about metrics like net present value, discount cash flow, expected commercial value and weighted average cost of capital. Pitch your topic with ease and precision using this Various Metrics To Analyze Business Project Evaluation Inspiration PDF. This layout presents information on KPI, Metrics, Key Description, Expected, Actual, Variance. It is also available for immediate download and adjustment. So, changes can be made in the color, design, graphics or any other component to create a unique layout.
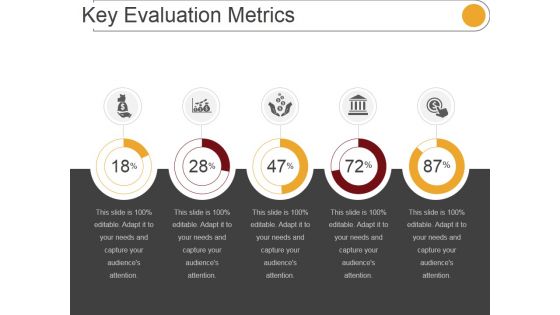
Key Evaluation Metrics Ppt PowerPoint Presentation Influencers
This is a key evaluation metrics ppt powerpoint presentation influencers. This is a five stage process. The stages in this process are icons, percentage, marketing, management.
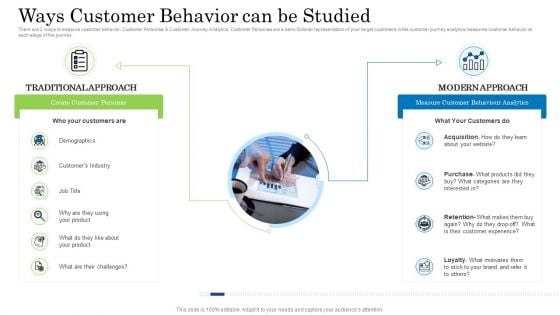
Customer Behavioral Data And Analytics Ways Customer Behavior Can Be Studied Elements PDF
There are 2 ways to measure customer behavior Customer Personas and Customer Journey Analytics. Customer Personas are a semi fictional representation of your target customers while customer journey analytics measures customer behavior at each stage of the journey.This is a customer behavioral data and analytics ways customer behavior can be studied elements pdf template with various stages. Focus and dispense information on two stages using this creative set, that comes with editable features. It contains large content boxes to add your information on topics like customers, demographics, customers industry, acquisition, purchase. You can also showcase facts, figures, and other relevant content using this PPT layout. Grab it now.
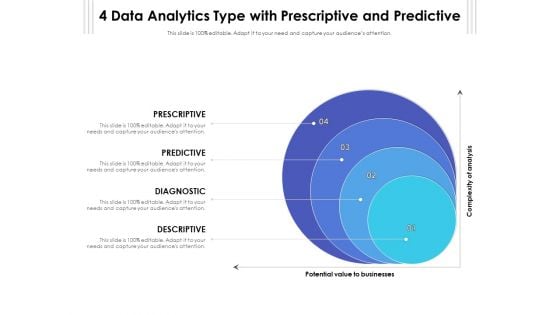
4 Data Analytics Type With Prescriptive And Predictive Ppt PowerPoint Presentation File Infographic Template PDF
Presenting 4 data analytics type with prescriptive and predictive ppt powerpoint presentation file infographic template pdf to dispense important information. This template comprises four stages. It also presents valuable insights into the topics including prescriptive, predictive, diagnostic. This is a completely customizable PowerPoint theme that can be put to use immediately. So, download it and address the topic impactfully.
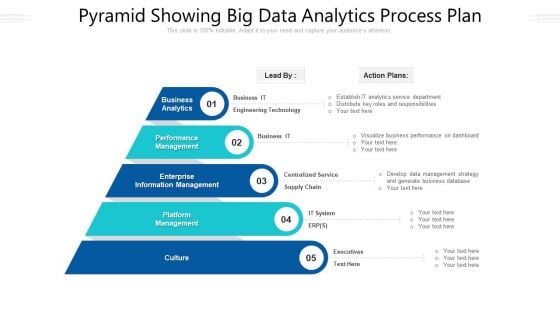
Pyramid Showing Big Data Analytics Process Plan Ppt PowerPoint Presentation File Ideas PDF
Presenting pyramid showing big data analytics process plan ppt powerpoint presentation file ideas pdf to dispense important information. This template comprises five stages. It also presents valuable insights into the topics including culture, management, performance. This is a completely customizable PowerPoint theme that can be put to use immediately. So, download it and address the topic impactfully.
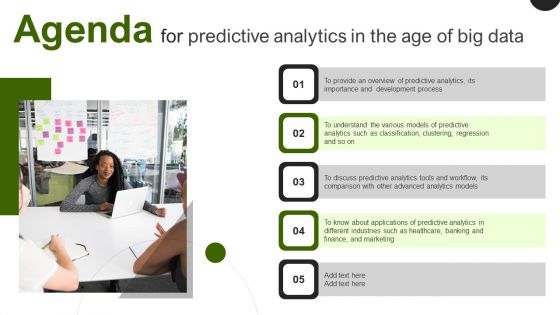
Agenda For Predictive Analytics In The Age Of Big Data Graphics PDF
Find a pre designed and impeccable Agenda For Predictive Analytics In The Age Of Big Data Graphics PDF. The templates can ace your presentation without additional effort. You can download these easy to edit presentation templates to make your presentation stand out from others. So, what are you waiting for Download the template from Slidegeeks today and give a unique touch to your presentation.

Key Metrics Ppt PowerPoint Presentation Professional Slideshow
This is a key metrics ppt powerpoint presentation professional slideshow. This is a five stage process. The stages in this process are new customers per month, on time delivery, customer satisfaction, lead conversion rate, customer retention rate.
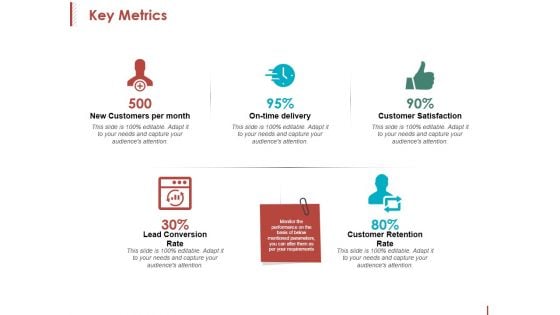
Key Metrics Ppt PowerPoint Presentation Inspiration Format
This is a key metrics ppt powerpoint presentation inspiration format. This is a five stage process. The stages in this process are new customers per month, on time delivery, customer satisfaction, customer retention rate.
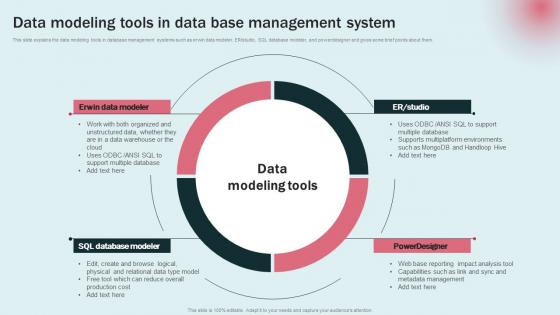
Data Modeling Tools Data Base Data Modeling Approaches For Modern Analytics Information Pdf
This slide explains the data modeling tools in database management systems such as erwin data modeler, ER studio, SQL database modeler, and powerdesigner and gives some brief points about them. Find highly impressive Data Modeling Tools Data Base Data Modeling Approaches For Modern Analytics Information Pdf on Slidegeeks to deliver a meaningful presentation. You can save an ample amount of time using these presentation templates. No need to worry to prepare everything from scratch because Slidegeeks experts have already done a huge research and work for you. You need to download Data Modeling Tools Data Base Data Modeling Approaches For Modern Analytics Information Pdf for your upcoming presentation. All the presentation templates are 100 percent editable and you can change the color and personalize the content accordingly. Download now This slide explains the data modeling tools in database management systems such as erwin data modeler, ER studio, SQL database modeler, and powerdesigner and gives some brief points about them.
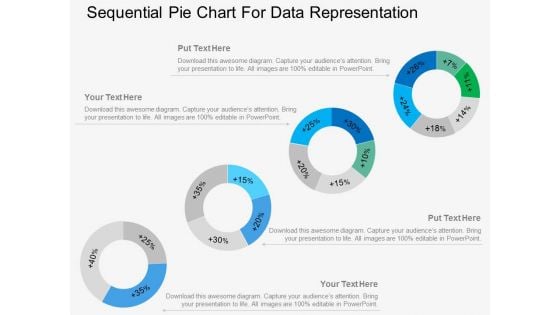
Four Sequential Pie Charts For Data Representation Powerpoint Template
Our above PowerPoint template displays infographic diagram of sequential pie chart. This diagram slide may be used for data representation in visual manner. Above slide provide ideal backdrop to make business presentations.
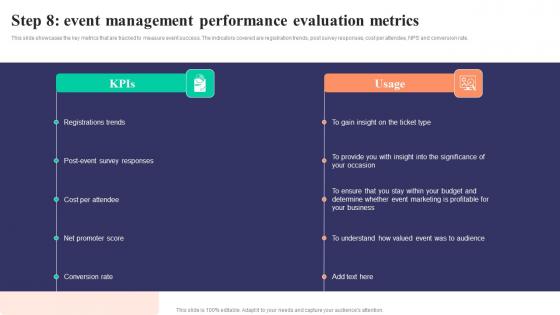
Step 8 Event Management Performance Strategies To Develop Successful Mockup Pdf
This slide showcases the key metrics that are tracked to measure event success. The indicators covered are registration trends, post survey responses, cost per attendee, NPS and conversion rate. This Step 8 Event Management Performance Strategies To Develop Successful Mockup Pdf from Slidegeeks makes it easy to present information on your topic with precision. It provides customization options, so you can make changes to the colors, design, graphics, or any other component to create a unique layout. It is also available for immediate download, so you can begin using it right away. Slidegeeks has done good research to ensure that you have everything you need to make your presentation stand out. Make a name out there for a brilliant performance. This slide showcases the key metrics that are tracked to measure event success. The indicators covered are registration trends, post survey responses, cost per attendee, NPS and conversion rate.
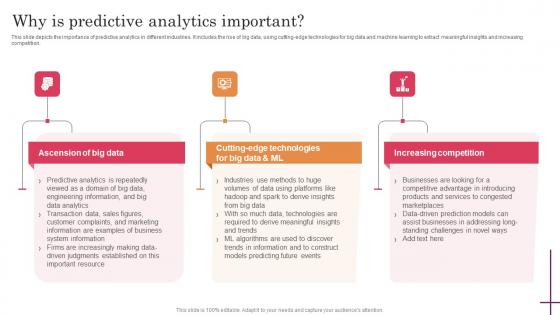
Why Is Predictive Analytics Important Predictive Analytics For Improved Guidelines Pdf
This slide depicts the importance of predictive analytics in different industries. It includes the rise of big data, using cutting-edge technologies for big data and machine learning to extract meaningful insights and increasing competition. If your project calls for a presentation, then Slidegeeks is your go-to partner because we have professionally designed, easy-to-edit templates that are perfect for any presentation. After downloading, you can easily edit Why Is Predictive Analytics Important Predictive Analytics For Improved Guidelines Pdf and make the changes accordingly. You can rearrange slides or fill them with different images. Check out all the handy templates This slide depicts the importance of predictive analytics in different industries. It includes the rise of big data, using cutting-edge technologies for big data and machine learning to extract meaningful insights and increasing competition.
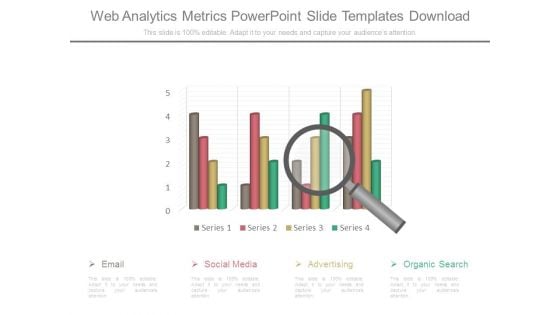
Web Analytics Metrics Powerpoint Slide Templates Download
This is a web analytics metrics powerpoint slide templates download. This is a one stage process. The stages in this process are email, social media, advertising, organic search.
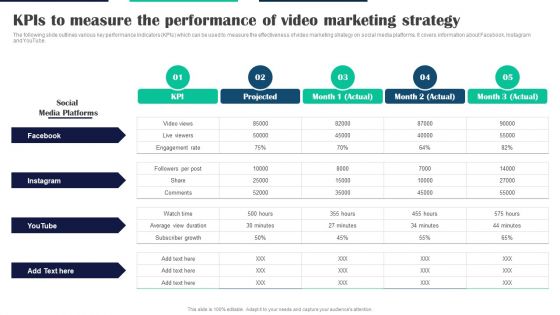
Executing Video Promotional Kpis To Measure The Performance Of Video Marketing Strategy Inspiration PDF
The following slide outlines various key performance indicators KPIs which can be used to measure the effectiveness of video marketing strategy on social media platforms. It covers information about Facebook, Instagram and YouTube. This modern and well-arranged Executing Video Promotional Kpis To Measure The Performance Of Video Marketing Strategy Inspiration PDF provides lots of creative possibilities. It is very simple to customize and edit with the Powerpoint Software. Just drag and drop your pictures into the shapes. All facets of this template can be edited with Powerpoint, no extra software is necessary. Add your own material, put your images in the places assigned for them, adjust the colors, and then you can show your slides to the world, with an animated slide included.
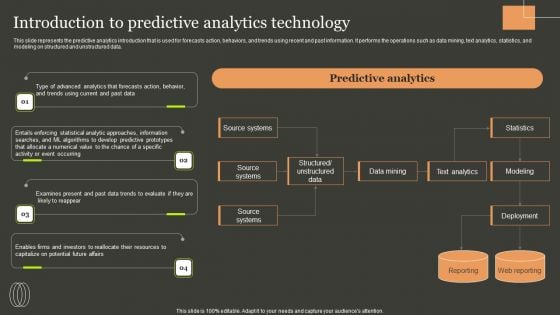
Predictive Analytics Methods Introduction To Predictive Analytics Technology Clipart PDF
This slide represents the predictive analytics introduction that is used for forecasts action, behaviors, and trends using recent and past information. It performs the operations such as data mining, text analytics, statistics, and modeling on structured and unstructured data. Do you have to make sure that everyone on your team knows about any specific topic I yes, then you should give Predictive Analytics Methods Introduction To Predictive Analytics Technology Clipart PDF a try. Our experts have put a lot of knowledge and effort into creating this impeccable Predictive Analytics Methods Introduction To Predictive Analytics Technology Clipart PDF. You can use this template for your upcoming presentations, as the slides are perfect to represent even the tiniest detail. You can download these templates from the Slidegeeks website and these are easy to edit. So grab these today.
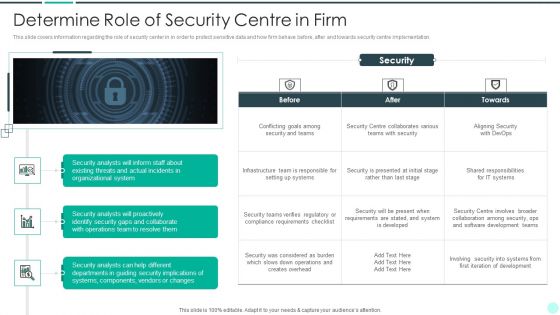
Executing Advance Data Analytics At Workspace Determine Role Of Security Centre In Firm Sample PDF
This slide covers information regarding the role of security center in in order to protect sensitive data and how firm behave before, after and towards security centre implementation. This is a executing advance data analytics at workspace determine role of security centre in firm sample pdf template with various stages. Focus and dispense information on four stages using this creative set, that comes with editable features. It contains large content boxes to add your information on topics like determine role of security centre in firm. You can also showcase facts, figures, and other relevant content using this PPT layout. Grab it now.
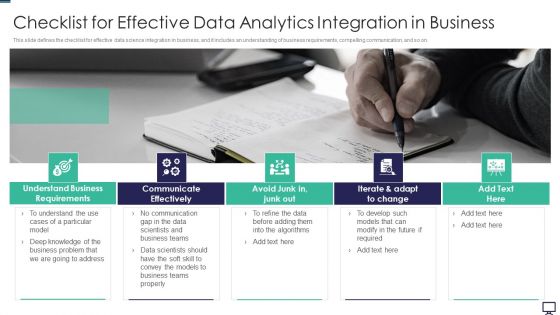
Checklist For Effective Data Analytics Integration In Business Ppt Inspiration Maker PDF
This slide defines the checklist for effective data science integration in business, and it includes an understanding of business requirements, compelling communication, and so on. This is a checklist for effective data analytics integration in business ppt inspiration maker pdf template with various stages. Focus and dispense information on five stages using this creative set, that comes with editable features. It contains large content boxes to add your information on topics like communicate effectively, requirements, business teams, required. You can also showcase facts, figures, and other relevant content using this PPT layout. Grab it now.
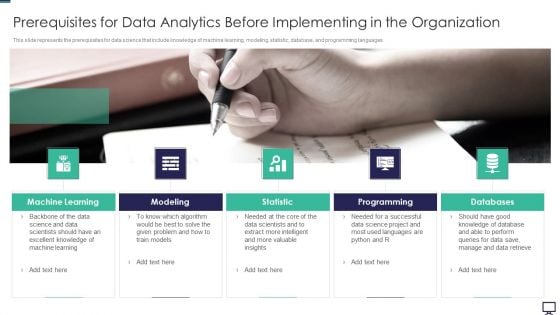
Prerequisites For Data Analytics Before Implementing In The Organization Ppt Professional Design Templates PDF
This slide represents the prerequisites for data science that include knowledge of machine learning, modeling, statistic, database, and programming languages. This is a prerequisites for data analytics before implementing in the organization ppt professional design templates pdf template with various stages. Focus and dispense information on five stages using this creative set, that comes with editable features. It contains large content boxes to add your information on topics like programming, databases, statistic, modeling, machine learning. You can also showcase facts, figures, and other relevant content using this PPT layout. Grab it now.
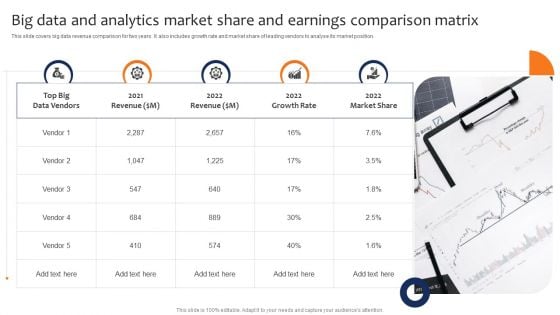
Big Data And Analytics Market Share And Earnings Comparison Matrix Elements PDF
This slide covers big data revenue comparison for two years. It also includes growth rate and market share of leading vendors to analyse its market position. Persuade your audience using this Big Data And Analytics Market Share And Earnings Comparison Matrix Elements PDF. This PPT design covers five stages, thus making it a great tool to use. It also caters to a variety of topics including Revenue, Growth Rate, Market Share. Download this PPT design now to present a convincing pitch that not only emphasizes the topic but also showcases your presentation skills.
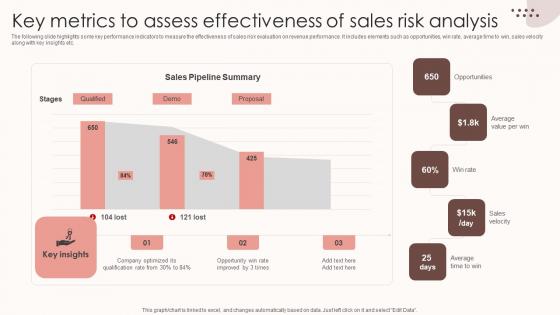
Assessing Sales Risks Key Metrics To Assess Effectiveness Of Sales Risk Analysis Diagrams PDF
The following slide highlights some key performance indicators to measure the effectiveness of sales risk evaluation on revenue performance. It includes elements such as opportunities, win rate, average time to win, sales velocity along with key insights etc. This Assessing Sales Risks Key Metrics To Assess Effectiveness Of Sales Risk Analysis Diagrams PDF is perfect for any presentation, be it in front of clients or colleagues. It is a versatile and stylish solution for organizing your meetings. The Assessing Sales Risks Key Metrics To Assess Effectiveness Of Sales Risk Analysis Diagrams PDF features a modern design for your presentation meetings. The adjustable and customizable slides provide unlimited possibilities for acing up your presentation. Slidegeeks has done all the homework before launching the product for you. So, do not wait, grab the presentation templates today The following slide highlights some key performance indicators to measure the effectiveness of sales risk evaluation on revenue performance. It includes elements such as opportunities, win rate, average time to win, sales velocity along with key insights etc.


 Continue with Email

 Home
Home


