Snapshot
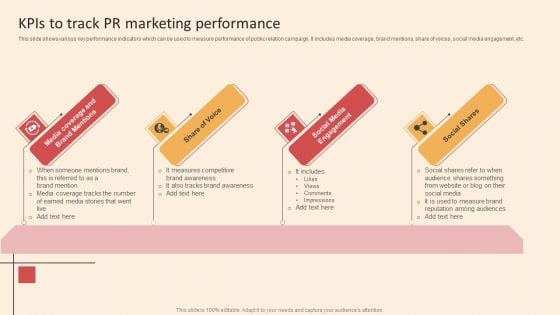
Online PR Techniques To Boost Brands Online Visibility Kpis To Track PR Marketing Performance Guidelines PDF
This slide shows various key performance indicators which can be used to measure performance of public relation campaign. It includes media coverage, brand mentions, share of voices, social media engagement, etc. Are you searching for a Online PR Techniques To Boost Brands Online Visibility Kpis To Track PR Marketing Performance Guidelines PDF that is uncluttered, straightforward, and original Its easy to edit, and you can change the colors to suit your personal or business branding. For a presentation that expresses how much effort you have put in, this template is ideal. With all of its features, including tables, diagrams, statistics, and lists, its perfect for a business plan presentation. Make your ideas more appealing with these professional slides. Download Online PR Techniques To Boost Brands Online Visibility Kpis To Track PR Marketing Performance Guidelines PDF from Slidegeeks today.
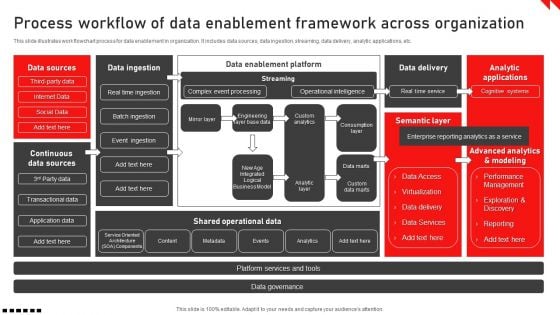
Process Workflow Of Data Enablement Framework Across Organization Summary PDF
This slide illustrates work flowchart process for data enablement in organization. It includes data sources, data ingestion, streaming, data delivery, analytic applications, etc. Showcasing this set of slides titled Process Workflow Of Data Enablement Framework Across Organization Summary PDF. The topics addressed in these templates are Data Access, Virtualization, Data Delivery. All the content presented in this PPT design is completely editable. Download it and make adjustments in color, background, font etc. as per your unique business setting.
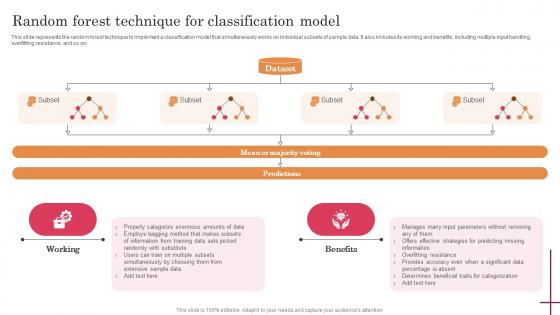
Random Forest Technique For Classification Predictive Analytics For Improved Guidelines Pdf
This slide represents the random forest technique to implement a classification model that simultaneously works on individual subsets of sample data. It also includes its working and benefits, including multiple input handling, overfitting resistance, and so on. Find a pre-designed and impeccable Random Forest Technique For Classification Predictive Analytics For Improved Guidelines Pdf. The templates can ace your presentation without additional effort. You can download these easy-to-edit presentation templates to make your presentation stand out from others. So, what are you waiting for Download the template from Slidegeeks today and give a unique touch to your presentation. This slide represents the random forest technique to implement a classification model that simultaneously works on individual subsets of sample data. It also includes its working and benefits, including multiple input handling, overfitting resistance, and so on.
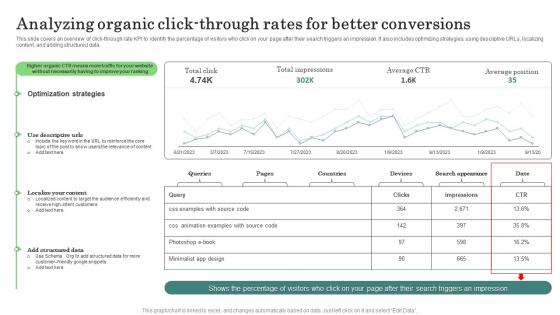
Analyzing Organic Click Through Major Promotional Analytics Future Trends Microsoft Pdf
This slide covers an overview of click through rate KPI to identify the percentage of visitors who click on your page after their search triggers an impression. It also includes optimizing strategies, using descriptive URLs, localizing content, and adding structured data. From laying roadmaps to briefing everything in detail, our templates are perfect for you. You can set the stage with your presentation slides. All you have to do is download these easy to edit and customizable templates. Analyzing Organic Click Through Major Promotional Analytics Future Trends Microsoft Pdf will help you deliver an outstanding performance that everyone would remember and praise you for. Do download this presentation today. This slide covers an overview of click through rate KPI to identify the percentage of visitors who click on your page after their search triggers an impression. It also includes optimizing strategies, using descriptive URLs, localizing content, and adding structured data.
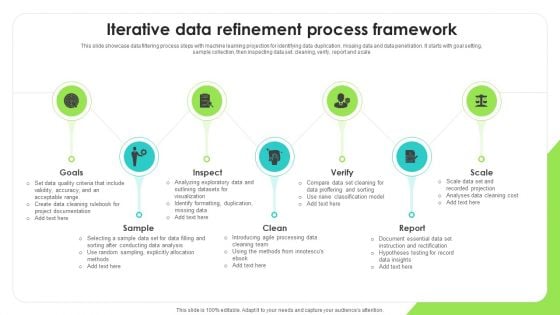
Iterative Data Refinement Process Framework Download PDF
This slide showcase data filtering process steps with machine learning projection for identifying data duplication, missing data and data penetration. It starts with goal setting, sample collection, then inspecting data set, cleaning, verify, report and scale. Presenting Iterative Data Refinement Process Framework Download PDF to dispense important information. This template comprises seven stages. It also presents valuable insights into the topics including Explicitly Allocation, Introducing Processing, Classification Model. This is a completely customizable PowerPoint theme that can be put to use immediately. So, download it and address the topic impactfully.
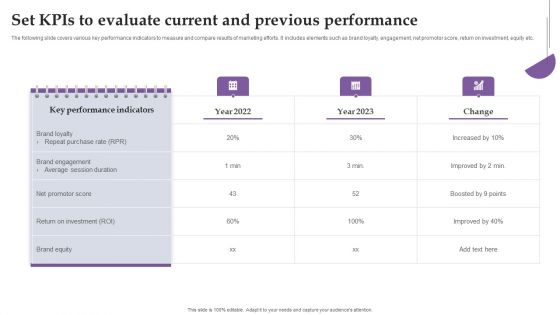
Set Kpis To Evaluate Current And Previous Performance Ppt Model Deck PDF
The following slide covers various key performance indicators to measure and compare results of marketing efforts. It includes elements such as brand loyalty, engagement, net promotor score, return on investment, equity etc. Whether you have daily or monthly meetings, a brilliant presentation is necessary. Set Kpis To Evaluate Current And Previous Performance Ppt Model Deck PDF can be your best option for delivering a presentation. Represent everything in detail using Set Kpis To Evaluate Current And Previous Performance Ppt Model Deck PDF and make yourself stand out in meetings. The template is versatile and follows a structure that will cater to your requirements. All the templates prepared by Slidegeeks are easy to download and edit. Our research experts have taken care of the corporate themes as well. So, give it a try and see the results.
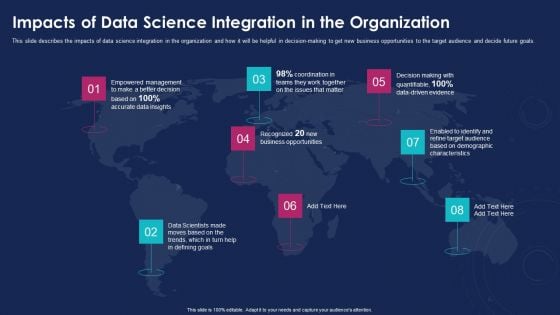
Data Analytics IT Impacts Of Data Science Integration In The Organization Ppt Pictures Background Designs PDF
This slide describes the impacts of data science integration in the organization and how it will be helpful in decision-making to get new business opportunities to the target audience and decide future goals. This is a data analytics it impacts of data science integration in the organization ppt pictures background designs pdf template with various stages. Focus and dispense information on eight stages using this creative set, that comes with editable features. It contains large content boxes to add your information on topics like business, opportunities, goals, demographic, data insights. You can also showcase facts, figures, and other relevant content using this PPT layout. Grab it now.
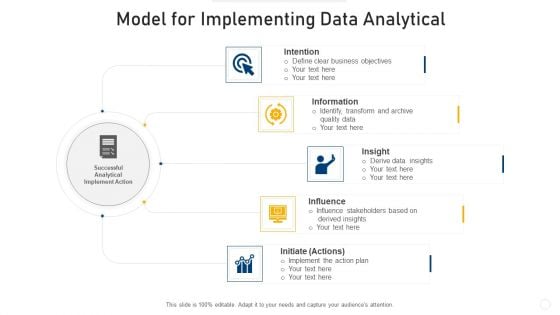
Model For Implementing Data Analytical Infographics PDF
Presenting model for implementing data analytical infographics pdf to dispense important information. This template comprises five stages. It also presents valuable insights into the topics including intention, insight, influence. This is a completely customizable PowerPoint theme that can be put to use immediately. So, download it and address the topic impactfully.

Agenda For Data Analytics Management Diagrams PDF
Presenting Agenda For Data Analytics Management Diagrams PDF to provide visual cues and insights. Share and navigate important information on five stages that need your due attention. This template can be used to pitch topics like Agenda. In addtion, this PPT design contains high resolution images, graphics, etc, that are easily editable and available for immediate download.

Regulated Data And Analytical Accuracy Playbook Template
Are you tired of boring presentations that fail to captivate your audience Look no further than our Regulated Data And Analytical Accuracy Playbook Template. It is designed to impress and capture attention. With 100 percent editable slides and visually-stunning graphics, you will be able to create presentations that wow. Do not settle for mediocrity, elevate your game with our A4 Playbook PPT Template.
Data Lake Development With Azure Cloud Software Use Cases Of Centralized Repository Data Lake Icons PDF
This slide depicts the use cases of data lakes such as data in place analytics, machine learning model training and archival and historical data storage. Presenting Data Lake Development With Azure Cloud Software Use Cases Of Centralized Repository Data Lake Icons PDF to provide visual cues and insights. Share and navigate important information on five stages that need your due attention. This template can be used to pitch topics like Business Metrics, Economic, Analysis. In addtion, this PPT design contains high resolution images, graphics, etc, that are easily editable and available for immediate download.
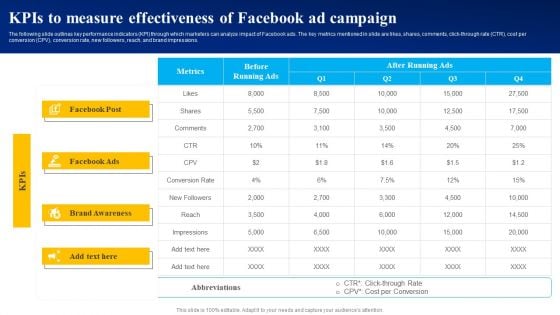
Kpis To Measure Effectiveness Of Facebook Ad Campaign Ppt PowerPoint Presentation File Diagrams PDF
The following slide outlines key performance indicators KPI through which marketers can analyze impact of Facebook ads. The key metrics mentioned in slide are likes, shares, comments, click-through rate CTR, cost per conversion CPV, conversion rate, new followers, reach, and brand impressions. Do you have to make sure that everyone on your team knows about any specific topic I yes, then you should give Kpis To Measure Effectiveness Of Facebook Ad Campaign Ppt PowerPoint Presentation File Diagrams PDF a try. Our experts have put a lot of knowledge and effort into creating this impeccable Kpis To Measure Effectiveness Of Facebook Ad Campaign Ppt PowerPoint Presentation File Diagrams PDF. You can use this template for your upcoming presentations, as the slides are perfect to represent even the tiniest detail. You can download these templates from the Slidegeeks website and these are easy to edit. So grab these today.
Shipment Tracking Solutions To Minimize Decline Of Sales Demonstration PDF
Following slide presents digital solutions for warehouse management that can be implemented by managers to streamline inventory management and reduce lost sales. Major solutions are radio frequency handheld device, dashboard, data analytics, trailer management etc. Persuade your audience using this Shipment Tracking Solutions To Minimize Decline Of Sales Demonstration PDF. This PPT design covers six stages, thus making it a great tool to use. It also caters to a variety of topics including Dashboard, Trailer Management, Advanced Solutions. Download this PPT design now to present a convincing pitch that not only emphasizes the topic but also showcases your presentation skills.
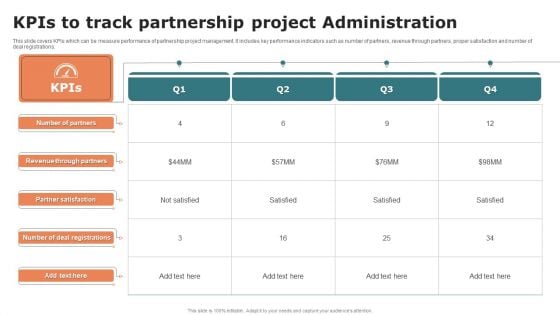
Kpis To Track Partnership Project Administration Graphics PDF
This slide covers KPIs which can be measure performance of partnership project management. It includes key performance indicators such as number of partners, revenue through partners, proper satisfaction and number of deal registrations. Pitch your topic with ease and precision using this Kpis To Track Partnership Project Administration Graphics PDF. This layout presents information on Partner Satisfaction, Revenue Through Partners, Number Of Partners. It is also available for immediate download and adjustment. So, changes can be made in the color, design, graphics or any other component to create a unique layout.
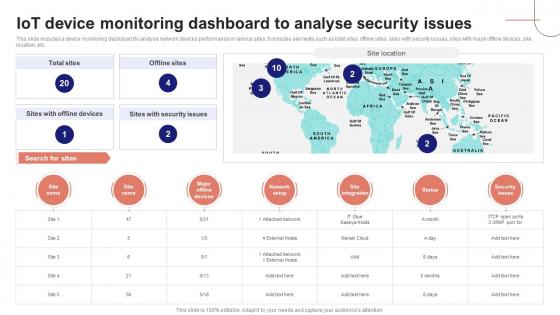
IoT Device Management Fundamentals IoT Device Monitoring Dashboard To Analyse IoT Ss V
This slide includes a device monitoring dashboard to analyse network devices performance in various sites. It includes elements such as total sites, offline sites, sites with security issues, sites with major offline devices, site location, etc. Slidegeeks is here to make your presentations a breeze with IoT Device Management Fundamentals IoT Device Monitoring Dashboard To Analyse IoT SS V With our easy-to-use and customizable templates, you can focus on delivering your ideas rather than worrying about formatting. With a variety of designs to choose from, you are sure to find one that suits your needs. And with animations and unique photos, illustrations, and fonts, you can make your presentation pop. So whether you are giving a sales pitch or presenting to the board, make sure to check out Slidegeeks first This slide includes a device monitoring dashboard to analyse network devices performance in various sites. It includes elements such as total sites, offline sites, sites with security issues, sites with major offline devices, site location, etc.
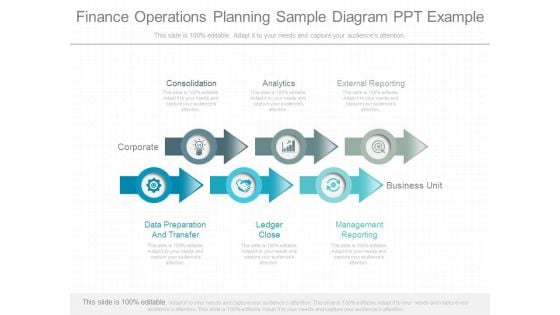
Finance Operations Planning Sample Diagram Ppt Example
This is a finance operations planning sample diagram ppt example. This is a six stage process. The stages in this process are consolidation, analytics, corporate, external reporting, business unit, data preparation and transfer, ledger close, management reporting.\n\n\n\n\n\n\n\n\n \n
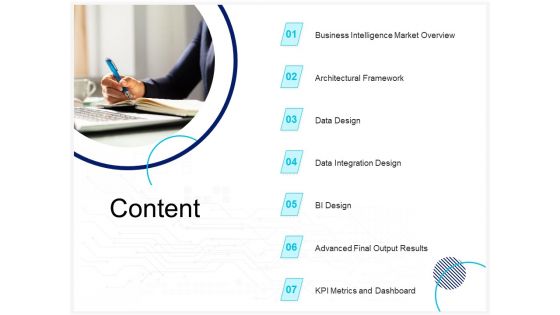
Enterprise Problem Solving And Intellect Content Ppt PowerPoint Presentation Styles Format Ideas PDF
Presenting this set of slides with name enterprise problem solving and intellect content ppt powerpoint presentation styles format ideas pdf. This is a seven stage process. The stages in this process are business intelligence market overview, architectural framework, data design, data integration design, bi design, advanced final output results, kpi metrics and dashboard. This is a completely editable PowerPoint presentation and is available for immediate download. Download now and impress your audience.
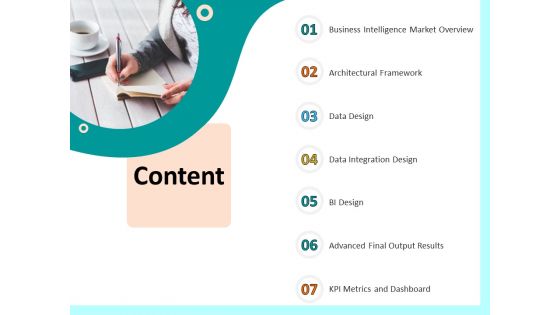
Firm Productivity Administration Content Ppt PowerPoint Presentation Visual Aids Summary PDF
Presenting this set of slides with name firm productivity administration content ppt powerpoint presentation visual aids summary pdf. This is a seven stage process. The stages in this process are business intelligence market overview, architectural framework, data design, data integration design, bi design, advanced final output results, kpi metrics and dashboard. This is a completely editable PowerPoint presentation and is available for immediate download. Download now and impress your audience.
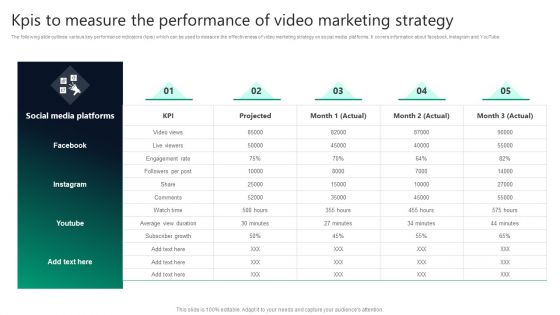
Kpis To Measure The Performance Of Video Marketing Strategy Mockup PDF
The following slide outlines various key performance indicators kpis which can be used to measure the effectiveness of video marketing strategy on social media platforms. It covers information about facebook, instagram and YouTube. Slidegeeks has constructed Kpis To Measure The Performance Of Video Marketing Strategy Mockup PDF after conducting extensive research and examination. These presentation templates are constantly being generated and modified based on user preferences and critiques from editors. Here, you will find the most attractive templates for a range of purposes while taking into account ratings and remarks from users regarding the content. This is an excellent jumping off point to explore our content and will give new users an insight into our top notch PowerPoint Templates.
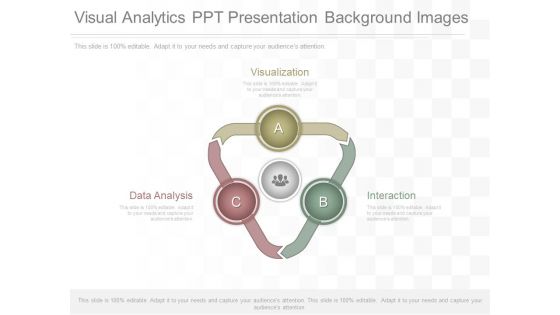
Visual Analytics Ppt Presentation Background Images
This is a visual analytics ppt presentation background images. This is a three stage process. The stages in this process are visualization, interaction, data analysis.

Comparative Analysis Of Quantitative And Qualitative Data Analysis Pictures PDF
Presenting Comparative Analysis Of Quantitative And Qualitative Data Analysis Pictures PDF to dispense important information. This template comprises five stages. It also presents valuable insights into the topics including Data Format, Analysis, Definition. This is a completely customizable PowerPoint theme that can be put to use immediately. So, download it and address the topic impactfully.
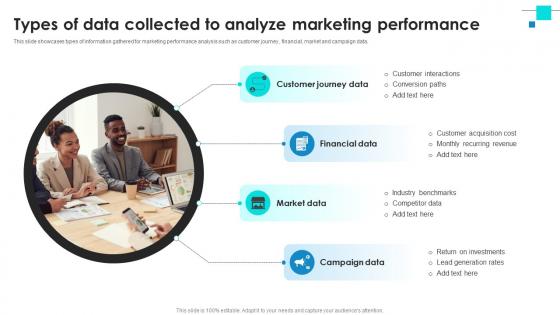
Project Benchmarking Process Types Of Data Collected To Analyze Marketing Performance CRP DK SS V
This slide showcases types of information gathered for marketing performance analysis such as customer journey , financial, market and campaign data. Slidegeeks is here to make your presentations a breeze with Project Benchmarking Process Types Of Data Collected To Analyze Marketing Performance CRP DK SS V With our easy-to-use and customizable templates, you can focus on delivering your ideas rather than worrying about formatting. With a variety of designs to choose from, you are sure to find one that suits your needs. And with animations and unique photos, illustrations, and fonts, you can make your presentation pop. So whether you are giving a sales pitch or presenting to the board, make sure to check out Slidegeeks first This slide showcases types of information gathered for marketing performance analysis such as customer journey , financial, market and campaign data.
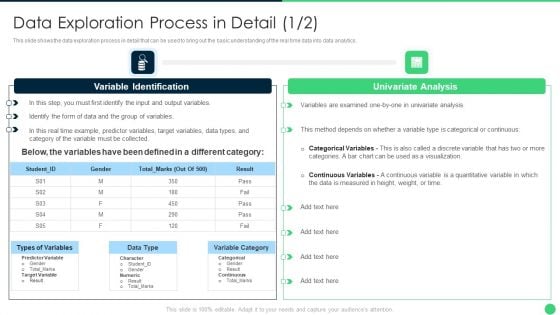
Processing Data Exploration Process In Detail Brochure PDF
This slide shows the data exploration process in detail that can be used to bring out the basic understanding of the real time data into data analytics.Deliver an awe inspiring pitch with this creative Processing Data Exploration Process In Detail Brochure PDF bundle. Topics like Variable Identification, Univariate Analysis, Categorical Or Continuous can be discussed with this completely editable template. It is available for immediate download depending on the needs and requirements of the user.
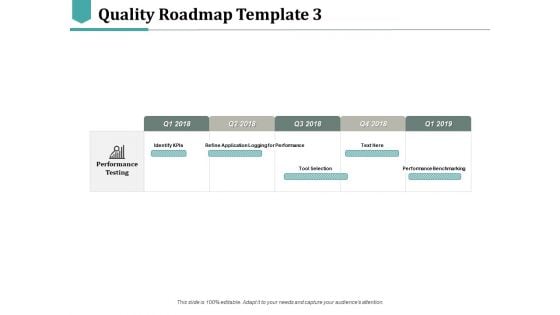
Quality Roadmap Identify Kpis Ppt PowerPoint Presentation Pictures Slideshow
This is a quality roadmap identify kpis ppt powerpoint presentation pictures slideshow. This is a five stage process. The stages in this process are identify kpis, tool selection, performance benchmarking.
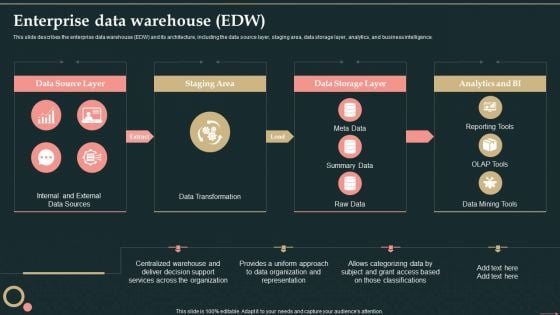
Management Information System Enterprise Data Warehouse EDW Formats PDF
This slide describes the enterprise data warehouse EDW and its architecture, including the data source layer, staging area, data storage layer, analytics, and business intelligence.Deliver an awe inspiring pitch with this creative Management Information System Enterprise Data Warehouse EDW Formats PDF bundle. Topics like Data Source, Staging Area, Data Storage can be discussed with this completely editable template. It is available for immediate download depending on the needs and requirements of the user.
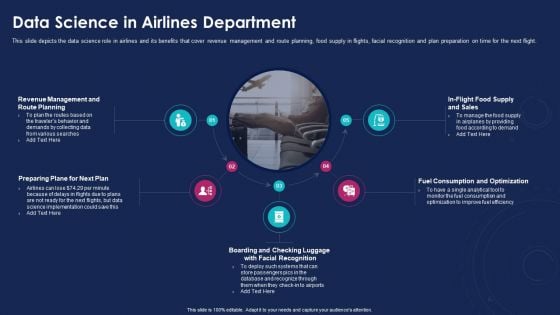
Data Analytics IT Data Science In Airlines Department Ppt Pictures Graphics Example PDF
This slide depicts the data science role in airlines and its benefits that cover revenue management and route planning, food supply in flights, facial recognition and plan preparation on time for the next flight. Presenting data analytics it data science in airlines department ppt pictures graphics example pdf to provide visual cues and insights. Share and navigate important information on five stages that need your due attention. This template can be used to pitch topics like revenue management planning, plan, facial recognition, consumption and optimization, sales. In addtion, this PPT design contains high resolution images, graphics, etc, that are easily editable and available for immediate download.
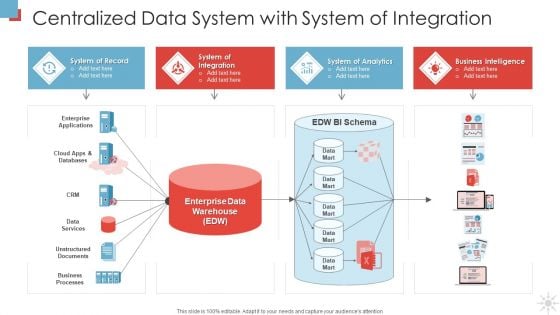
Centralized Data System With System Of Integration Designs PDF
Showcasing this set of slides titled centralized data system with system of integration designs pdf. The topics addressed in these templates are system of record, system of integration, system of analytics, business intelligence. All the content presented in this PPT design is completely editable. Download it and make adjustments in color, background, font etc. as per your unique business setting.
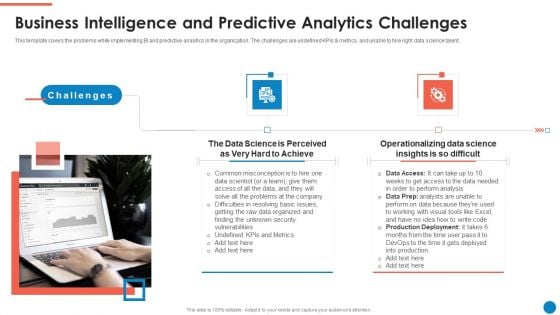
Data And Analytics Playbook Business Intelligence And Predictive Analytics Challenges Template PDF
This template covers the problems while implementing BI and predictive analytics in the organization. The challenges are undefined KPIs and metrics, and unable to hire right data science talent. Presenting Data And Analytics Playbook Business Intelligence And Predictive Analytics Challenges Template PDF to provide visual cues and insights. Share and navigate important information on two stages that need your due attention. This template can be used to pitch topics like Challenges, Data Science, Operationalizing Data Science. In addtion, this PPT design contains high resolution images, graphics, etc, that are easily editable and available for immediate download.
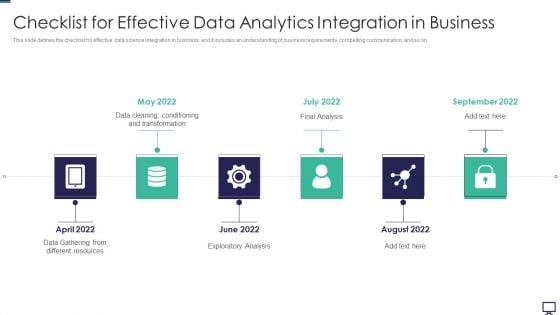
Checklist For Effective Data Analytics Integration In Business Resources Ppt Visual Aids PDF
This slide defines the checklist for effective data science integration in business, and it includes an understanding of business requirements, compelling communication, and so on. Presenting checklist for effective data analytics integration in business resources ppt visual aids pdf to provide visual cues and insights. Share and navigate important information on six stages that need your due attention. This template can be used to pitch topics like resources, analysis. In addtion, this PPT design contains high resolution images, graphics, etc, that are easily editable and available for immediate download.
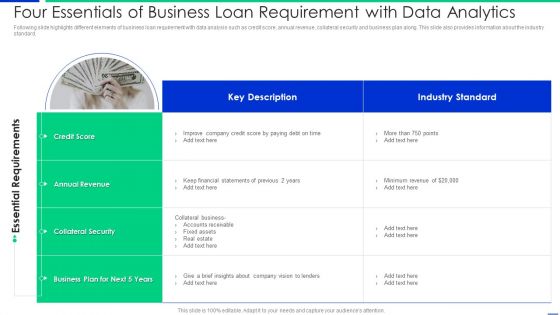
Four Essentials Of Business Loan Requirement With Data Analytics Information PDF
Following slide highlights different elements of business loan requirement with data analysis such as credit score, annual revenue, collateral security and business plan along. This slide also provides information about the industry standard Showcasing this set of slides titled four essentials of business loan requirement with data analytics information pdf. The topics addressed in these templates are financial, collateral security, annual revenue. All the content presented in this PPT design is completely editable. Download it and make adjustments in color, background, font etc. as per your unique business setting.
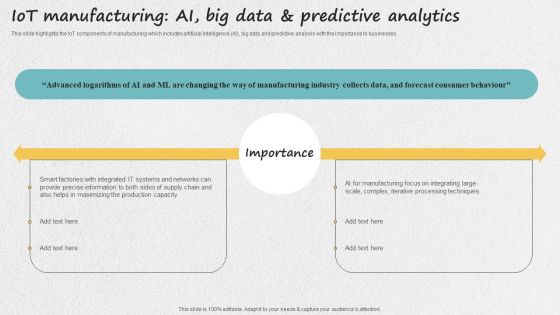
Iot Applications For Manufacturing Industry Iot Manufacturing AI Big Data And Predictive Analytics Mockup PDF
This slide highlights the IoT components of manufacturing which includes artificial intelligence AI, big data and predictive analysis with the importance to businesses. Take your projects to the next level with our ultimate collection of Iot Applications For Manufacturing Industry Iot Manufacturing AI Big Data And Predictive Analytics Mockup PDF. Slidegeeks has designed a range of layouts that are perfect for representing task or activity duration, keeping track of all your deadlines at a glance. Tailor these designs to your exact needs and give them a truly corporate look with your own brand colors they will make your projects stand out from the rest.
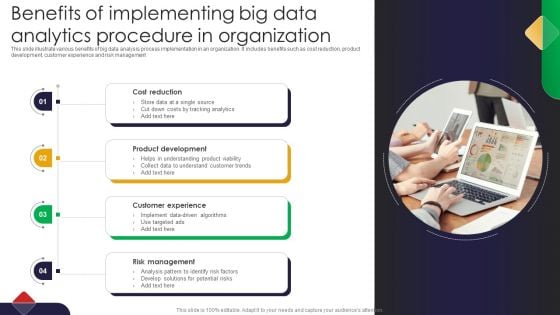
Benefits Of Implementing Big Data Analytics Procedure In Organization Introduction PDF
This slide illustrate various benefits of big data analysis process implementation in an organization. It includes benefits such as cost reduction, product development, customer experience and risk management Presenting Benefits Of Implementing Big Data Analytics Procedure In Organization Introduction PDF to dispense important information. This template comprises three stages. It also presents valuable insights into the topics including Cost Reduction, Product Development, Customer Experience. This is a completely customizable PowerPoint theme that can be put to use immediately. So, download it and address the topic impactfully.
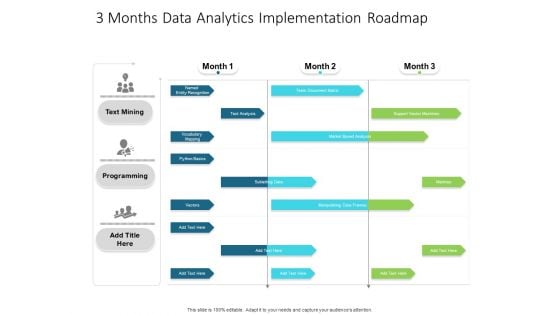
3 Months Data Analytics Implementation Roadmap Elements
Presenting our innovatively-structured 3 months data analytics implementation roadmap elements Template. Showcase your roadmap process in different formats like PDF, PNG, and JPG by clicking the download button below. This PPT design is available in both Standard Screen and Widescreen aspect ratios. It can also be easily personalized and presented with modified font size, font type, color, and shapes to measure your progress in a clear way.

3 Months Data Analytics Roadmap Structure
Introducing our 3 months data analytics roadmap structure. This PPT presentation is Google Slides compatible, therefore, you can share it easily with the collaborators for measuring the progress. Also, the presentation is available in both standard screen and widescreen aspect ratios. So edit the template design by modifying the font size, font type, color, and shapes as per your requirements. As this PPT design is fully editable it can be presented in PDF, JPG and PNG formats.
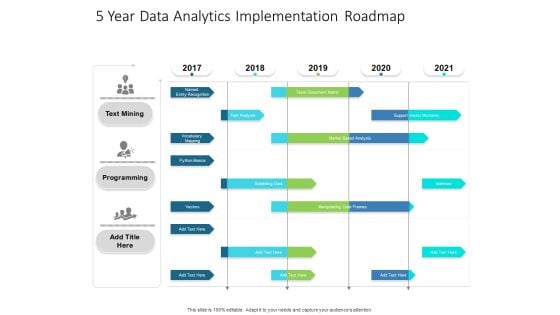
5 Year Data Analytics Implementation Roadmap Topics
Presenting our innovatively-structured 5 year data analytics implementation roadmap topics Template. Showcase your roadmap process in different formats like PDF, PNG, and JPG by clicking the download button below. This PPT design is available in both Standard Screen and Widescreen aspect ratios. It can also be easily personalized and presented with modified font size, font type, color, and shapes to measure your progress in a clear way.

5 Year Data Analytics Roadmap Infographics
Introducing our 5 year data analytics roadmap infographics. This PPT presentation is Google Slides compatible, therefore, you can share it easily with the collaborators for measuring the progress. Also, the presentation is available in both standard screen and widescreen aspect ratios. So edit the template design by modifying the font size, font type, color, and shapes as per your requirements. As this PPT design is fully editable it can be presented in PDF, JPG and PNG formats.
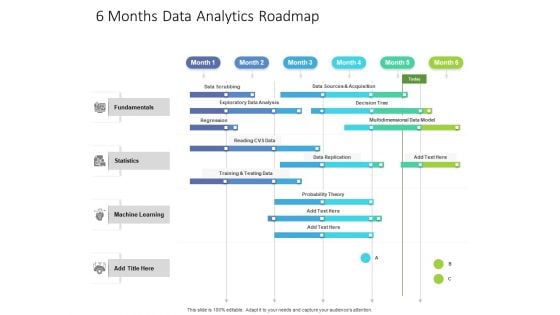
6 Months Data Analytics Roadmap Diagrams
Presenting our innovatively-structured 6 months data analytics roadmap diagrams Template. Showcase your roadmap process in different formats like PDF, PNG, and JPG by clicking the download button below. This PPT design is available in both Standard Screen and Widescreen aspect ratios. It can also be easily personalized and presented with modified font size, font type, color, and shapes to measure your progress in a clear way.
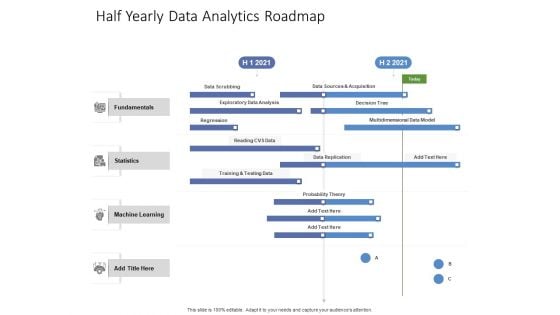
Half Yearly Data Analytics Roadmap Ideas
Presenting our innovatively-structured half yearly data analytics roadmap ideas Template. Showcase your roadmap process in different formats like PDF, PNG, and JPG by clicking the download button below. This PPT design is available in both Standard Screen and Widescreen aspect ratios. It can also be easily personalized and presented with modified font size, font type, color, and shapes to measure your progress in a clear way.
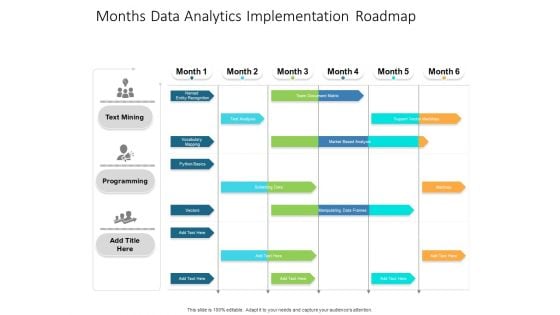
Months Data Analytics Implementation Roadmap Structure
Presenting our jaw-dropping months data analytics implementation roadmap structure. You can alternate the color, font size, font type, and shapes of this PPT layout according to your strategic process. This PPT presentation is compatible with Google Slides and is available in both standard screen and widescreen aspect ratios. You can also download this well-researched PowerPoint template design in different formats like PDF, JPG, and PNG. So utilize this visually-appealing design by clicking the download button given below.
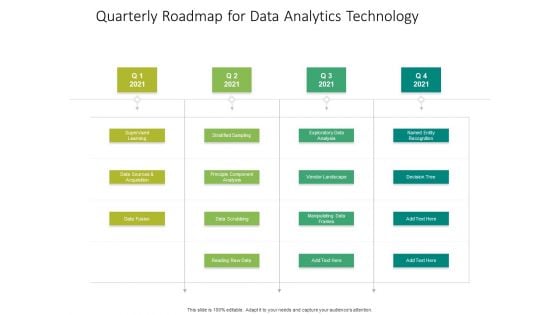
Quarterly Roadmap For Data Analytics Technology Slides
Presenting our jaw-dropping quarterly roadmap for data analytics technology slides. You can alternate the color, font size, font type, and shapes of this PPT layout according to your strategic process. This PPT presentation is compatible with Google Slides and is available in both standard screen and widescreen aspect ratios. You can also download this well-researched PowerPoint template design in different formats like PDF, JPG, and PNG. So utilize this visually-appealing design by clicking the download button given below.
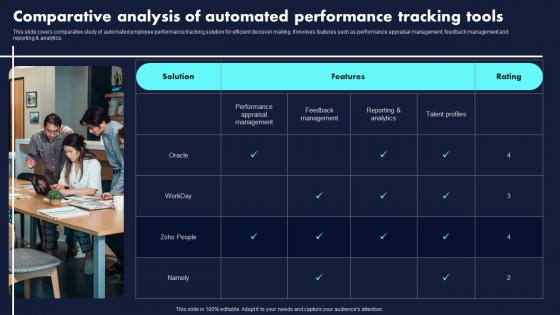
Comparative Analysis Of Automated Proven Techniques For Enhancing Infographics Pdf
This slide covers comparative study of automated employee performance tracking solution for efficient decision making. It involves features such as performance appraisal management, feedback management and reporting analytics.The Comparative Analysis Of Automated Proven Techniques For Enhancing Infographics Pdf is a compilation of the most recent design trends as a series of slides. It is suitable for any subject or industry presentation, containing attractive visuals and photo spots for businesses to clearly express their messages. This template contains a variety of slides for the user to input data, such as structures to contrast two elements, bullet points, and slides for written information. Slidegeeks is prepared to create an impression. This slide covers comparative study of automated employee performance tracking solution for efficient decision making. It involves features such as performance appraisal management, feedback management and reporting analytics.
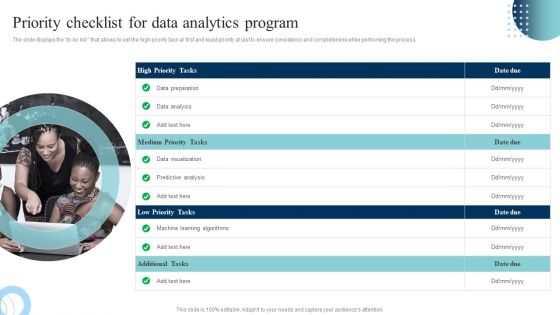
Data Evaluation And Processing Toolkit Priority Checklist For Data Analytics Program Pictures PDF
The slide displays the to do list that allows to set the high priority task at first and least priority at last to ensure consistency and completeness while performing the process. From laying roadmaps to briefing everything in detail, our templates are perfect for you. You can set the stage with your presentation slides. All you have to do is download these easy-to-edit and customizable templates. Data Evaluation And Processing Toolkit Priority Checklist For Data Analytics Program Pictures PDF will help you deliver an outstanding performance that everyone would remember and praise you for. Do download this presentation today.
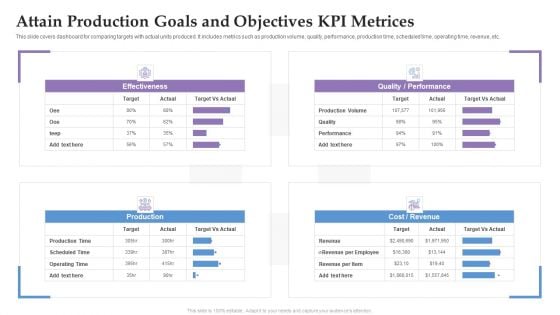
Attain Production Goals And Objectives KPI Metrices Ppt Summary Format Ideas PDF
This slide covers dashboard for comparing targets with actual units produced. It includes metrics such as production volume, quality, performance, production time, scheduled time, operating time, revenue, etc. Pitch your topic with ease and precision using this Attain Production Goals And Objectives KPI Metrices Ppt Summary Format Ideas PDF. This layout presents information on Production, Cost, Revenue, Performance. It is also available for immediate download and adjustment. So, changes can be made in the color, design, graphics or any other component to create a unique layout.
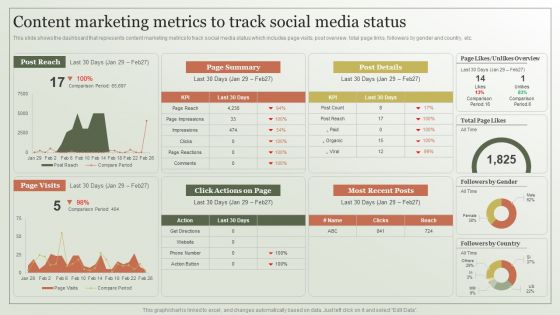
Content Marketing Strategy Content Marketing Metrics To Track Social Media Template PDF
This slide shows the dashboard that represents content marketing metrics to track social media status which includes page visits, post overview, total page links, followers by gender and country, etc. Slidegeeks is one of the best resources for PowerPoint templates. You can download easily and regulate Content Marketing Strategy Content Marketing Metrics To Track Social Media Template PDFfor your personal presentations from our wonderful collection. A few clicks is all it takes to discover and get the most relevant and appropriate templates. Use our Templates to add a unique zing and appeal to your presentation and meetings. All the slides are easy to edit and you can use them even for advertisement purposes.
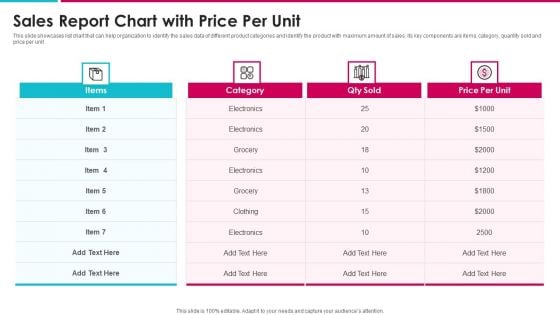
Sales Report Chart With Price Per Unit Information PDF
This slide showcases list chart that can help organization to identify the sales data of different product categories and identify the product with maximum amount of sales. Its key components are items, category, quantity sold and price per unit Showcasing this set of slides titled sales report chart with price per unit information pdf. The topics addressed in these templates are sales report chart with price per unit. All the content presented in this PPT design is completely editable. Download it and make adjustments in color, background, font etc. as per your unique business setting.
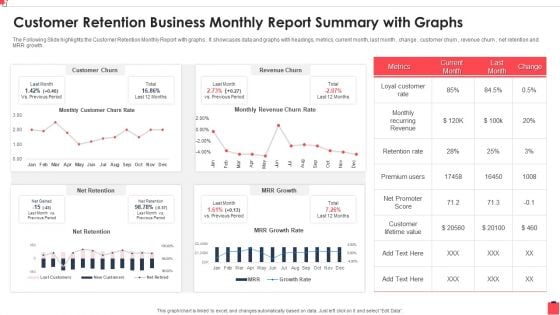
Customer Retention Business Monthly Report Summary With Graphs Guidelines PDF
The Following Slide highlights the Customer Retention Monthly Report with graphs . It showcases data and graphs with headings, metrics, current month, last month , change , customer churn , revenue churn , net retention and MRR growth. Showcasing this set of slides titled Customer Retention Business Monthly Report Summary With Graphs Guidelines PDF The topics addressed in these templates are Recurring Revenue, Customer Churn, Promoter Score All the content presented in this PPT design is completely editable. Download it and make adjustments in color, background, font etc. as per your unique business setting.
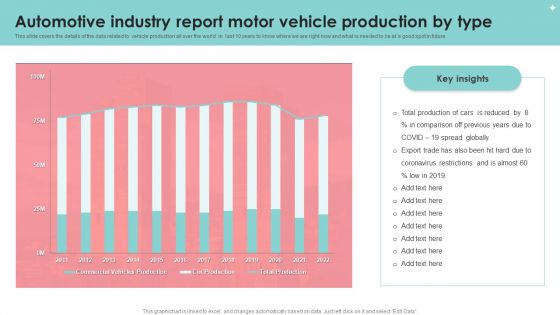
Automotive Industry Report Motor Vehicle Production By Type Portrait PDF
This slide covers the details of the data related to vehicle production all over the world in last 10 years to know where we are right now and what is needed to be at a good spot in future. Pitch your topic with ease and precision using this Automotive Industry Report Motor Vehicle Production By Type Portrait PDF. This layout presents information on Automotive Industry Report, Motor Vehicle Production. It is also available for immediate download and adjustment. So, changes can be made in the color, design, graphics or any other component to create a unique layout.
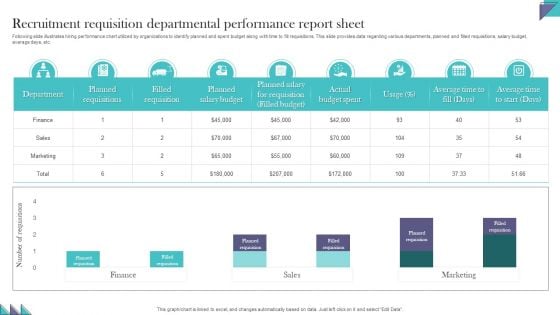
Recruitment Requisition Departmental Performance Report Sheet Demonstration PDF
Following slide illustrates hiring performance chart utilized by organizations to identify planned and spent budget along with time to fill requisitions. This slide provides data regarding various departments, planned and filled requisitions, salary budget, average days, etc. Pitch your topic with ease and precision using this Recruitment Requisition Departmental Performance Report Sheet Demonstration PDF. This layout presents information on Recruitment Requisition, Departmental Performance, Report Sheet. It is also available for immediate download and adjustment. So, changes can be made in the color, design, graphics or any other component to create a unique layout.
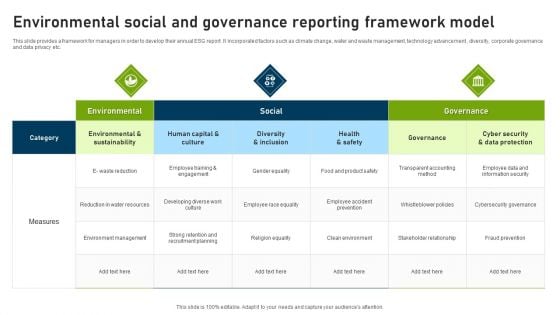
Environmental Social And Governance Reporting Framework Model Demonstration PDF
This slide provides a framework for managers in order to develop their annual ESG report. It incorporated factors such as climate change, water and waste management, technology advancement , diversity, corporate governance and data privacy etc. Pitch your topic with ease and precision using this Environmental Social And Governance Reporting Framework Model Demonstration PDF. This layout presents information on Environmental, Social, Measures. It is also available for immediate download and adjustment. So, changes can be made in the color, design, graphics or any other component to create a unique layout.
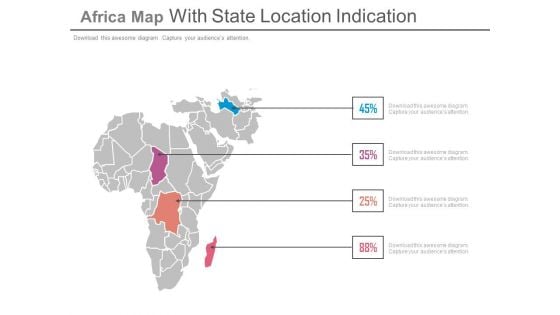
State Location On Africa Map With Percentage Data Powerpoint Slides
This PowerPoint template displays state location on Africa map with percentage data. This Map template can be used for annual growth report. This slide can also be used by school students for educational projects.
Map Of Czech With Percentage Data And Icons Powerpoint Slides
This PowerPoint template displays map of Czech with percentage data and icons. This Map template can be used for annual growth report. This slide can also be used by school students for educational projects.
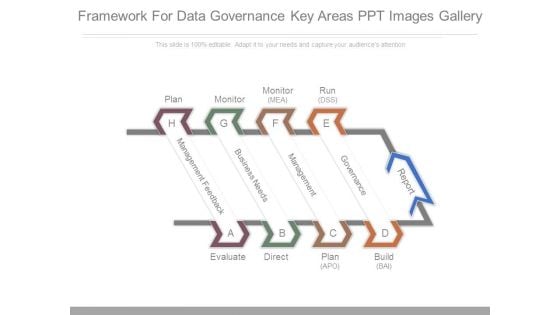
Framework For Data Governance Key Areas Ppt Images Gallery
This is a framework for data governance key areas ppt images gallery. This is a eight stage process. The stages in this process are plan, monitor, monitor, run, evaluate, direct, plan, build, report, governance, management, business needs, management feedback.
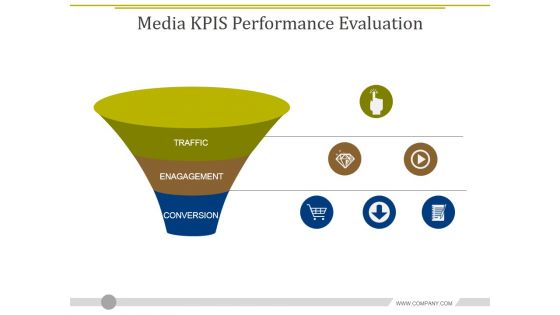
Media Kpis Performance Evaluation Ppt PowerPoint Presentation Pictures Show
This is a media kpis performance evaluation ppt powerpoint presentation pictures show. This is a three stage process. The stages in this process are traffic, engagement, conversion.
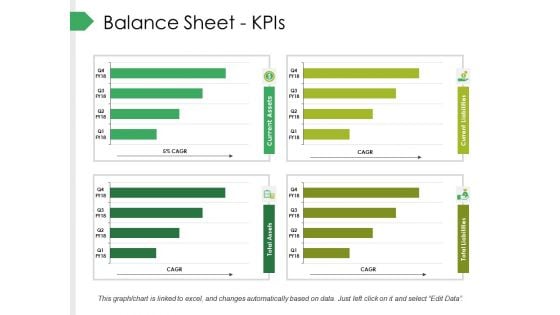
Balance Sheet Kpis Ppt PowerPoint Presentation File Picture
This is a balance sheet kpis ppt powerpoint presentation file picture. This is a four stage process. The stages in this process are business, marketing, finance, graph, cagr.
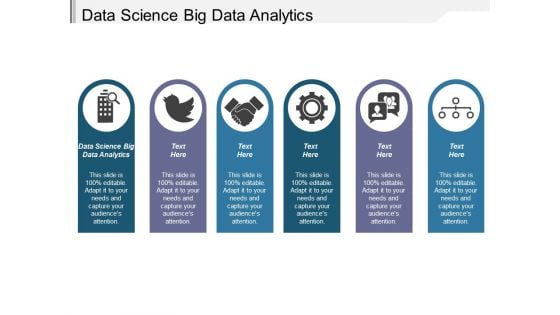
Data Science Big Data Analytics Ppt PowerPoint Presentation Gallery Shapes
This is a data science big data analytics ppt powerpoint presentation gallery shapes. This is a six stage process. The stages in this process are data science big data analytics.

Key Metrics Hotel Administration Management Beverages Business Plan Guidelines PDF
Presenting this set of slides with name key metrics hotel administration management beverages business plan guidelines pdf. The topics discussed in these slides are location, service area, marketing, miscellaneous, licensing. This is a completely editable PowerPoint presentation and is available for immediate download. Download now and impress your audience.
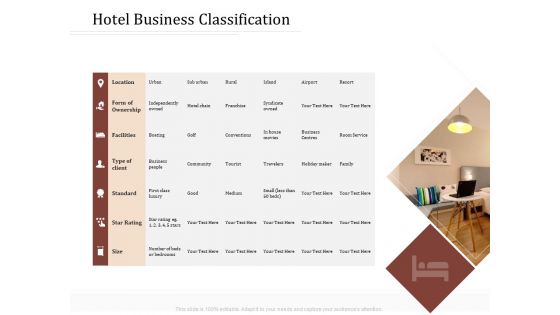
Key Metrics Hotel Administration Management Hotel Business Classification Slides PDF
Presenting this set of slides with name key metrics hotel administration management hotel business classification slides pdf. The topics discussed in these slides are location, facilities, standard, star rating, community. This is a completely editable PowerPoint presentation and is available for immediate download. Download now and impress your audience.
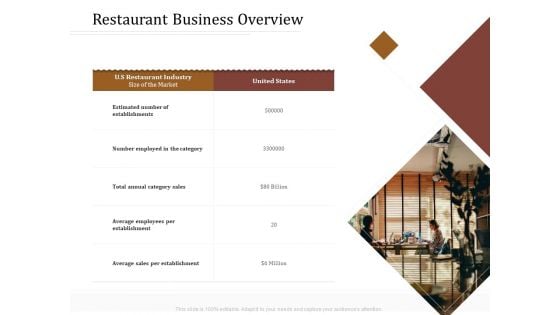
Key Metrics Hotel Administration Management Restaurant Business Overview Elements PDF
Presenting this set of slides with name key metrics hotel administration management restaurant business overview elements pdf. The topics discussed in these slides are average, sales, establishment, annual category. This is a completely editable PowerPoint presentation and is available for immediate download. Download now and impress your audience.
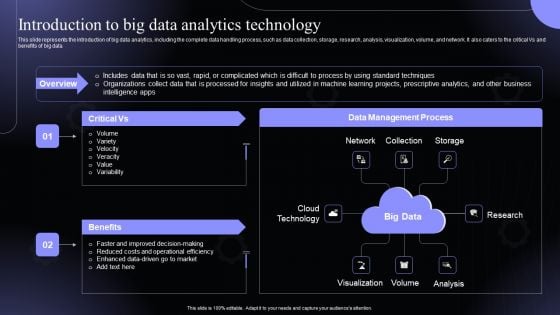
Introduction To Big Data Analytics Technology Hyperautomation Software Solutions IT Formats PDF
This slide represents the introduction of big data analytics, including the complete data handling process, such as data collection, storage, research, analysis, visualization, volume, and network. It also caters to the critical Vs and benefits of big data.Welcome to our selection of the Introduction To Big Data Analytics Technology Hyperautomation Software Solutions IT Formats PDF. These are designed to help you showcase your creativity and bring your sphere to life. Planning and Innovation are essential for any business that is just starting out. This collection contains the designs that you need for your everyday presentations. All of our PowerPoints are 100 precent editable, so you can customize them to suit your needs. This multi-purpose template can be used in various situations. Grab these presentation templates today.
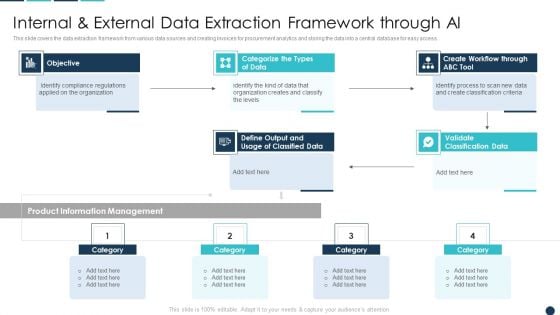
Internal And External Data Extraction Framework Through AI Guidelines PDF
This slide covers the data extraction framework from various data sources and creating invoices for procurement analytics and storing the data into a central database for easy access.Deliver an awe inspiring pitch with this creative Internal And External Data Extraction Framework Through AI Guidelines PDF bundle. Topics like Classification Data, Information Management, Compliance Regulations can be discussed with this completely editable template. It is available for immediate download depending on the needs and requirements of the user.


 Continue with Email

 Home
Home


