Snapshot
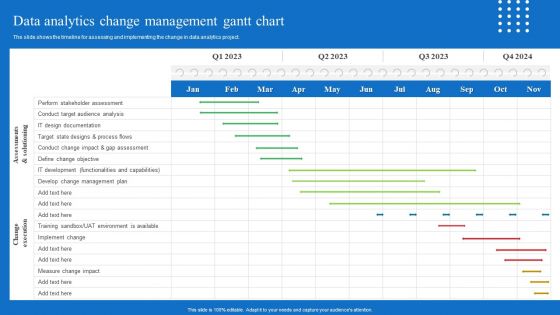
Toolkit For Data Science And Analytics Transition Data Analytics Change Management Gantt Chart Portrait PDF
The slide shows the timeline for assessing and implementing the change in data analytics project. Get a simple yet stunning designed Toolkit For Data Science And Analytics Transition Data Analytics Change Management Gantt Chart Portrait PDF It is the best one to establish the tone in your meetings. It is an excellent way to make your presentations highly effective. So, download this PPT today from Slidegeeks and see the positive impacts. Our easy to edit Toolkit For Data Science And Analytics Transition Data Analytics Change Management Gantt Chart Portrait PDF can be your go to option for all upcoming conferences and meetings. So, what are you waiting for Grab this template today.
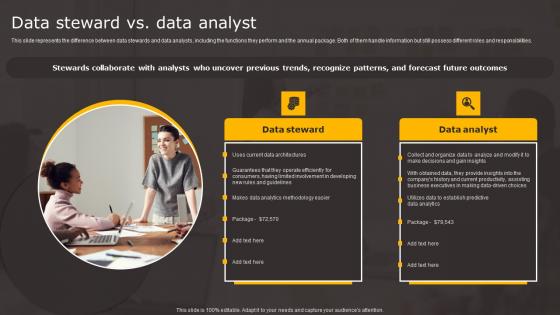
Data Stewardship In Business Processes Data Steward Vs Data Analyst Themes Pdf
This slide represents the difference between data stewards and data analysts, including the functions they perform and the annual package. Both of them handle information but still possess different roles and responsibilities. Find a pre designed and impeccable Data Stewardship In Business Processes Data Steward Vs Data Analyst Themes Pdf. The templates can ace your presentation without additional effort. You can download these easy to edit presentation templates to make your presentation stand out from others. So, what are you waiting for Download the template from Slidegeeks today and give a unique touch to your presentation. This slide represents the difference between data stewards and data analysts, including the functions they perform and the annual package. Both of them handle information but still possess different roles and responsibilities.
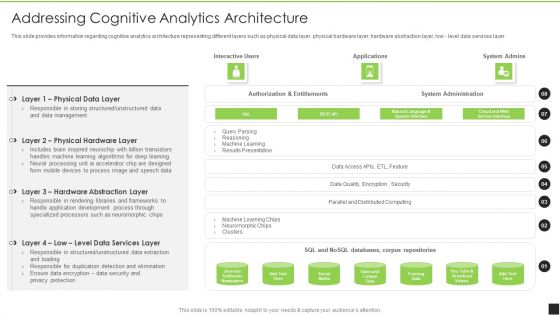
Cognitive Visualizations Computing Strategy Addressing Cognitive Analytics Contd Introduction PDF
This slide provides information regarding cognitive analytics architecture representing different layers such as physical data layer, physical hardware layer, hardware abstraction layer, low - level data services layer. Deliver and pitch your topic in the best possible manner with this Cognitive Visualizations Computing Strategy Addressing Cognitive Analytics Contd Introduction PDF. Use them to share invaluable insights on Physical Data Layer, Physical Hardware, Hardware Abstraction and impress your audience. This template can be altered and modified as per your expectations. So, grab it now.
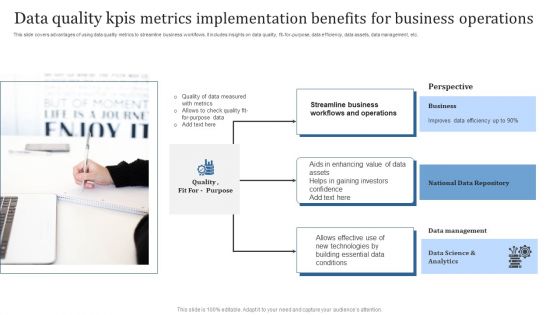
Data Quality Kpis Metrics Implementation Benefits For Business Operations Formats PDF
This slide covers advantages of using data quality metrics to streamline business workflows. It includes insights on data quality, fit-for-purpose, data efficiency, data assets, data management, etc. Presenting Data Quality Kpis Metrics Implementation Benefits For Business Operations Formats PDF to dispense important information. This template comprises Three stages. It also presents valuable insights into the topics including Business, National Data Repository, Data Management. This is a completely customizable PowerPoint theme that can be put to use immediately. So, download it and address the topic impactfully.
Projection Model Uses Of Predictive Analytics Credit Icons PDF
This slide describes the usage of predictive analytics in banking and other financial institutions for credit purposes. It is used to calculate the credit score of a person or organization and to ensure that borrower does not fail to return the loan. Crafting an eye-catching presentation has never been more straightforward. Let your presentation shine with this tasteful yet straightforward Projection Model Uses Of Predictive Analytics Credit Icons PDF template. It offers a minimalistic and classy look that is great for making a statement. The colors have been employed intelligently to add a bit of playfulness while still remaining professional. Construct the ideal Projection Model Uses Of Predictive Analytics Credit Icons PDF that effortlessly grabs the attention of your audience Begin now and be certain to wow your customers
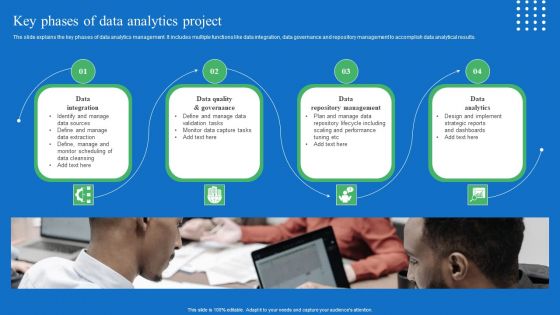
Toolkit For Data Science And Analytics Transition Key Phases Of Data Analytics Project Structure PDF
The slide explains the key phases of data analytics management. It includes multiple functions like data integration, data governance and repository management to accomplish data analytical results. Crafting an eye catching presentation has never been more straightforward. Let your presentation shine with this tasteful yet straightforward Toolkit For Data Science And Analytics Transition Key Phases Of Data Analytics Project Structure PDF template. It offers a minimalistic and classy look that is great for making a statement. The colors have been employed intelligently to add a bit of playfulness while still remaining professional. Construct the ideal Toolkit For Data Science And Analytics Transition Key Phases Of Data Analytics Project Structure PDF that effortlessly grabs the attention of your audience Begin now and be certain to wow your customers.

Administered Data And Analytic Quality Playbook The Escalating Value Of Data And Analytics Structure PDF
This template covers the facts about bigdata, business intelligence and data analytics. It also depicts that enterprise data and analytics solutions will drive growth and revenue, when optimized for different businesses.This is a Administered Data And Analytic Quality Playbook The Escalating Value Of Data And Analytics Structure PDF template with various stages. Focus and dispense information on seven stages using this creative set, that comes with editable features. It contains large content boxes to add your information on topics like Business Intelligence, Predictive Analytics, Healthcare Manufacturing You can also showcase facts, figures, and other relevant content using this PPT layout. Grab it now.
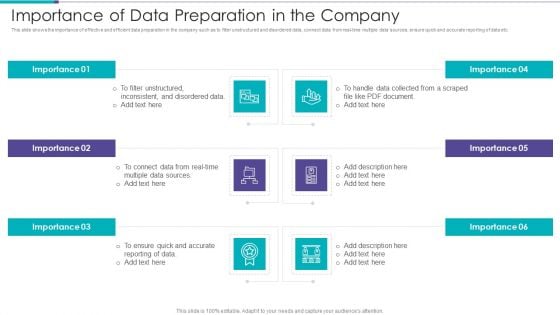
Data Preparation Infrastructure And Phases Importance Of Data Preparation In The Company Mockup PDF
This slide shows the importance of effective and efficient data preparation in the company such as to filter unstructured and disordered data, connect data from real time multiple data sources, ensure quick and accurate reporting of data etc. Presenting Data Preparation Infrastructure And Phases Importance Of Data Preparation In The Company Mockup PDF to provide visual cues and insights. Share and navigate important information on six stages that need your due attention. This template can be used to pitch topics like Filter Unstructured, Inconsistent Disordered, Handle Collected In addtion, this PPT design contains high resolution images, graphics, etc, that are easily editable and available for immediate download.
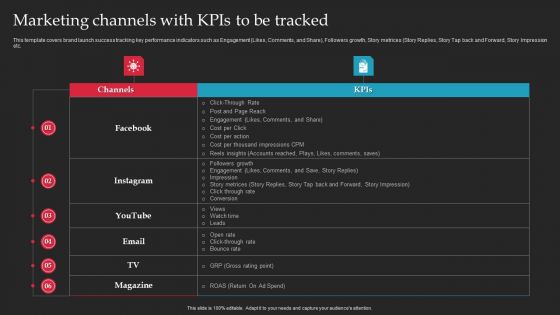
Brand Launch Checklist Marketing Channels With Kpis To Be Tracked Slides PDF
This template covers brand launch success tracking key performance indicators such as Engagement Likes, Comments, and Share, Followers growth, Story metrices Story Replies, Story Tap back and Forward, Story Impression etc. Welcome to our selection of the Brand Launch Checklist Marketing Channels With Kpis To Be Tracked Slides PDF. These are designed to help you showcase your creativity and bring your sphere to life. Planning and Innovation are essential for any business that is just starting out. This collection contains the designs that you need for your everyday presentations. All of our PowerPoints are 100 percent editable, so you can customize them to suit your needs. This multi-purpose template can be used in various situations. Grab these presentation templates today.
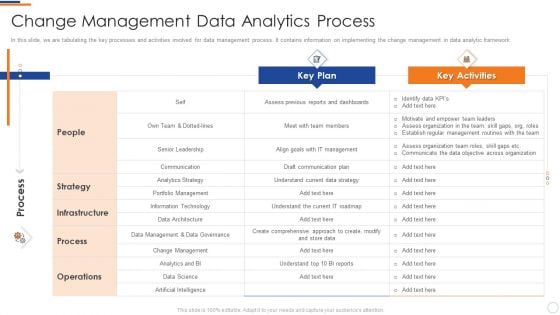
Business Intelligence And Big Data Analytics Change Management Data Analytics Process Infographics PDF
In this slide, we are tabulating the key processes and activities involved for data management process. It contains information on implementing the change management in data analytic framework. Deliver an awe inspiring pitch with this creative business intelligence and big data analytics change management data analytics process infographics pdf bundle. Topics like strategy, key plan, key activities, infrastructure can be discussed with this completely editable template. It is available for immediate download depending on the needs and requirements of the user.
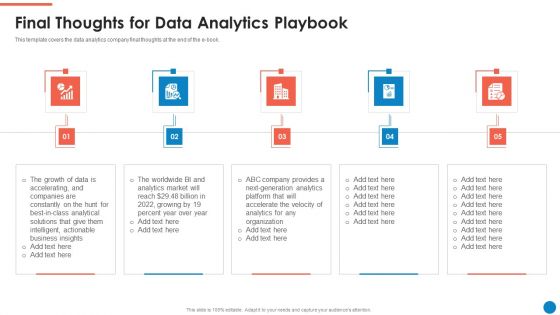
Data And Analytics Playbook Final Thoughts For Data Analytics Playbook Summary PDF
This template covers the data analytics company final thoughts at the end of the e-book. Presenting Data And Analytics Playbook Final Thoughts For Data Analytics Playbook Summary PDF to provide visual cues and insights. Share and navigate important information on five stages that need your due attention. This template can be used to pitch topics like Growth Data, Actionable Business Insights, Market. In addtion, this PPT design contains high resolution images, graphics, etc, that are easily editable and available for immediate download.
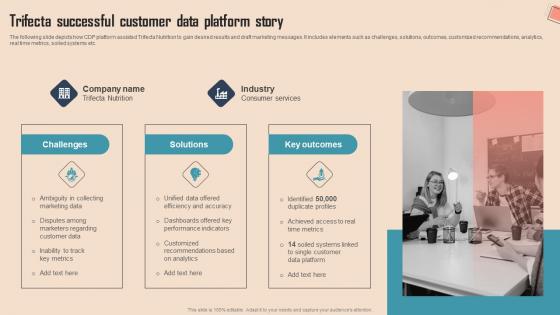
Trifecta Successful Customer Data Platform Comprehensive CDP Guide For Promoters Background Pdf
The following slide depicts how CDP platform assisted Trifecta Nutrition to gain desired results and draft marketing messages. It includes elements such as challenges, solutions, outcomes, customized recommendations, analytics, real time metrics, soiled systems etc.Do you know about Slidesgeeks Trifecta Successful Customer Data Platform Comprehensive CDP Guide For Promoters Background Pdf These are perfect for delivering any kind od presentation. Using it, create PowerPoint presentations that communicate your ideas and engage audiences. Save time and effort by using our pre-designed presentation templates that are perfect for a wide range of topic. Our vast selection of designs covers a range of styles, from creative to business, and are all highly customizable and easy to edit. Download as a PowerPoint template or use them as Google Slides themes. The following slide depicts how CDP platform assisted Trifecta Nutrition to gain desired results and draft marketing messages. It includes elements such as challenges, solutions, outcomes, customized recommendations, analytics, real time metrics, soiled systems etc.
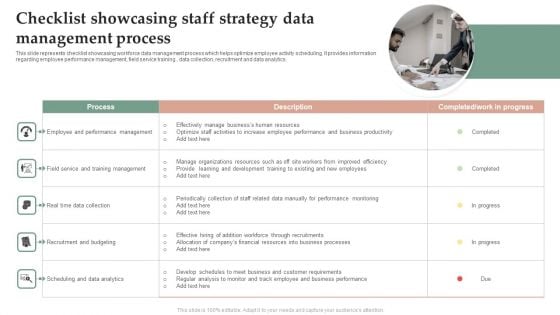
Checklist Showcasing Staff Strategy Data Management Process Information PDF
This slide represents checklist showcasing workforce data management process which helps optimize employee activity scheduling. It provides information regarding employee performance management, field service training , data collection, recruitment and data analytics. Persuade your audience using this Checklist Showcasing Staff Strategy Data Management Process Information PDF. This PPT design covers One stage, thus making it a great tool to use. It also caters to a variety of topics including Recruitment Budgeting, Scheduling Data Analytics. Download this PPT design now to present a convincing pitch that not only emphasizes the topic but also showcases your presentation skills.
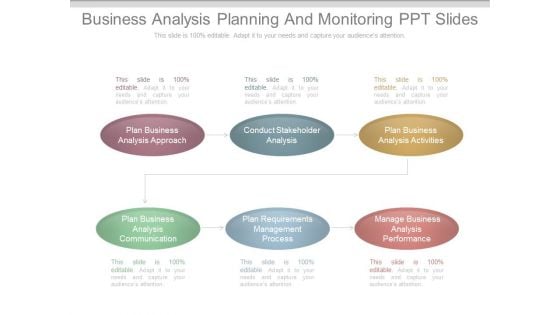
Business Analysis Planning And Monitoring Ppt Slides
This is a business analysis planning and monitoring ppt slides. This is a six stage process. The stages in this process are plan business analysis approach, conduct stakeholder analysis, plan business analysis activities, plan business analysis communication, plan requirements management process, manage business analysis performance.
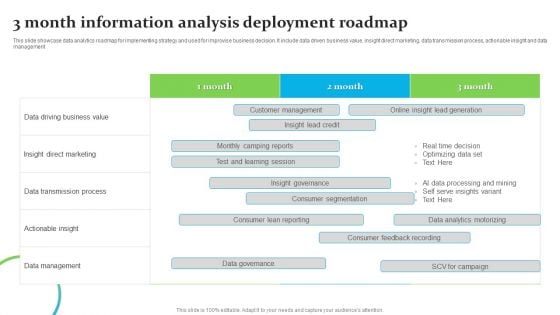
3 Month Information Analysis Deployment Roadmap Ppt Infographics Picture PDF
This slide showcase data analytics roadmap for implementing strategy and used for improvise business decision. It include data driven business value, insight direct marketing, data transmission process, actionable insight and data management. Showcasing this set of slides titled 3 Month Information Analysis Deployment Roadmap Ppt Infographics Picture PDF. The topics addressed in these templates are Insight Direct Marketing, Data Transmission Process, Actionable Insight. All the content presented in this PPT design is completely editable. Download it and make adjustments in color, background, font etc. as per your unique business setting.
Machine Learning Development And Operations Cycle IT Agenda For Machine Learning Pictures PDF
Presenting machine learning development and operations cycle it agenda for machine learning pictures pdf to provide visual cues and insights. Share and navigate important information on three stages that need your due attention. This template can be used to pitch topics like agenda In addtion, this PPT design contains high resolution images, graphics, etc, that are easily editable and available for immediate download.
Quality Audit Report Of Business With Icons Ppt PowerPoint Presentation Layouts Inspiration PDF
Pitch your topic with ease and precision using this quality audit report of business with icons ppt powerpoint presentation layouts inspiration pdf. This layout presents information on data quality audit, users and permissions audit, data cleansing performed, data migration permission received. It is also available for immediate download and adjustment. So, changes can be made in the color, design, graphics or any other component to create a unique layout.
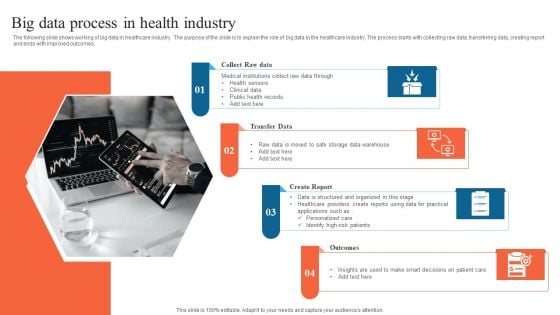
Big Data Process In Health Industry Ideas PDF
The following slide shows working of big data in healthcare industry. The purpose of the slide is to explain the role of big data in the healthcare industry. The process starts with collecting raw data, transferring data, creating report and ends with improved outcomes. Presenting Big Data Process In Health Industry Ideas PDF to dispense important information. This template comprises four stages. It also presents valuable insights into the topics including Collect Raw Data, Transfer Data, Create Report. This is a completely customizable PowerPoint theme that can be put to use immediately. So, download it and address the topic impactfully.
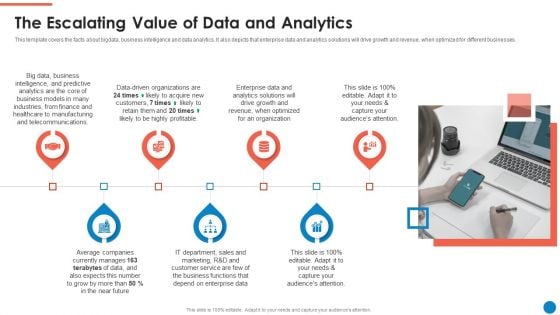
Data And Analytics Playbook The Escalating Value Of Data And Analytics Formats PDF
This template covers the facts about bigdata, business intelligence and data analytics. It also depicts that enterprise data and analytics solutions will drive growth and revenue, when optimized for different businesses. Presenting Data And Analytics Playbook The Escalating Value Of Data And Analytics Formats PDF to provide visual cues and insights. Share and navigate important information on seven stages that need your due attention. This template can be used to pitch topics like Big Data, Business Intelligence, Finance And Healthcare, Organization. In addtion, this PPT design contains high resolution images, graphics, etc, that are easily editable and available for immediate download.
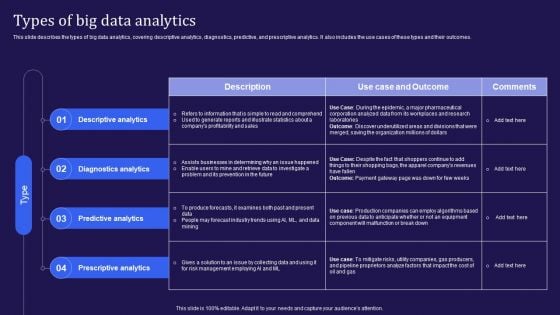
Big Data Analytics Lifecycle Types Of Big Data Analytics Ppt Infographic Template Shapes PDF
This slide describes the types of big data analytics, covering descriptive analytics, diagnostics, predictive, and prescriptive analytics. It also includes the use cases of these types and their outcomes. Get a simple yet stunning designed Big Data Analytics Lifecycle Types Of Big Data Analytics Ppt Infographic Template Shapes PDF. It is the best one to establish the tone in your meetings. It is an excellent way to make your presentations highly effective. So, download this PPT today from Slidegeeks and see the positive impacts. Our easy-to-edit Big Data Analytics Lifecycle Types Of Big Data Analytics Ppt Infographic Template Shapes PDF can be your go-to option for all upcoming conferences and meetings. So, what are you waiting for Grab this template today.
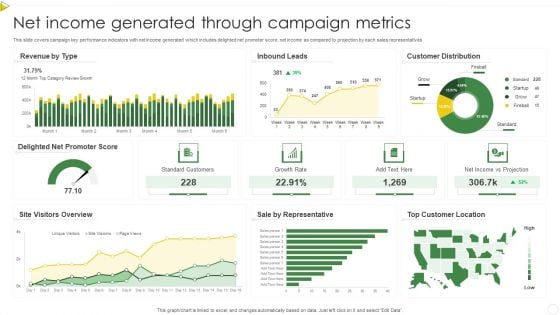
Net Income Generated Through Campaign Metrics Summary PDF
This slide covers campaign key performance indicators with net income generated which includes delighted net promoter score, net income as compared to projection by each sales representatives. Pitch your topic with ease and precision using this Net Income Generated Through Campaign Metrics Summary PDF. This layout presents information on Standard Customers, Growth Rate, Net Income. It is also available for immediate download and adjustment. So, changes can be made in the color, design, graphics or any other component to create a unique layout.
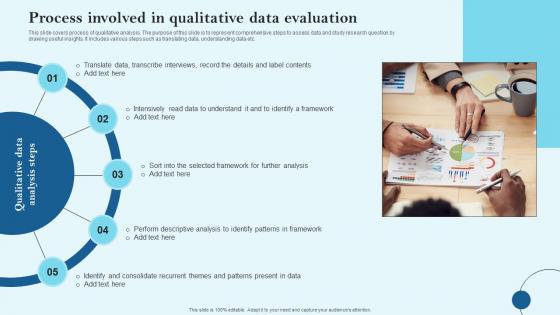
Process Involved In Qualitative Data Evaluation Infographics Pdf
This slide covers process of qualitative analysis. The purpose of this slide is to represent comprehensive steps to assess data and study research question by drawing useful insights. It includes various steps such as translating data, understanding data etc. Pitch your topic with ease and precision using this Process Involved In Qualitative Data Evaluation Infographics Pdf This layout presents information on Qualitative Data, Analysis Steps, Framework It is also available for immediate download and adjustment. So, changes can be made in the color, design, graphics or any other component to create a unique layout. This slide covers process of qualitative analysis. The purpose of this slide is to represent comprehensive steps to assess data and study research question by drawing useful insights. It includes various steps such as translating data, understanding data etc.
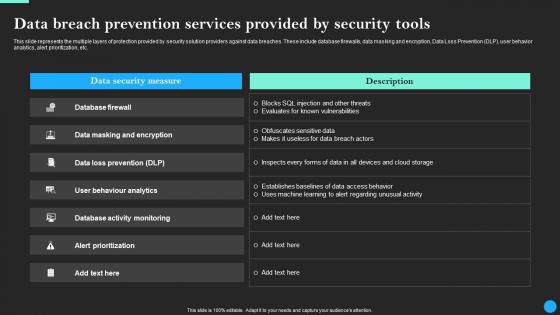
Data Breach Prevention Services Provided Data Breach Prevention Graphics Pdf
This slide represents the multiple layers of protection provided by security solution providers against data breaches. These include database firewalls, data masking and encryption, Data Loss Prevention DLP, user behavior analytics, alert prioritization, etc. Are you in need of a template that can accommodate all of your creative concepts This one is crafted professionally and can be altered to fit any style. Use it with Google Slides or PowerPoint. Include striking photographs, symbols, depictions, and other visuals. Fill, move around, or remove text boxes as desired. Test out color palettes and font mixtures. Edit and save your work, or work with colleagues. Download Data Breach Prevention Services Provided Data Breach Prevention Graphics Pdfand observe how to make your presentation outstanding. Give an impeccable presentation to your group and make your presentation unforgettable. This slide represents the multiple layers of protection provided by security solution providers against data breaches. These include database firewalls, data masking and encryption, Data Loss Prevention DLP, user behavior analytics, alert prioritization, etc.
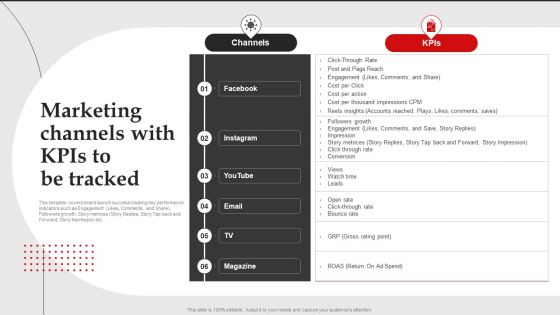
Marketing Channels With Kpis To Be Tracked Brand Introduction Plan Brochure PDF
This template covers brand launch success tracking key performance indicators such as Engagement Likes, Comments, and Share, Followers growth, Story metrices Story Replies, Story Tap back and Forward, Story Impression etc.Slidegeeks is one of the best resources for PowerPoint templates. You can download easily and regulate Marketing Channels With Kpis To Be Tracked Brand Introduction Plan Brochure PDF for your personal presentations from our wonderful collection. A few clicks is all it takes to discover and get the most relevant and appropriate templates. Use our Templates to add a unique zing and appeal to your presentation and meetings. All the slides are easy to edit and you can use them even for advertisement purposes.
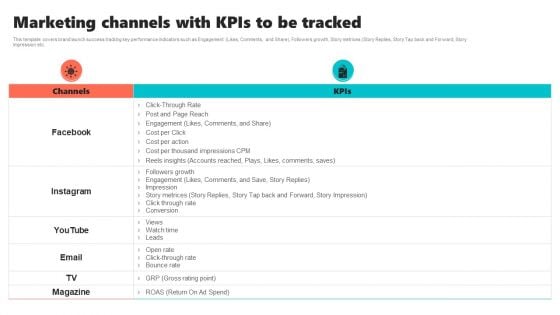
New Brand Introduction Plan Marketing Channels With Kpis To Be Tracked Sample PDF
This template covers brand launch success tracking key performance indicators such as Engagement Likes, Comments, and Share, Followers growth, Story metrices Story Replies, Story Tap back and Forward, Story Impression etc.Are you in need of a template that can accommodate all of your creative concepts This one is crafted professionally and can be altered to fit any style. Use it with Google Slides or PowerPoint. Include striking photographs, symbols, depictions, and other visuals. Fill, move around, or remove text boxes as desired. Test out color palettes and font mixtures. Edit and save your work, or work with colleagues. Download New Brand Introduction Plan Marketing Channels With Kpis To Be Tracked Sample PDF and observe how to make your presentation outstanding. Give an impeccable presentation to your group and make your presentation unforgettable.
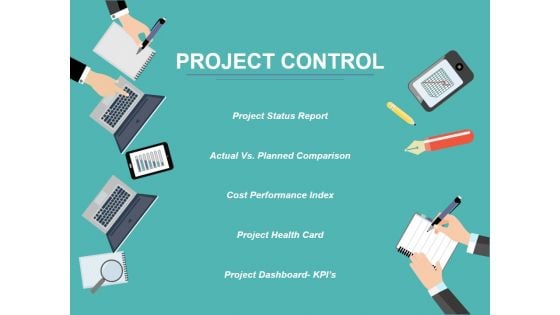
Project Control Ppt PowerPoint Presentation Ideas Graphics Template
This is a project control ppt powerpoint presentation ideas graphics template. This is a five stage process. The stages in this process are project status report, actual vs planned comparison, cost performance index, project health card, project dashboard kpis.
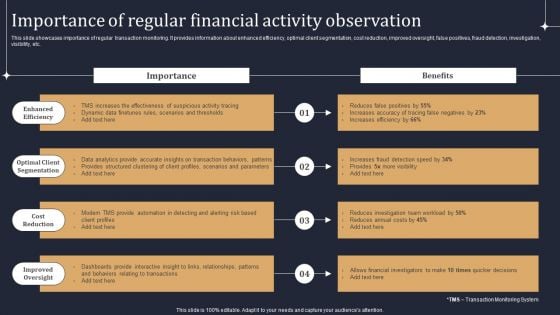
KYC Transaction Monitoring System Business Security Importance Of Regular Financial Activity Observation Elements PDF
This slide showcases importance of regular transaction monitoring. It provides information about enhanced efficiency, optimal client segmentation, cost reduction, improved oversight, false positives, fraud detection, investigation, visibility, etc. Slidegeeks is one of the best resources for PowerPoint templates. You can download easily and regulate KYC Transaction Monitoring System Business Security Importance Of Regular Financial Activity Observation Elements PDF for your personal presentations from our wonderful collection. A few clicks is all it takes to discover and get the most relevant and appropriate templates. Use our Templates to add a unique zing and appeal to your presentation and meetings. All the slides are easy to edit and you can use them even for advertisement purposes.
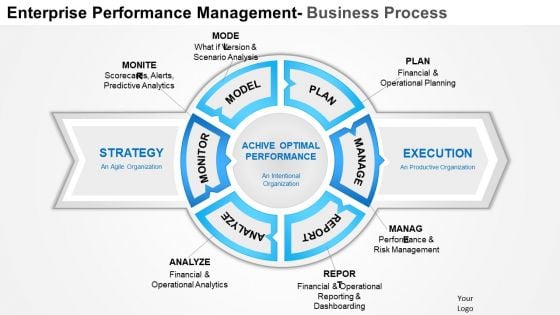
Business Framework Enterprise Performance Management PowerPoint Presentation
This image slide has been designed to depict enterprise performance management diagram. This image slide displays business planning and forecasting. This image slide may be used to exhibit business performance management in your presentations. This image slide will give edge to your presentations.
Business Diagram Key With Tags For Success Planning Presentation Template
This business diagram slide has been designed with graphics of key with tags. You may use this slide to depict success planning. Download this diagram slide to make impressive presentations.
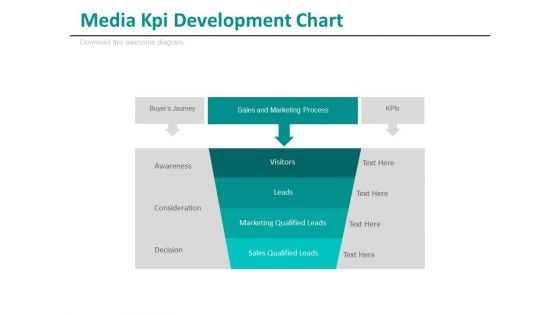
Media Kpi Development Chart Ppt Slides
This is a media KPI development chart ppt slides. This is a one stage process. The stages in this process are business, media, success.
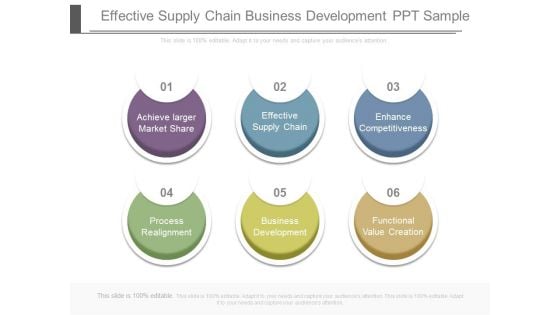
Effective Supply Chain Business Development Ppt Sample
This is an effective supply chain business development ppt sample. This is a six stage process. The stages in this process are chains, success, marketing.
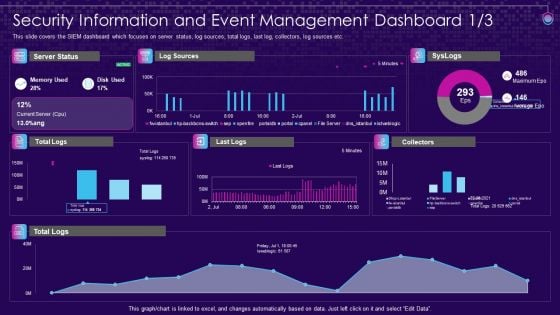
SIEM Services Security Information And Event Management Ppt File Objects PDF
This slide covers the SIEM dashboard which focuses on security events, event categories, data sources, logger event, multiple events, etc. Deliver an awe inspiring pitch with this creative siem services security information and event management ppt file objects pdf bundle. Topics like security information and event management dashboard can be discussed with this completely editable template. It is available for immediate download depending on the needs and requirements of the user.
Controlling And Innovating Product Leader Responsibilities Tracking Essential Product Management Information Pdf
This slide provides information regarding essential product management activities tracking dashboard in terms of project budget, workload, overdue tasks, etc. Deliver and pitch your topic in the best possible manner with this controlling and innovating product leader responsibilities tracking essential product management information pdf. Use them to share invaluable insights on update twitter profile, e commerce dashboard, hire data scientist and impress your audience. This template can be altered and modified as per your expectations. So, grab it now.
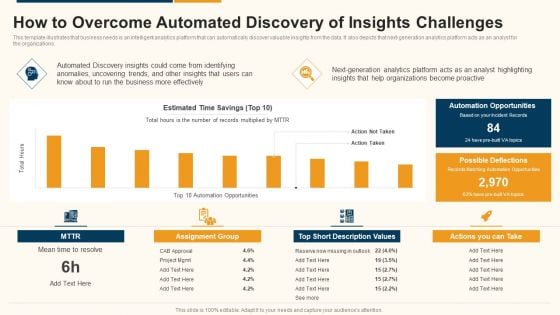
Data Interpretation And Analysis Playbook How To Overcome Automated Discovery Of Insights Challenges Rules PDF
This template illustrates that business needs is an intelligent analytics platform that can automatically discover valuable insights from the data. It also depicts that next-generation analytics platform acts as an analyst for the organizations. Deliver an awe inspiring pitch with this creative data interpretation and analysis playbook how to overcome automated discovery of insights challenges rules pdf bundle. Topics like opportunities, organizations, analytics, business can be discussed with this completely editable template. It is available for immediate download depending on the needs and requirements of the user.
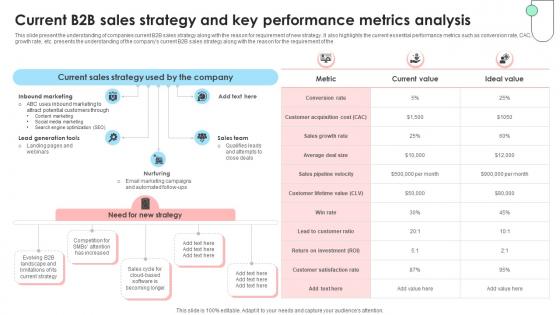
Navigating B2B Sales Current B2B Sales Strategy And Key Performance SA SS V
This slide present the understanding of companies current B2B sales strategy along with the reason for requirement of new strategy. It also highlights the current essential performance metrics such as conversion rate, CAC, growth rate, etc. presents the understanding of the companys current B2B sales strategy along with the reason for the requirement of the. Retrieve professionally designed Navigating B2B Sales Current B2B Sales Strategy And Key Performance SA SS V to effectively convey your message and captivate your listeners. Save time by selecting pre-made slideshows that are appropriate for various topics, from business to educational purposes. These themes come in many different styles, from creative to corporate, and all of them are easily adjustable and can be edited quickly. Access them as PowerPoint templates or as Google Slides themes. You do not have to go on a hunt for the perfect presentation because Slidegeeks got you covered from everywhere. This slide present the understanding of companies current B2B sales strategy along with the reason for requirement of new strategy. It also highlights the current essential performance metrics such as conversion rate, CAC, growth rate, etc. presents the understanding of the companys current B2B sales strategy along with the reason for the requirement of the
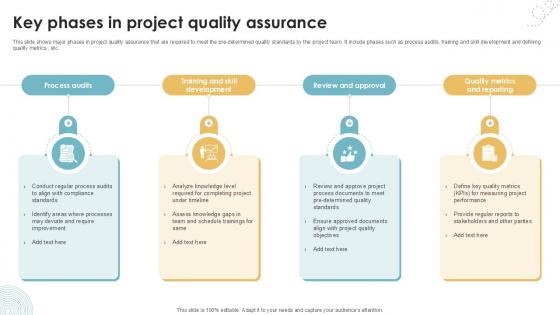
Key Phases In Project Quality Assurance Executing Quality Ppt Presentation PM SS V
This slide shows major phases in project quality assurance that are required to meet the pre determined quality standards by the project team. It include phases such as process audits, training and skill development and defining quality metrics , etc. Retrieve professionally designed Key Phases In Project Quality Assurance Executing Quality Ppt Presentation PM SS V to effectively convey your message and captivate your listeners. Save time by selecting pre-made slideshows that are appropriate for various topics, from business to educational purposes. These themes come in many different styles, from creative to corporate, and all of them are easily adjustable and can be edited quickly. Access them as PowerPoint templates or as Google Slides themes. You do not have to go on a hunt for the perfect presentation because Slidegeeks got you covered from everywhere. This slide shows major phases in project quality assurance that are required to meet the pre determined quality standards by the project team. It include phases such as process audits, training and skill development and defining quality metrics , etc.
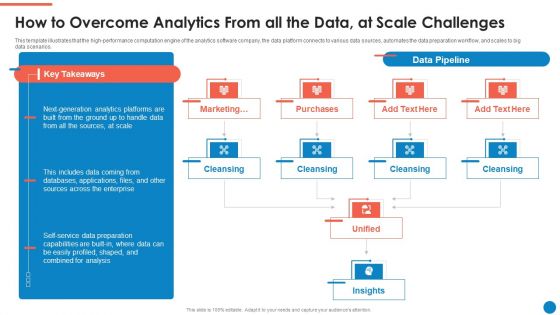
Data And Analytics Playbook How To Overcome Analytics From All The Data At Professional PDF
This template illustrates that the high-performance computation engine of the analytics software company, the data platform connects to various data sources, automates the data preparation workflow, and scales to big data scenarios. Presenting Data And Analytics Playbook How To Overcome Analytics From All The Data At Professional PDF to provide visual cues and insights. Share and navigate important information on ten stages that need your due attention. This template can be used to pitch topics like Marketing, Purchases, Cleansing, Insights, Unified. In addtion, this PPT design contains high resolution images, graphics, etc, that are easily editable and available for immediate download.
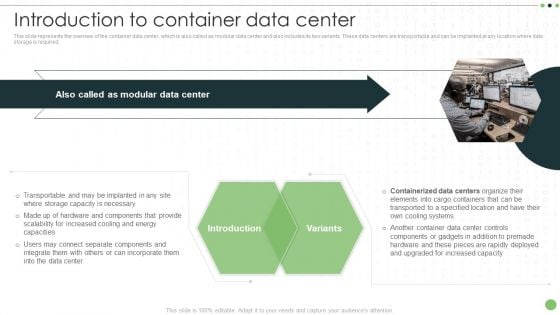
Different Categories Of Data Centers Introduction To Container Data Center Download PDF
This slide represents the overview of the container data center, which is also called as modular data center and also includes its two variants. These data centers are transportable and can be implanted at any location where data storage is required. Make sure to capture your audiences attention in your business displays with our gratis customizable Different Categories Of Data Centers Introduction To Container Data Center Download PDF. These are great for business strategies, office conferences, capital raising or task suggestions. If you desire to acquire more customers for your tech business and ensure they stay satisfied, create your own sales presentation with these plain slides.

Toolkit For Data Science And Analytics Transition Key Failure Reasons For Data Analytics Project Structure PDF
This slide displays the key reasons for why the data analytics project fails. It includes reasons such as incorrect data, poor communication structure, and conflicting data etc. Find highly impressive Toolkit For Data Science And Analytics Transition Key Failure Reasons For Data Analytics Project Structure PDF on Slidegeeks to deliver a meaningful presentation. You can save an ample amount of time using these presentation templates. No need to worry to prepare everything from scratch because Slidegeeks experts have already done a huge research and work for you. You need to download Toolkit For Data Science And Analytics Transition Key Failure Reasons For Data Analytics Project Structure PDF for your upcoming presentation. All the presentation templates are 100 percent editable and you can change the color and personalize the content accordingly. Download now.
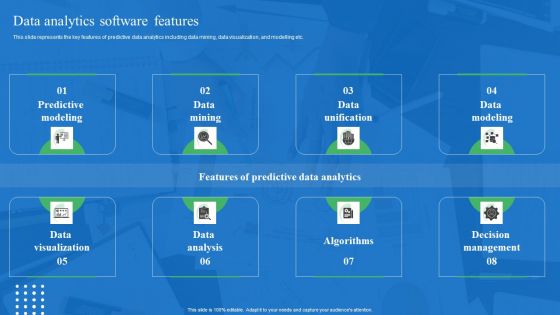
Toolkit For Data Science And Analytics Transition Data Analytics Software Features Inspiration PDF
This slide represents the key features of predictive data analytics including data mining, data visualization, and modelling etc. Do you have to make sure that everyone on your team knows about any specific topic I yes, then you should give Toolkit For Data Science And Analytics Transition Data Analytics Software Features Inspiration PDF a try. Our experts have put a lot of knowledge and effort into creating this impeccable Toolkit For Data Science And Analytics Transition Data Analytics Software Features Inspiration PDF. You can use this template for your upcoming presentations, as the slides are perfect to represent even the tiniest detail. You can download these templates from the Slidegeeks website and these are easy to edit. So grab these today.
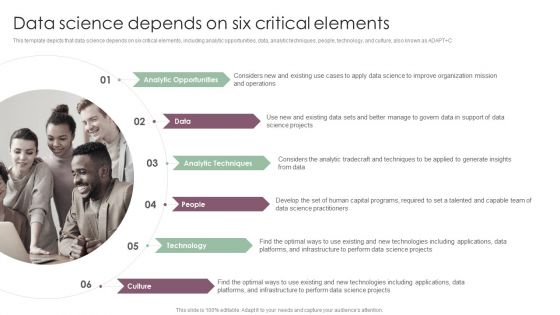
Information Analysis And BI Playbook Data Science Depends On Six Critical Elements Designs PDF
This template depicts that data science depends on six critical elements, including analytic opportunities, data, analytic techniques, people, technology, and culture, also known as ADAPT C. There are so many reasons you need a Information Analysis And BI Playbook Data Science Depends On Six Critical Elements Designs PDF. The first reason is you can not spend time making everything from scratch, Thus, Slidegeeks has made presentation templates for you too. You can easily download these templates from our website easily.
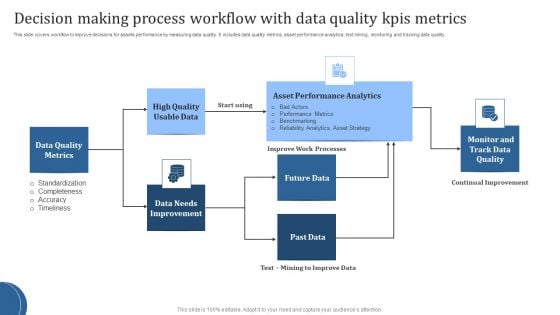
Decision Making Process Workflow With Data Quality Kpis Metrics Download PDF
This slide covers workflow to improve decisions for assets performance by measuring data quality. It includes data quality metrics, asset performance analytics, text mining, monitoring and tracking data quality. Presenting Decision Making Process Workflow With Data Quality Kpis Metrics Download PDF to dispense important information. This template comprises Seven stages. It also presents valuable insights into the topics including Data Quality Metrics, Data Needs Improvement. This is a completely customizable PowerPoint theme that can be put to use immediately. So, download it and address the topic impactfully.
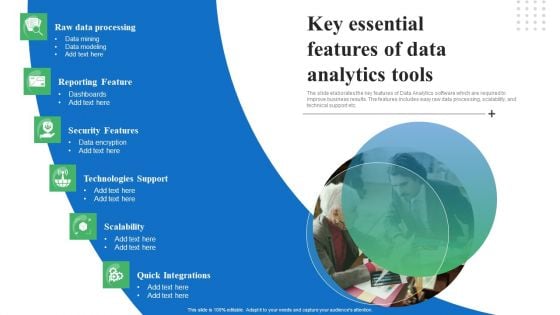
Toolkit For Data Science And Analytics Transition Key Essential Features Of Data Analytics Tools Elements PDF
The slide elaborates the key features of Data Analytics software which are required to improve business results. The features includes easy raw data processing, scalability, and technical support etc. Whether you have daily or monthly meetings, a brilliant presentation is necessary. Toolkit For Data Science And Analytics Transition Key Essential Features Of Data Analytics Tools Elements PDF can be your best option for delivering a presentation. Represent everything in detail using Toolkit For Data Science And Analytics Transition Key Essential Features Of Data Analytics Tools Elements PDF and make yourself stand out in meetings. The template is versatile and follows a structure that will cater to your requirements. All the templates prepared by Slidegeeks are easy to download and edit. Our research experts have taken care of the corporate themes as well. So, give it a try and see the results.
Bar Graph Analytics Vector Icon Ppt PowerPoint Presentation Slides Information PDF
Presenting this set of slides with name bar graph analytics vector icon ppt powerpoint presentation slides information pdf. This is a three stage process. The stages in this process are bar graph analytics vector icon. This is a completely editable PowerPoint presentation and is available for immediate download. Download now and impress your audience.
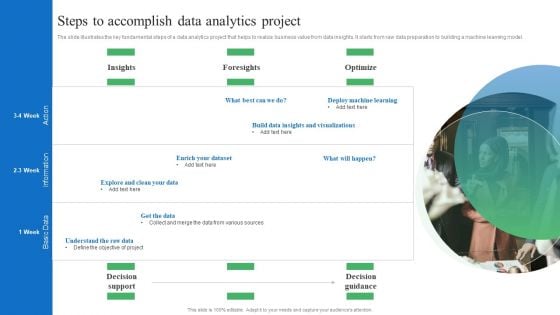
Toolkit For Data Science And Analytics Transition Steps To Accomplish Data Analytics Project Inspiration PDF
The slide illustrates the key fundamental steps of a data analytics project that helps to realize business value from data insights. It starts from raw data preparation to building a machine learning model. The best PPT templates are a great way to save time, energy, and resources. Slidegeeks have 100 percent editable powerpoint slides making them incredibly versatile. With these quality presentation templates, you can create a captivating and memorable presentation by combining visually appealing slides and effectively communicating your message. Download Toolkit For Data Science And Analytics Transition Steps To Accomplish Data Analytics Project Inspiration PDF from Slidegeeks and deliver a wonderful presentation.
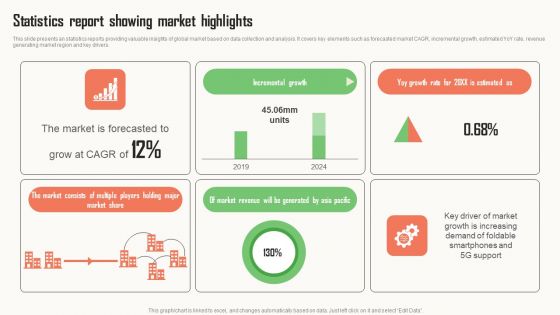
Strategic Market Insight Implementation Guide Statistics Report Showing Market Highlights Themes PDF
This slide presents an statistics reports providing valuable insights of global market based on data collection and analysis. It covers key elements such as forecasted market CAGR, incremental growth, estimated YoY rate, revenue generating market region and key drivers. From laying roadmaps to briefing everything in detail, our templates are perfect for you. You can set the stage with your presentation slides. All you have to do is download these easy to edit and customizable templates. Strategic Market Insight Implementation Guide Statistics Report Showing Market Highlights Themes PDF will help you deliver an outstanding performance that everyone would remember and praise you for. Do download this presentation today.
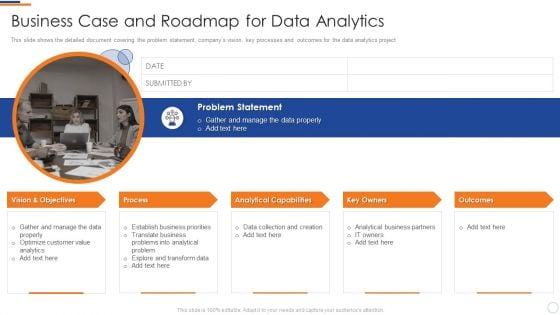
Business Intelligence And Big Data Analytics Business Case And Roadmap For Data Analytics Designs PDF
This slide shows the detailed document covering the problem statement, companys vision, key processes and outcomes for the data analytics project. Presenting business intelligence and big data analytics business case and roadmap for data analytics designs pdf to provide visual cues and insights. Share and navigate important information on one stages that need your due attention. This template can be used to pitch topics like problem statement, vision and objectives, process, analytical capabilities, key owners. In addtion, this PPT design contains high resolution images, graphics, etc, that are easily editable and available for immediate download.
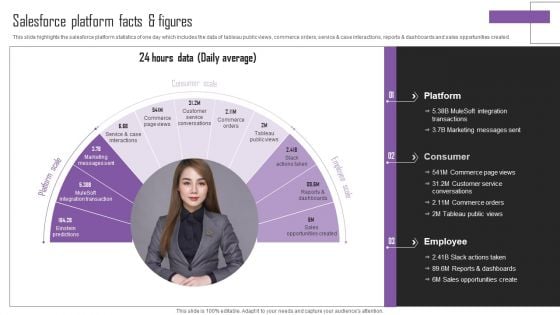
Web Hosting Software Company Outline Salesforce Platform Facts And Figures Graphics PDF
This slide highlights the salesforce platform statistics of one day which includes the data of tableau public views, commerce orders, service and case interactions, reports and dashboards and sales opportunities created. The Web Hosting Software Company Outline Salesforce Platform Facts And Figures Graphics PDF is a compilation of the most recent design trends as a series of slides. It is suitable for any subject or industry presentation, containing attractive visuals and photo spots for businesses to clearly express their messages. This template contains a variety of slides for the user to input data, such as structures to contrast two elements, bullet points, and slides for written information. Slidegeeks is prepared to create an impression.
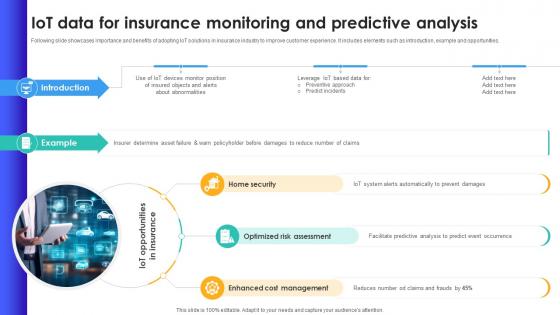
IoT Data For Insurance Monitoring And Predictive Analysis IoT In Banking For Digital Future IoT SS V
Following slide showcases importance and benefits of adopting IoT solutions in insurance industry to improve customer experience. It includes elements such as introduction, example and opportunities. Whether you have daily or monthly meetings, a brilliant presentation is necessary. IoT Data For Insurance Monitoring And Predictive Analysis IoT In Banking For Digital Future IoT SS V can be your best option for delivering a presentation. Represent everything in detail using IoT Data For Insurance Monitoring And Predictive Analysis IoT In Banking For Digital Future IoT SS V and make yourself stand out in meetings. The template is versatile and follows a structure that will cater to your requirements. All the templates prepared by Slidegeeks are easy to download and edit. Our research experts have taken care of the corporate themes as well. So, give it a try and see the results. Following slide showcases importance and benefits of adopting IoT solutions in insurance industry to improve customer experience. It includes elements such as introduction, example and opportunities.
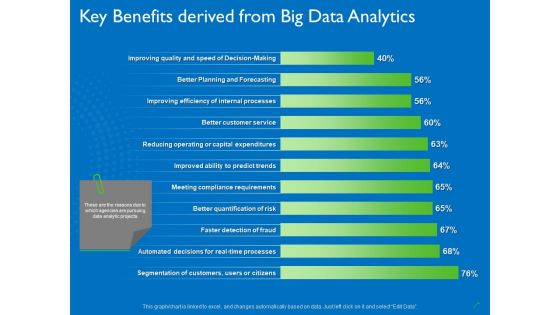
Transforming Big Data Analytics To Knowledge Key Benefits Derived From Big Data Analytics Introduction PDF
Deliver an awe inspiring pitch with this creative transforming big data analytics to knowledge key benefits derived from big data analytics introduction pdf bundle. Topics like service, processes, efficiency, planning, decision making can be discussed with this completely editable template. It is available for immediate download depending on the needs and requirements of the user.
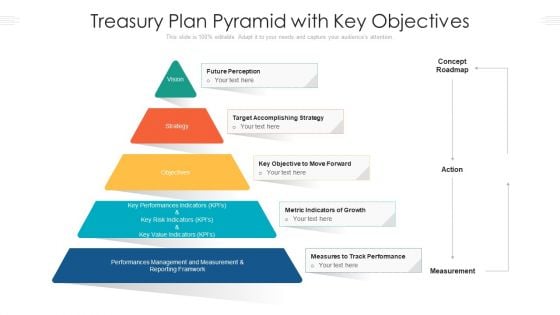
Treasury Plan Pyramid With Key Objectives Ppt PowerPoint Presentation Gallery Example Topics PDF
Presenting treasury plan pyramid with key objectives ppt powerpoint presentation gallery example topics pdf to dispense important information. This template comprises five stages. It also presents valuable insights into the topics including future perception, accomplishing strategy, metric indicators of growth, track performance. This is a completely customizable PowerPoint theme that can be put to use immediately. So, download it and address the topic impactfully.
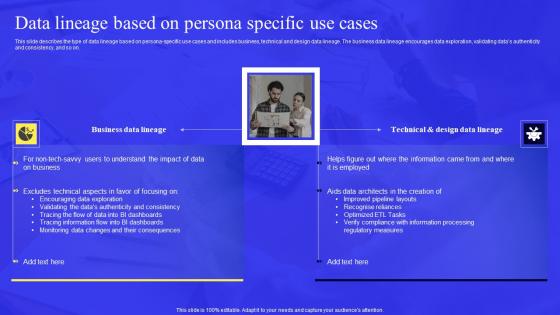
Business Process Data Lineage Data Lineage Based On Persona Specific Use Cases Infographics Pdf
This slide describes the type of data lineage based on persona specific use cases and includes business, technical and design data lineage. The business data lineage encourages data exploration, validating datas authenticity and consistency, and so on. Whether you have daily or monthly meetings, a brilliant presentation is necessary. Business Process Data Lineage Data Lineage Based On Persona Specific Use Cases Infographics Pdf can be your best option for delivering a presentation. Represent everything in detail using Business Process Data Lineage Data Lineage Based On Persona Specific Use Cases Infographics Pdf and make yourself stand out in meetings. The template is versatile and follows a structure that will cater to your requirements. All the templates prepared by Slidegeeks are easy to download and edit. Our research experts have taken care of the corporate themes as well. So, give it a try and see the results. This slide describes the type of data lineage based on persona-specific use cases and includes business, technical and design data lineage. The business data lineage encourages data exploration, validating datas authenticity and consistency, and so on
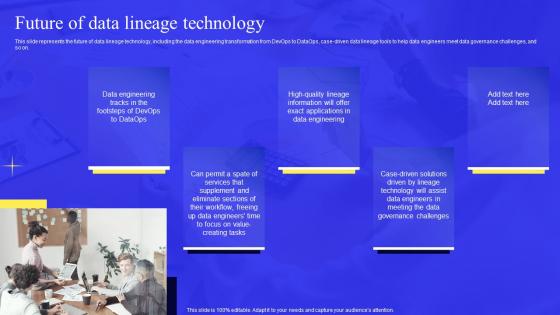
Business Process Data Lineage Future Of Data Lineage Technology Diagrams Pdf
This slide represents the future of data lineage technology, including the data engineering transformation from DevOps to DataOps, case driven data lineage tools to help data engineers meet data governance challenges, and so on. Are you searching for a Business Process Data Lineage Future Of Data Lineage Technology Diagrams Pdf that is uncluttered, straightforward, and original Its easy to edit, and you can change the colors to suit your personal or business branding. For a presentation that expresses how much effort you have put in, this template is ideal With all of its features, including tables, diagrams, statistics, and lists, its perfect for a business plan presentation. Make your ideas more appealing with these professional slides. Download Business Process Data Lineage Future Of Data Lineage Technology Diagrams Pdf from Slidegeeks today. This slide represents the future of data lineage technology, including the data engineering transformation from DevOps to DataOps, case-driven data lineage tools to help data engineers meet data governance challenges, and so on.
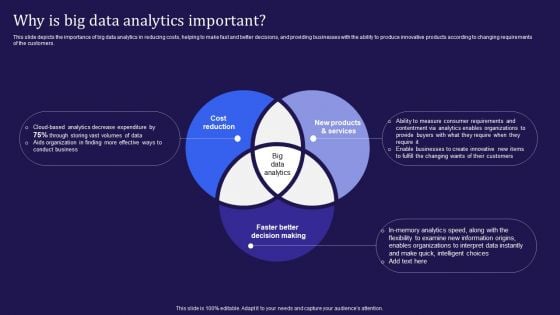
Big Data Analytics Lifecycle Why Is Big Data Analytics Important Ppt Summary Example Topics PDF
This slide depicts the importance of big data analytics in reducing costs, helping to make fast and better decisions, and providing businesses with the ability to produce innovative products according to changing requirements of the customers. Do you have an important presentation coming up Are you looking for something that will make your presentation stand out from the rest Look no further than Big Data Analytics Lifecycle Why Is Big Data Analytics Important Ppt Summary Example Topics PDF. With our professional designs, you can trust that your presentation will pop and make delivering it a smooth process. And with Slidegeeks, you can trust that your presentation will be unique and memorable. So why wait Grab Big Data Analytics Lifecycle Why Is Big Data Analytics Important Ppt Summary Example Topics PDF today and make your presentation stand out from the rest.
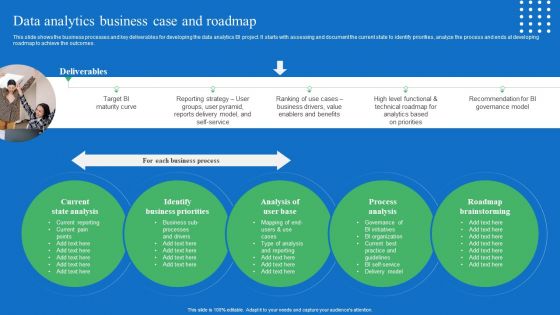
Toolkit For Data Science And Analytics Transition Data Analytics Business Case And Roadmap Designs PDF
This slide shows the business processes and key deliverables for developing the data analytics BI project. It starts with assessing and document the current state to identify priorities, analyze the process and ends at developing roadmap to achieve the outcomes. Get a simple yet stunning designed Toolkit For Data Science And Analytics Transition Data Analytics Business Case And Roadmap Designs PDF. It is the best one to establish the tone in your meetings. It is an excellent way to make your presentations highly effective. So, download this PPT today from Slidegeeks and see the positive impacts. Our easy to edit Toolkit For Data Science And Analytics Transition Data Analytics Business Case And Roadmap Designs PDF can be your go to option for all upcoming conferences and meetings. So, what are you waiting for Grab this template today.
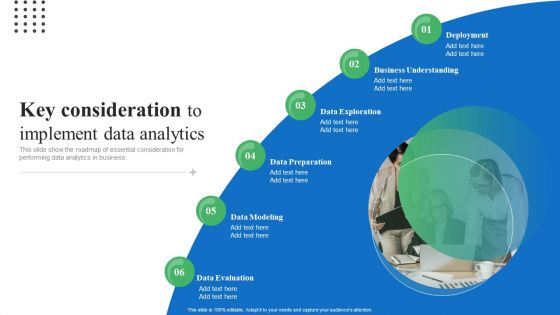
Toolkit For Data Science And Analytics Transition Key Consideration To Implement Data Analytics Guidelines PDF
This slide show the roadmap of essential consideration for performing data analytics in business. Do you have an important presentation coming up Are you looking for something that will make your presentation stand out from the rest Look no further than Toolkit For Data Science And Analytics Transition Key Consideration To Implement Data Analytics Guidelines PDF. With our professional designs, you can trust that your presentation will pop and make delivering it a smooth process. And with Slidegeeks, you can trust that your presentation will be unique and memorable. So why wait Grab Toolkit For Data Science And Analytics Transition Key Consideration To Implement Data Analytics Guidelines PDF today and make your presentation stand out from the rest.
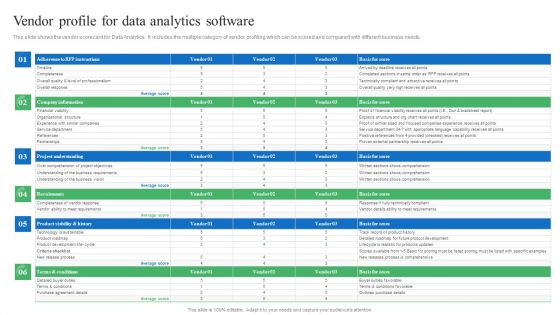
Toolkit For Data Science And Analytics Transition Vendor Profile For Data Analytics Software Introduction PDF
This slide shows the vendor scorecard for Data Analytics. It includes the multiple category of vendor profiling which can be scored and compared with different business needs. Formulating a presentation can take up a lot of effort and time, so the content and message should always be the primary focus. The visuals of the PowerPoint can enhance the presenters message, so our Toolkit For Data Science And Analytics Transition Vendor Profile For Data Analytics Software Introduction PDF was created to help save time. Instead of worrying about the design, the presenter can concentrate on the message while our designers work on creating the ideal templates for whatever situation is needed. Slidegeeks has experts for everything from amazing designs to valuable content, we have put everything into Toolkit For Data Science And Analytics Transition Vendor Profile For Data Analytics Software Introduction PDF.
Booting Brand Image By Tracking KPI Metrics Diagrams PDF
This slide consists of key performance indicators to be used by mangers to track the brand awareness . Key metrices covered are content reach, brand mention, blog shares, search volume data, repeat purchase and organic traffic. Showcasing this set of slides titled Booting Brand Image By Tracking KPI Metrics Diagrams PDF. The topics addressed in these templates are Content Reach, Brand Mentions, Blog Shares. All the content presented in this PPT design is completely editable. Download it and make adjustments in color, background, font etc. as per your unique business setting.
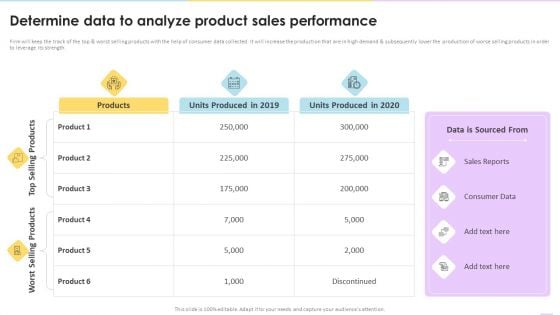
Data Valuation And Monetization Determine Data To Analyze Product Sales Performance Elements PDF
Firm will keep the track of the top worst selling products with the help of consumer data collected. It will increase the production that are in high demand subsequently lower the production of worse selling products in order to leverage its strength. Deliver and pitch your topic in the best possible manner with this Data Valuation And Monetization Determine Data To Analyze Product Sales Performance Elements PDF. Use them to share invaluable insights on Sales Reports, Consumer Data, Data Sourced and impress your audience. This template can be altered and modified as per your expectations. So, grab it now.
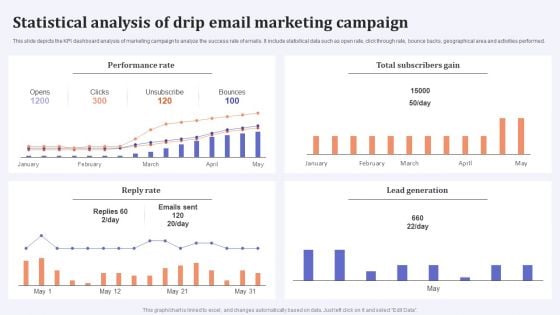
Statistical Analysis Of Drip Email Marketing Campaign Microsoft PDF
This slide depicts the KPI dashboard analysis of marketing campaign to analyze the success rate of emails. It include statistical data such as open rate, click through rate, bounce backs, geographical area and activities performed. Showcasing this set of slides titled Statistical Analysis Of Drip Email Marketing Campaign Microsoft PDF. The topics addressed in these templates are Performance Rate, Total Subscribers Gain, Reply Rate. All the content presented in this PPT design is completely editable. Download it and make adjustments in color, background, font etc. as per your unique business setting.


 Continue with Email

 Home
Home


