Snapshot
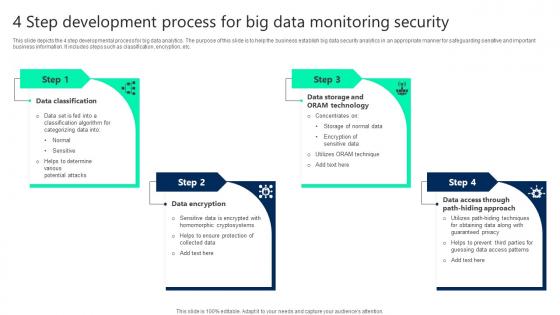
4 Step Development Process For Big Data Monitoring Security Demonstration pdf
This slide depicts the 4 step developmental process for big data analytics. The purpose of this slide is to help the business establish big data security analytics in an appropriate manner for safeguarding sensitive and important business information. It includes steps such as classification, encryption, etc. Showcasing this set of slides titled 4 Step Development Process For Big Data Monitoring Security Demonstration pdf. The topics addressed in these templates are Data Classification, Data Access, Data Encryption. All the content presented in this PPT design is completely editable. Download it and make adjustments in color, background, font etc. as per your unique business setting. This slide depicts the 4 step developmental process for big data analytics. The purpose of this slide is to help the business establish big data security analytics in an appropriate manner for safeguarding sensitive and important business information. It includes steps such as classification, encryption, etc.
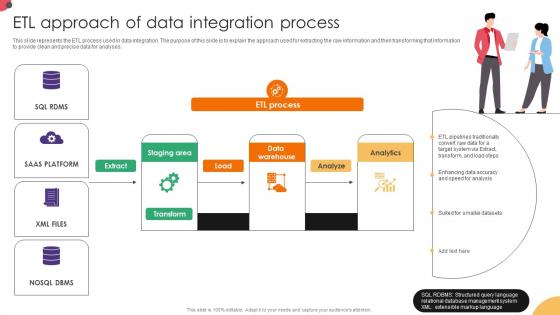
ETL Approach Of Data Integration Process Data Integration Strategies For Business
This slide represents the ETL process used in data integration. The purpose of this slide is to explain the approach used for extracting the raw information and then transforming that information to provide clean and precise data for analyses. The ETL Approach Of Data Integration Process Data Integration Strategies For Business is a compilation of the most recent design trends as a series of slides. It is suitable for any subject or industry presentation, containing attractive visuals and photo spots for businesses to clearly express their messages. This template contains a variety of slides for the user to input data, such as structures to contrast two elements, bullet points, and slides for written information. Slidegeeks is prepared to create an impression. This slide represents the ETL process used in data integration. The purpose of this slide is to explain the approach used for extracting the raw information and then transforming that information to provide clean and precise data for analyses.
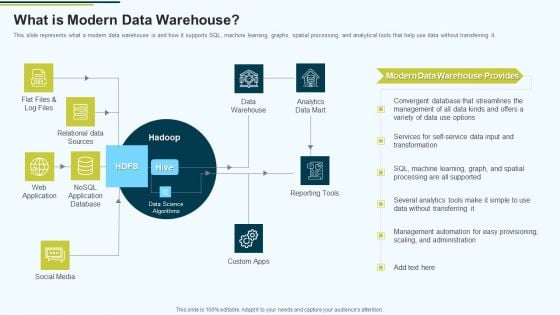
MIS What Is Modern Data Warehouse Ppt PowerPoint Presentation Layouts Graphics Example PDF
This slide represents what a modern data warehouse is and how it supports SQL, machine learning, graphs, spatial processing, and analytical tools that help use data without transferring it.Deliver an awe inspiring pitch with this creative MIS What Is Modern Data Warehouse Ppt PowerPoint Presentation Layouts Graphics Example PDF bundle. Topics like Relational Data Sources, Data Warehouse, Analytics Data Mart can be discussed with this completely editable template. It is available for immediate download depending on the needs and requirements of the user.
Introducing And Implementing Data Migration Approaches Within The Business Magnifying Glass Ppt File Rules PDF
Presenting this set of slides with name introducing and implementing data migration approaches within the business magnifying glass ppt file rules pdf. This is a one stage process. The stage in this process is magnifying glass. This is a completely editable PowerPoint presentation and is available for immediate download. Download now and impress your audience.
Outline For Devops Benefits Culture Performance Indicators And Implementation Roadmap Ppt PowerPoint Presentation Complete With Slides
Pitch yourself both in house and outside by utilizing this complete deck. This outline for devops benefits culture performance indicators and implementation roadmap ppt powerpoint presentation complete with slides focuses on key fundamentals of the topic, displayed using different slides. With a total of fifty three slides, this template is the best tool you can use to persuade your audience. It will not only help you create great presentations but also induce strategic thinking because of its well researched content and graphics. You can easily personalize any of the elements to suit your unique business setting. Additionally, it can be saved in PNG, JPG, and PDF formats to save your time and resources.
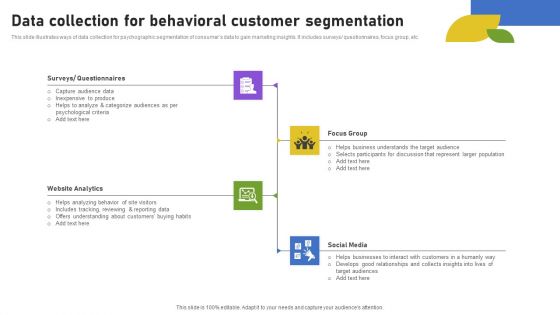
Data Collection For Behavioral Customer Segmentation Summary PDF
This slide illustrates ways of data collection for psychographic segmentation of consumers data to gain marketing insights. It includes surveys or questionnaires, focus group, etc. Presenting Data Collection For Behavioral Customer Segmentation Summary PDF to dispense important information. This template comprises four stages. It also presents valuable insights into the topics including Surveys Or Questionnaires, Website Analytics, Focus Group, Social Media. This is a completely customizable PowerPoint theme that can be put to use immediately. So, download it and address the topic impactfully.
Data Search With Various Charts To Recognize Market Trends Icon Ppt PowerPoint Presentation Infographic Template Clipart PDF
Persuade your audience using this data search with various charts to recognize market trends icon ppt powerpoint presentation infographic template clipart pdf. This PPT design covers three stages, thus making it a great tool to use. It also caters to a variety of topics including data search with various charts to recognize market trends icon. Download this PPT design now to present a convincing pitch that not only emphasizes the topic but also showcases your presentation skills.
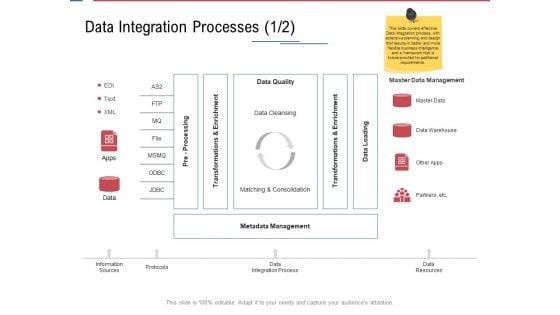
Data Assimilation Data Integration Processes Master Ppt Styles Picture PDF
Deliver an awe inspiring pitch with this creative data assimilation data integration processes master ppt styles picture pdf bundle. Topics like information sources, protocols, data integration process, data resources can be discussed with this completely editable template. It is available for immediate download depending on the needs and requirements of the user.
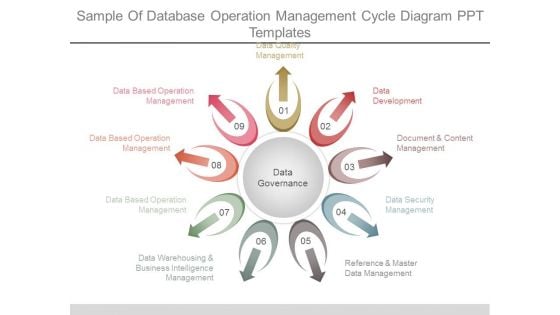
Sample Of Database Operation Management Cycle Diagram Ppt Templates
This is a sample of database operation management cycle diagram ppt templates. This is a nine stage process. The stages in this process are data based operation management, data based operation management, data based operation management, data warehousing and business intelligence management, reference and master data management, data security management, document and content management, data development, data quality management, data governance.
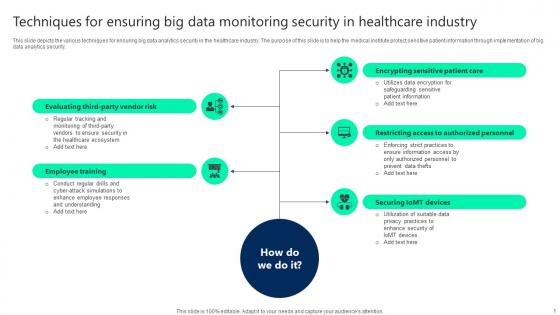
Techniques For Ensuring Big Data Monitoring Security In Healthcare Industry Infographics pdf
This slide depicts the various techniques for ensuring big data analytics security in the healthcare industry. The purpose of this slide is to help the medical institute protect sensitive patient information through implementation of big data analytics security. Pitch your topic with ease and precision using this Techniques For Ensuring Big Data Monitoring Security In Healthcare Industry Infographics pdf. This layout presents information on Employee Training, Securing Iomt Devices, Restricting Access. It is also available for immediate download and adjustment. So, changes can be made in the color, design, graphics or any other component to create a unique layout. This slide depicts the various techniques for ensuring big data analytics security in the healthcare industry. The purpose of this slide is to help the medical institute protect sensitive patient information through implementation of big data analytics security.
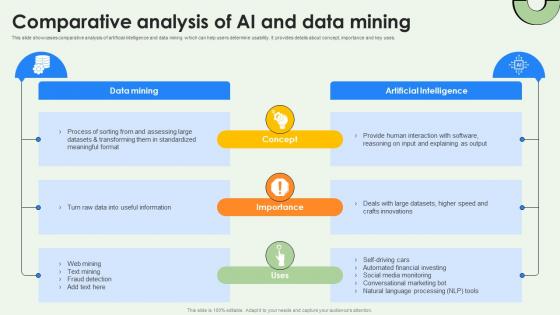
Data Warehousing And Comparative Analysis Of Ai And Data Mining AI SS V
This slide showcases comparative analysis of artificial intelligence and data mining which can help users determine usability. It provides details about concept, importance and key uses. Retrieve professionally designed Data Warehousing And Comparative Analysis Of Ai And Data Mining AI SS V to effectively convey your message and captivate your listeners. Save time by selecting pre-made slideshows that are appropriate for various topics, from business to educational purposes. These themes come in many different styles, from creative to corporate, and all of them are easily adjustable and can be edited quickly. Access them as PowerPoint templates or as Google Slides themes. You do not have to go on a hunt for the perfect presentation because Slidegeeks got you covered from everywhere. This slide showcases comparative analysis of artificial intelligence and data mining which can help users determine usability. It provides details about concept, importance and key uses.
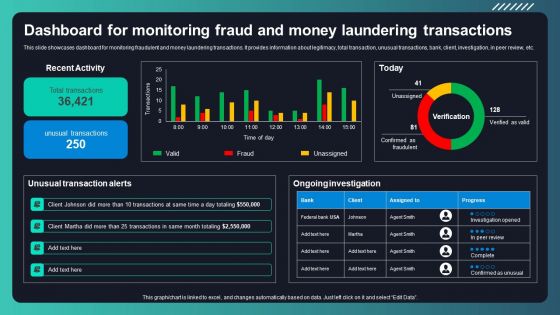
Deploying AML Transaction Monitoring Dashboard For Monitoring Fraud And Money Rules PDF
This slide showcases dashboard for monitoring fraudulent and money laundering transactions. It provides information about legitimacy, total transaction, unusual transactions, bank, client, investigation, in peer review, etc. Do you have an important presentation coming up Are you looking for something that will make your presentation stand out from the rest Look no further than Deploying AML Transaction Monitoring Dashboard For Monitoring Fraud And Money Rules PDF. With our professional designs, you can trust that your presentation will pop and make delivering it a smooth process. And with Slidegeeks, you can trust that your presentation will be unique and memorable. So why wait Grab Deploying AML Transaction Monitoring Dashboard For Monitoring Fraud And Money Rules PDF today and make your presentation stand out from the rest.

Deploying AML Transaction Monitoring Dashboard To Monitor Bank Transactions And Activities Graphics PDF
This slide showcases dashboard to review bank transactions and activities. It provides information about credit, check, ATM, debit card, transaction volume, decline rate, visa, maestro, network end points, etc. Whether you have daily or monthly meetings, a brilliant presentation is necessary. Deploying AML Transaction Monitoring Dashboard To Monitor Bank Transactions And Activities Graphics PDF can be your best option for delivering a presentation. Represent everything in detail using Deploying AML Transaction Monitoring Dashboard To Monitor Bank Transactions And Activities Graphics PDF and make yourself stand out in meetings. The template is versatile and follows a structure that will cater to your requirements. All the templates prepared by Slidegeeks are easy to download and edit. Our research experts have taken care of the corporate themes as well. So, give it a try and see the results.
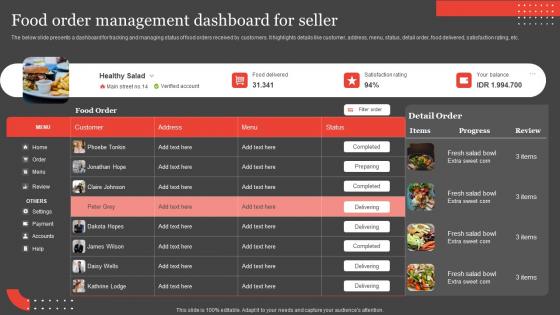
International Food Delivery Market Food Order Management Dashboard For Seller Graphics Pdf
The below slide presents a dashboard for tracking and managing status of food orders received by customers. It highlights details like customer, address, menu, status, detail order, food delivered, satisfaction rating, etc. Coming up with a presentation necessitates that the majority of the effort goes into the content and the message you intend to convey. The visuals of a PowerPoint presentation can only be effective if it supplements and supports the story that is being told. Keeping this in mind our experts created International Food Delivery Market Food Order Management Dashboard For Seller Graphics Pdf to reduce the time that goes into designing the presentation. This way, you can concentrate on the message while our designers take care of providing you with the right template for the situation. The below slide presents a dashboard for tracking and managing status of food orders received by customers. It highlights details like customer, address, menu, status, detail order, food delivered, satisfaction rating, etc.
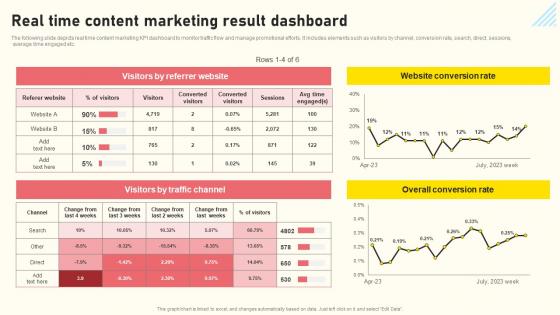
Effective Real Time Marketing Principles Real Time Content Marketing Result Dashboard Mockup Pdf
The following slide depicts real time content marketing KPI dashboard to monitor traffic flow and manage promotional efforts. It includes elements such as visitors by channel, conversion rate, search, direct, sessions, average time engaged etc. From laying roadmaps to briefing everything in detail, our templates are perfect for you. You can set the stage with your presentation slides. All you have to do is download these easy-to-edit and customizable templates. Effective Real Time Marketing Principles Real Time Content Marketing Result Dashboard Mockup Pdf will help you deliver an outstanding performance that everyone would remember and praise you for. Do download this presentation today. The following slide depicts real time content marketing KPI dashboard to monitor traffic flow and manage promotional efforts. It includes elements such as visitors by channel, conversion rate, search, direct, sessions, average time engaged etc.
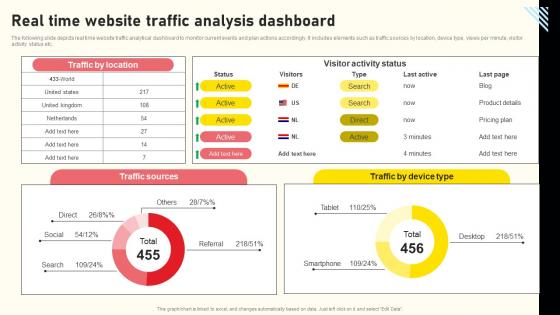
Effective Real Time Marketing Principles Real Time Website Traffic Analysis Dashboard Graphics Pdf
The following slide depicts real time website traffic analytical dashboard to monitor current events and plan actions accordingly. It includes elements such as traffic sources by location, device type, views per minute, visitor activity status etc. Present like a pro with Effective Real Time Marketing Principles Real Time Website Traffic Analysis Dashboard Graphics Pdf Create beautiful presentations together with your team, using our easy-to-use presentation slides. Share your ideas in real-time and make changes on the fly by downloading our templates. So whether you are in the office, on the go, or in a remote location, you can stay in sync with your team and present your ideas with confidence. With Slidegeeks presentation got a whole lot easier. Grab these presentations today. The following slide depicts real time website traffic analytical dashboard to monitor current events and plan actions accordingly. It includes elements such as traffic sources by location, device type, views per minute, visitor activity status etc.
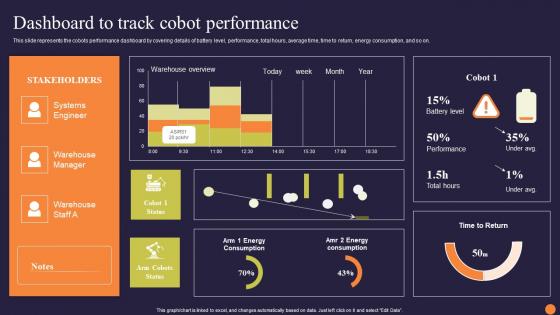
Collaborative Robots Revolutionizing Workforce Efficiency Dashboard To Track Cobot Download Pdf
This slide represents the cobots performance dashboard by covering details of battery level, performance, total hours, average time, time to return, energy consumption, and so on. If your project calls for a presentation, then Slidegeeks is your go to partner because we have professionally designed, easy to edit templates that are perfect for any presentation. After downloading, you can easily edit Collaborative Robots Revolutionizing Workforce Efficiency Dashboard To Track Cobot Download Pdf and make the changes accordingly. You can rearrange slides or fill them with different images. Check out all the handy templates. This slide represents the cobots performance dashboard by covering details of battery level, performance, total hours, average time, time to return, energy consumption, and so on.
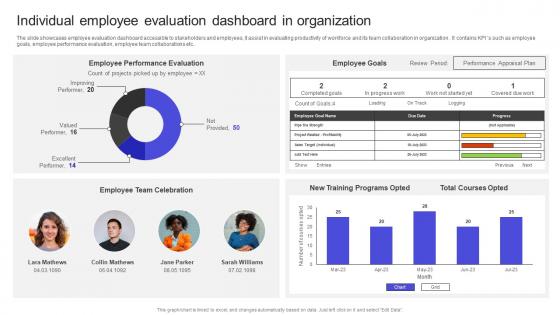
Strategies To Build Meaningful Individual Employee Evaluation Dashboard In Organization Professional Pdf
The slide showcases employee evaluation dashboard accessible to stakeholders and employees, it assist in evaluating productivity of workforce and its team collaboration in organization . It contains KPI s such as employee goals, employee performance evaluation, employee team collaborations etc.. Want to ace your presentation in front of a live audience Our Strategies To Build Meaningful Individual Employee Evaluation Dashboard In Organization Professional Pdf can help you do that by engaging all the users towards you. Slidegeeks experts have put their efforts and expertise into creating these impeccable powerpoint presentations so that you can communicate your ideas clearly. Moreover, all the templates are customizable, and easy-to-edit and downloadable. Use these for both personal and commercial use. The slide showcases employee evaluation dashboard accessible to stakeholders and employees, it assist in evaluating productivity of workforce and its team collaboration in organization . It contains KPI s such as employee goals, employee performance evaluation, employee team collaborations etc..
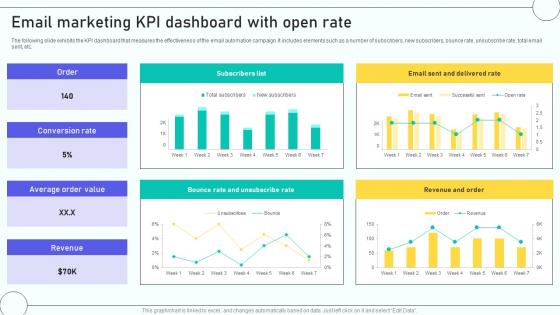
A4 Email Marketing Automation Process To Email Marketing KPI Dashboard With Open Rate
The following slide exhibits the KPI dashboard that measures the effectiveness of the email automation campaign. It includes elements such as a number of subscribers, new subscribers, bounce rate, unsubscribe rate, total email sent, etc. Slidegeeks is one of the best resources for PowerPoint templates. You can download easily and regulate A4 Email Marketing Automation Process To Email Marketing KPI Dashboard With Open Rate for your personal presentations from our wonderful collection. A few clicks is all it takes to discover and get the most relevant and appropriate templates. Use our Templates to add a unique zing and appeal to your presentation and meetings. All the slides are easy to edit and you can use them even for advertisement purposes. The following slide exhibits the KPI dashboard that measures the effectiveness of the email automation campaign. It includes elements such as a number of subscribers, new subscribers, bounce rate, unsubscribe rate, total email sent, etc.
Executing And Monitoring Project Using Project Management Dashboard For Tracking PM SS V
This slide showcases dashboard for tracing project performance. This template focuses on changing the status of each task and graphs automatically tracking overall status. It covers aspects related to task priority, budget, etc. Slidegeeks has constructed Executing And Monitoring Project Using Project Management Dashboard For Tracking PM SS V after conducting extensive research and examination. These presentation templates are constantly being generated and modified based on user preferences and critiques from editors. Here, you will find the most attractive templates for a range of purposes while taking into account ratings and remarks from users regarding the content. This is an excellent jumping-off point to explore our content and will give new users an insight into our top-notch PowerPoint Templates. This slide showcases dashboard for tracing project performance. This template focuses on changing the status of each task and graphs automatically tracking overall status. It covers aspects related to task priority, budget, etc.
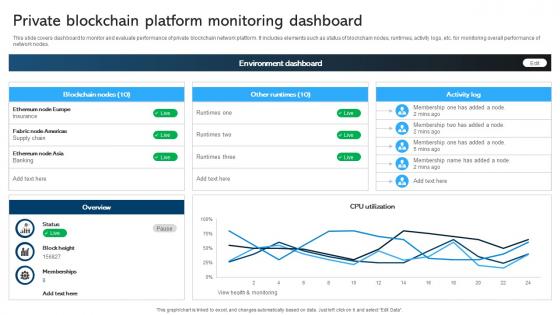
Comprehensive Manual For Private Blockchain Platform Monitoring Dashboard BCT SS V
This slide covers dashboard to monitor and evaluate performance of private blockchain network platform. It includes elements such as status of blockchain nodes, runtimes, activity logs, etc. for monitoring overall performance of network nodes. Want to ace your presentation in front of a live audience Our Comprehensive Manual For Private Blockchain Platform Monitoring Dashboard BCT SS V can help you do that by engaging all the users towards you. Slidegeeks experts have put their efforts and expertise into creating these impeccable powerpoint presentations so that you can communicate your ideas clearly. Moreover, all the templates are customizable, and easy-to-edit and downloadable. Use these for both personal and commercial use. This slide covers dashboard to monitor and evaluate performance of private blockchain network platform. It includes elements such as status of blockchain nodes, runtimes, activity logs, etc. for monitoring overall performance of network nodes.
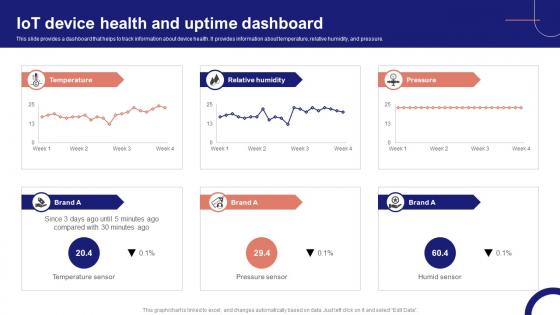
IoT Device Management Fundamentals IoT Device Health And Uptime Dashboard IoT Ss V
This slide provides a dashboard that helps to track information about device health. It provides information about temperature, relative humidity, and pressure. Take your projects to the next level with our ultimate collection of IoT Device Management Fundamentals IoT Device Health And Uptime Dashboard IoT SS V. Slidegeeks has designed a range of layouts that are perfect for representing task or activity duration, keeping track of all your deadlines at a glance. Tailor these designs to your exact needs and give them a truly corporate look with your own brand colors they will make your projects stand out from the rest This slide provides a dashboard that helps to track information about device health. It provides information about temperature, relative humidity, and pressure.
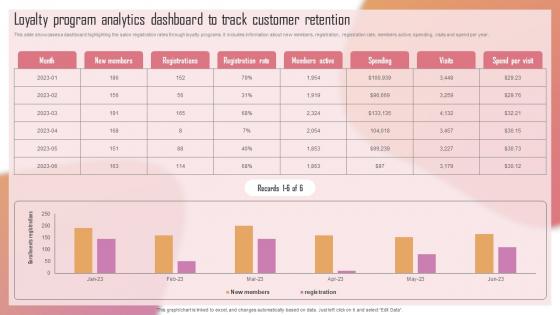
Customizing The Salon Experience Loyalty Program Analytics Dashboard To Track Customer Strategy SS V
This slide showcases a dashboard highlighting the salon registration rates through loyalty programs. It includes information about new members, registration, registration rate, members active, spending, visits and spend per year. There are so many reasons you need a Customizing The Salon Experience Loyalty Program Analytics Dashboard To Track Customer Strategy SS V. The first reason is you can not spend time making everything from scratch, Thus, Slidegeeks has made presentation templates for you too. You can easily download these templates from our website easily. This slide showcases a dashboard highlighting the salon registration rates through loyalty programs. It includes information about new members, registration, registration rate, members active, spending, visits and spend per year.
Driving Results Designing A Team Training And Development Program Tracking Dashboard
This slide depicts team development program tracking dashboard to analyze the impact of implementing training plan for the members. It includes training satisfaction rate, engagement score, drop-out rate and top 5 trainees. Take your projects to the next level with our ultimate collection of Driving Results Designing A Team Training And Development Program Tracking Dashboard. Slidegeeks has designed a range of layouts that are perfect for representing task or activity duration, keeping track of all your deadlines at a glance. Tailor these designs to your exact needs and give them a truly corporate look with your own brand colors they will make your projects stand out from the rest This slide depicts team development program tracking dashboard to analyze the impact of implementing training plan for the members. It includes training satisfaction rate, engagement score, drop-out rate and top 5 trainees.
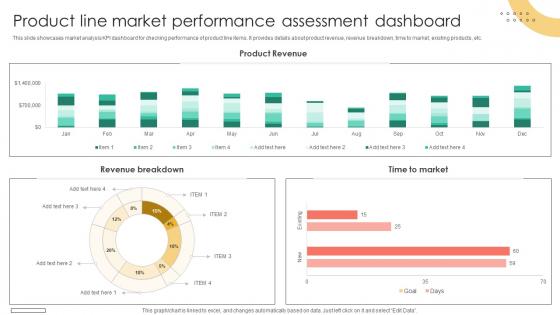
Brand Extension Techniques Product Line Market Performance Assessment Dashboard Strategy SS V
This slide showcases market analysis KPI dashboard for checking performance of product line items. It provides details about product revenue, revenue breakdown, time to market, existing products, etc. This Brand Extension Techniques Product Line Market Performance Assessment Dashboard Strategy SS V from Slidegeeks makes it easy to present information on your topic with precision. It provides customization options, so you can make changes to the colors, design, graphics, or any other component to create a unique layout. It is also available for immediate download, so you can begin using it right away. Slidegeeks has done good research to ensure that you have everything you need to make your presentation stand out. Make a name out there for a brilliant performance. This slide showcases market analysis KPI dashboard for checking performance of product line items. It provides details about product revenue, revenue breakdown, time to market, existing products, etc.

Strategies For Stabilizing Corporate Company Profit And Loss Dashboard With Income Statement
This slide provides a KPI dashboard that enables an organization to track revenue, expenses, and profit incurred in a specific period. It includes gross profit margin, OPEX ratio, operating profit margin, and net profit margin. There are so many reasons you need a Strategies For Stabilizing Corporate Company Profit And Loss Dashboard With Income Statement. The first reason is you can not spend time making everything from scratch, Thus, Slidegeeks has made presentation templates for you too. You can easily download these templates from our website easily. This slide provides a KPI dashboard that enables an organization to track revenue, expenses, and profit incurred in a specific period. It includes gross profit margin, OPEX ratio, operating profit margin, and net profit margin.
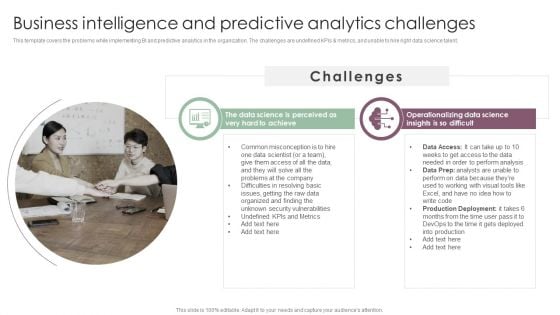
Information Analysis And BI Playbook Business Intelligence And Predictive Analytics Challenges Slides PDF
This template covers the problems while implementing BI and predictive analytics in the organization. The challenges are undefined KPIs and metrics, and unable to hire right data science talent. Want to ace your presentation in front of a live audience Our Information Analysis And BI Playbook Business Intelligence And Predictive Analytics Challenges Slides PDF can help you do that by engaging all the users towards you. Slidegeeks experts have put their efforts and expertise into creating these impeccable powerpoint presentations so that you can communicate your ideas clearly. Moreover, all the templates are customizable, and easy to edit and downloadable. Use these for both personal and commercial use.
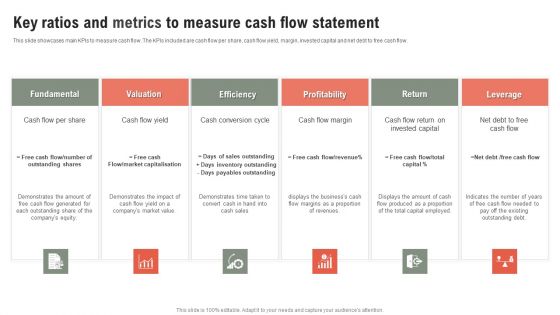
Key Ratios And Metrics To Measure Cash Flow Statement Ppt Gallery Graphics PDF
This slide showcases main KPIs to measure cash flow. The KPIs included are cash flow per share, cash flow yield, margin, invested capital and net debt to free cash flow. Persuade your audience using this Key Ratios And Metrics To Measure Cash Flow Statement Ppt Gallery Graphics PDF. This PPT design covers six stages, thus making it a great tool to use. It also caters to a variety of topics including Fundamental, Valuation, Efficiency, Profitability. Download this PPT design now to present a convincing pitch that not only emphasizes the topic but also showcases your presentation skills.
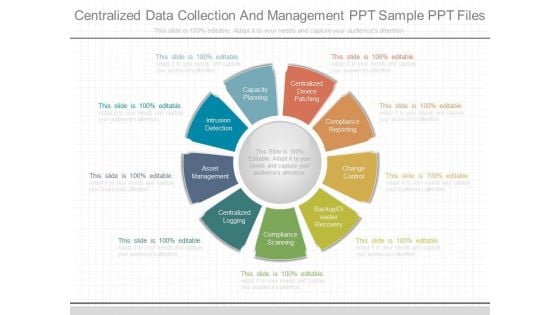
Centralized Data Collection And Management Ppt Sample Ppt Files
This is a centralized data collection and management ppt sample ppt files. This is a nine stage process. The stages in this process are capacity planning, centralized device patching, compliance reporting, change control, backup disaster recovery, compliance scanning, centralized logging, asset management.
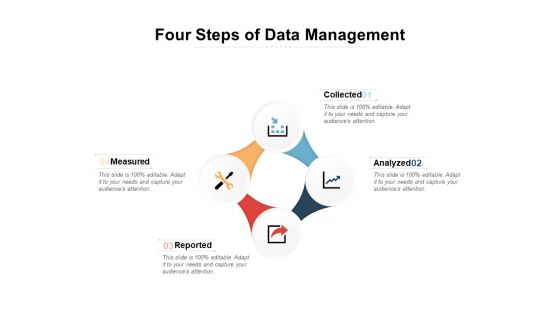
Four Steps Of Data Management Ppt PowerPoint Presentation Professional Ideas
Presenting this set of slides with name four steps of data management ppt powerpoint presentation professional ideas. This is a four stage process. The stages in this process are measured, reported, collected, analyzed . This is a completely editable PowerPoint presentation and is available for immediate download. Download now and impress your audience.
Business Data Sources Ppt PowerPoint Presentation Complete Deck With Slides
Presenting this set of slides with name business data sources ppt powerpoint presentation complete deck with slides. The topics discussed in these slides are databases, investment, business profits, analyst reports, information. This is a completely editable PowerPoint presentation and is available for immediate download. Download now and impress your audience.
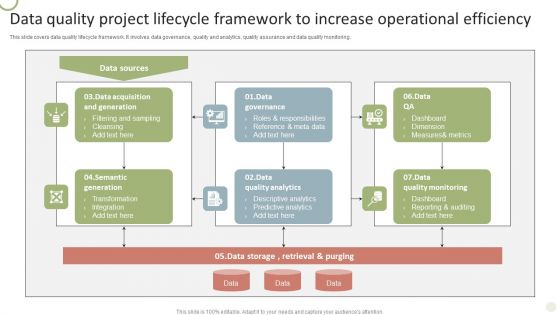
Data Quality Project Lifecycle Framework To Increase Operational Efficiency Template PDF
This slide covers data quality lifecycle framework. It involves data governance, quality and analytics, quality assurance and data quality monitoring.Showcasing this set of slides titled Data Quality Project Lifecycle Framework To Increase Operational Efficiency Template PDF. The topics addressed in these templates are Roles Responsibilities, Reference Meta Data, Predictive Analytics. All the content presented in this PPT design is completely editable. Download it and make adjustments in color, background, font etc. as per your unique business setting.
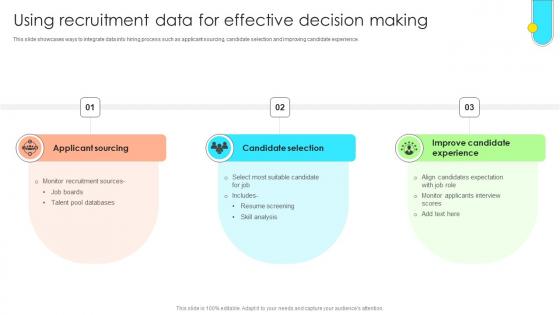
Data Driven Approach To Optimise Using Recruitment Data For Effective Decision CRP SS V
This slide showcases ways to integrate data into hiring process such as applicant sourcing, candidate selection and improving candidate experience. Slidegeeks is here to make your presentations a breeze with Data Driven Approach To Optimise Using Recruitment Data For Effective Decision CRP SS V With our easy-to-use and customizable templates, you can focus on delivering your ideas rather than worrying about formatting. With a variety of designs to choose from, you are sure to find one that suits your needs. And with animations and unique photos, illustrations, and fonts, you can make your presentation pop. So whether you are giving a sales pitch or presenting to the board, make sure to check out Slidegeeks first This slide showcases ways to integrate data into hiring process such as applicant sourcing, candidate selection and improving candidate experience.

Business Diagram Business Bar Graph For Data Analysis Presentation Template
This business slide displays pie charts with percentage ratios. This diagram is a data visualization tool that gives you a simple way to present statistical information. This slide helps your audience examines and interprets the data you present.
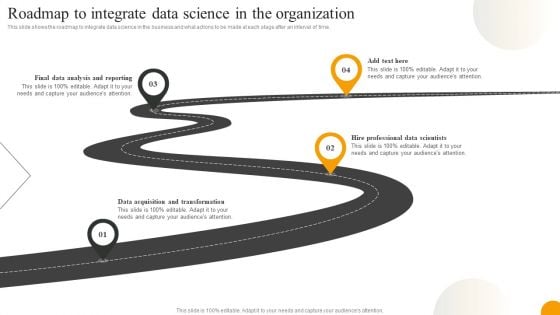
Using Data Science Technologies For Business Transformation Roadmap To Integrate Data Science In The Organization Topics PDF
This slide describes the operational phase of data science and what tasks are performed in this phase, such as deliver final reports, pilot project implementation, and how it will be helpful in monitoring performance. Slidegeeks is here to make your presentations a breeze with Using Data Science Technologies For Business Transformation Roadmap To Integrate Data Science In The Organization Topics PDF With our easy to use and customizable templates, you can focus on delivering your ideas rather than worrying about formatting. With a variety of designs to choose from, you are sure to find one that suits your needs. And with animations and unique photos, illustrations, and fonts, you can make your presentation pop. So whether you are giving a sales pitch or presenting to the board, make sure to check out Slidegeeks first.
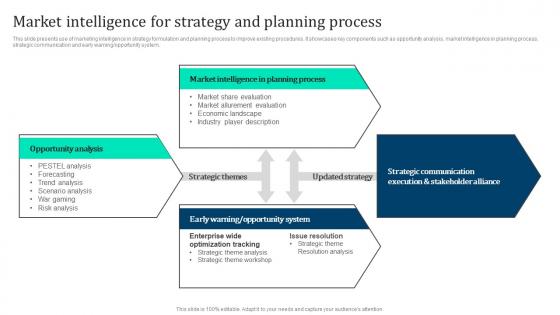
Market Intelligence Strategy Marketing Intelligence Guide Data Gathering Summary Pdf
This slide presents use of marketing intelligence in strategy formulation and planning process to improve existing procedures. It showcases key components such as opportunity analysis, market intelligence in planning process, strategic communication and early warning opportunity system. The Market Intelligence Strategy Marketing Intelligence Guide Data Gathering Summary Pdf is a compilation of the most recent design trends as a series of slides. It is suitable for any subject or industry presentation, containing attractive visuals and photo spots for businesses to clearly express their messages. This template contains a variety of slides for the user to input data, such as structures to contrast two elements, bullet points, and slides for written information. Slidegeeks is prepared to create an impression. This slide presents use of marketing intelligence in strategy formulation and planning process to improve existing procedures. It showcases key components such as opportunity analysis, market intelligence in planning process, strategic communication and early warning opportunity system.
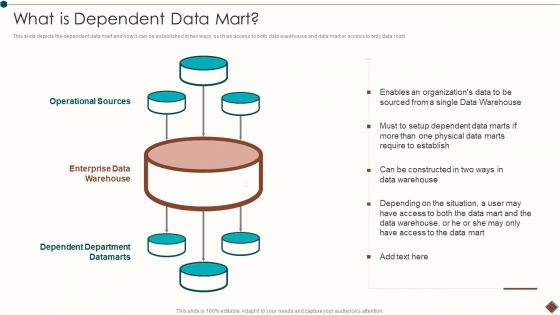
Data Warehouse Implementation What Is Dependent Data Mart Pictures PDF
This slide depicts the dependent data mart and how it can be established in two ways, such as access to both data warehouse and data mart or access to only data mart.Deliver and pitch your topic in the best possible manner with this Data Warehouse Implementation What Is Dependent Data Mart Pictures PDF. Use them to share invaluable insights on Operational Sources, Dependent Department, Physical Data and impress your audience. This template can be altered and modified as per your expectations. So, grab it now.
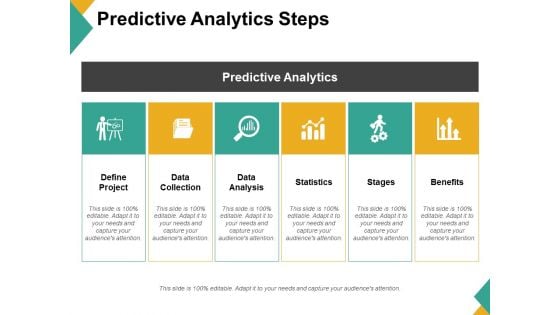
Predictive Analytics Steps Ppt PowerPoint Presentation Styles Guidelines
This is a predictive analytics steps ppt powerpoint presentation styles guidelines. This is a six stage process. The stages in this process are define project, data collection, data analysis, statistics, stages, benefits.
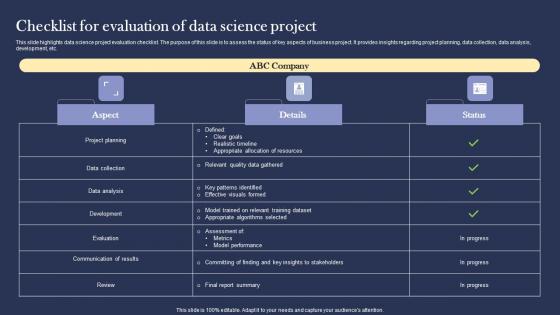
Checklist For Evaluation Of Data Science Project Ideas pdf
This slide highlights data science project evaluation checklist. The purpose of this slide is to assess the status of key aspects of business project. It provides insights regarding project planning, data collection, data analysis, development, etc. Pitch your topic with ease and precision using this Checklist For Evaluation Of Data Science Project Ideas pdf. This layout presents information on Data Collection, Data Analysis, Development. It is also available for immediate download and adjustment. So, changes can be made in the color, design, graphics or any other component to create a unique layout. This slide highlights data science project evaluation checklist. The purpose of this slide is to assess the status of key aspects of business project. It provides insights regarding project planning, data collection, data analysis, development, etc.
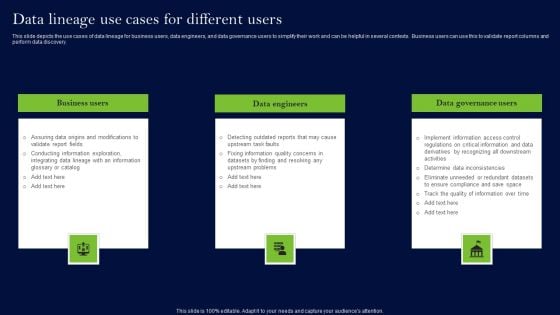
Data Lineage Methods Data Lineage Use Cases For Different Users Download PDF
This slide depicts the use cases of data lineage for business users, data engineers, and data governance users to simplify their work and can be helpful in several contexts. Business users can use this to validate report columns and perform data discovery. Do you have to make sure that everyone on your team knows about any specific topic I yes, then you should give Data Lineage Methods Data Lineage Use Cases For Different Users Download PDF a try. Our experts have put a lot of knowledge and effort into creating this impeccable Data Lineage Methods Data Lineage Use Cases For Different Users Download PDF. You can use this template for your upcoming presentations, as the slides are perfect to represent even the tiniest detail. You can download these templates from the Slidegeeks website and these are easy to edit. So grab these today
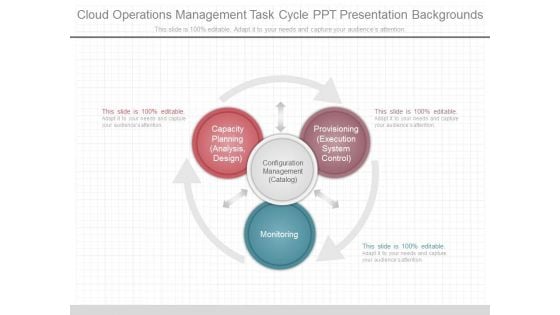
Cloud Operations Management Task Cycle Ppt Presentation Backgrounds
This is a cloud operations management task cycle ppt presentation backgrounds. This is a three stage process. The stages in this process are capacity planning analysis, design, provisioning execution system control, configuration management catalog, monitoring.
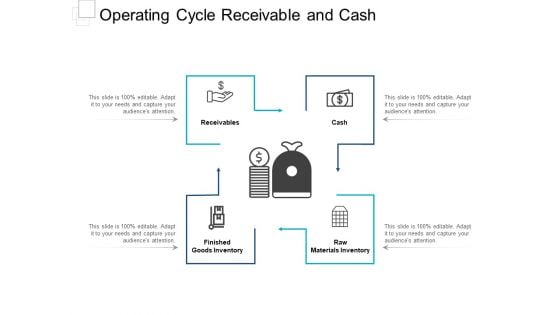
Operating Cycle Receivable And Cash Ppt PowerPoint Presentation Gallery
This is a operating cycle receivable and cash ppt powerpoint presentation gallery. This is a four stage process. The stages in this process are financial capital, working capital management, companys managerial accounting.
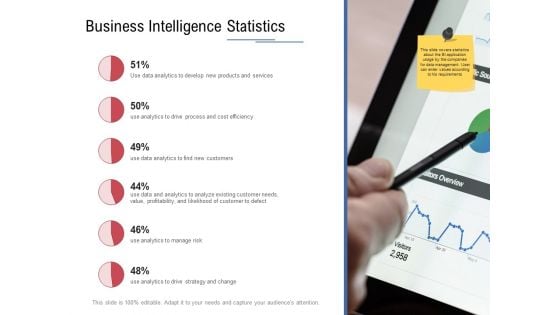
Data Assimilation Business Intelligence Statistics Ppt Slides Graphics Design PDF
This is a data assimilation business intelligence statistics ppt slides graphics design pdf template with various stages. Focus and dispense information on six stages using this creative set, that comes with editable features. It contains large content boxes to add your information on topics like data analytics, develop, services, efficiency, cost. You can also showcase facts, figures, and other relevant content using this PPT layout. Grab it now.

Performance Analysis Of Market Development Strategies Information PDF
The following slide outlines key success metrics through which companies can measure the performance of market development strategies. The major key performance indicators KPIs are revenue, market share, new customers acquired, brand reach, and impressions. Find a pre-designed and impeccable Performance Analysis Of Market Development Strategies Information PDF. The templates can ace your presentation without additional effort. You can download these easy-to-edit presentation templates to make your presentation stand out from others. So, what are you waiting for Download the template from Slidegeeks today and give a unique touch to your presentation.
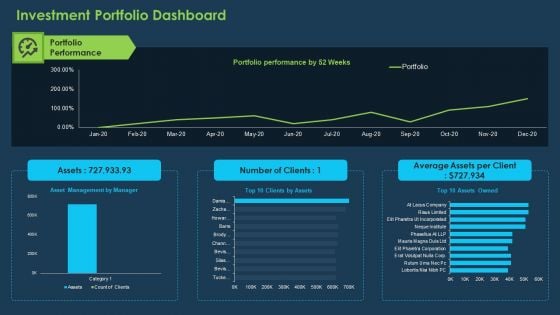
Commercial Banking Template Collection Investment Portfolio Dashboard Ppt Professional Layouts PDF
Deliver and pitch your topic in the best possible manner with this commercial banking template collection investment portfolio dashboard ppt professional layouts pdf. Use them to share invaluable insights on average assets per client, portfolio performance and impress your audience. This template can be altered and modified as per your expectations. So, grab it now.
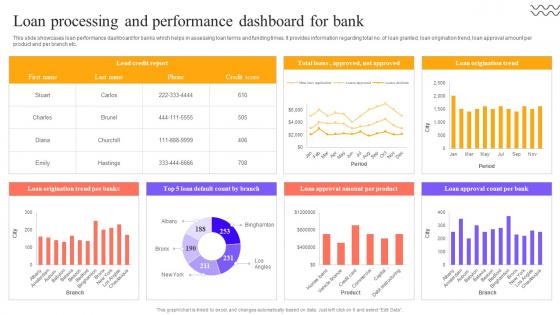
Digital Approach To Client Loan Processing And Performance Dashboard For Bank
This slide showcases loan performance dashboard for banks which helps in assessing loan terms and funding times. It provides information regarding total no. of loan granted, loan origination trend, loan approval amount per product and per branch etc. Whether you have daily or monthly meetings, a brilliant presentation is necessary. Digital Approach To Client Loan Processing And Performance Dashboard For Bank can be your best option for delivering a presentation. Represent everything in detail using Digital Approach To Client Loan Processing And Performance Dashboard For Bank and make yourself stand out in meetings. The template is versatile and follows a structure that will cater to your requirements. All the templates prepared by Slidegeeks are easy to download and edit. Our research experts have taken care of the corporate themes as well. So, give it a try and see the results. This slide showcases loan performance dashboard for banks which helps in assessing loan terms and funding times. It provides information regarding total no. of loan granted, loan origination trend, loan approval amount per product and per branch etc.
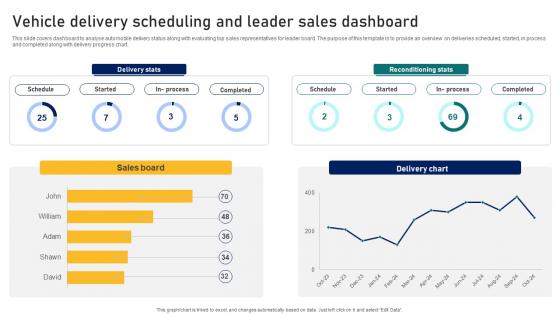
Guide To Building A Successful Vehicle Delivery Scheduling And Leader Sales Dashboard Strategy SS V
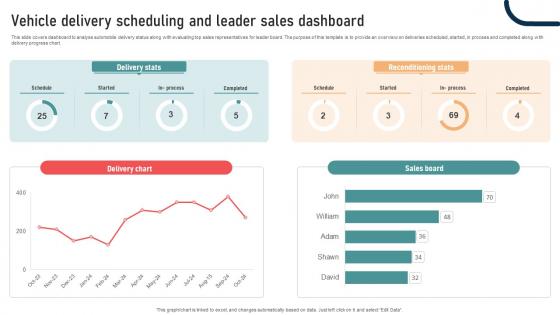
This slide covers dashboard to analyse automobile delivery status along with evaluating top sales representatives for leader board. The purpose of this template is to provide an overview on deliveries scheduled, started, in process and completed along with delivery progress chart. Whether you have daily or monthly meetings, a brilliant presentation is necessary. Guide To Building A Successful Vehicle Delivery Scheduling And Leader Sales Dashboard Strategy SS V can be your best option for delivering a presentation. Represent everything in detail using Guide To Building A Successful Vehicle Delivery Scheduling And Leader Sales Dashboard Strategy SS V and make yourself stand out in meetings. The template is versatile and follows a structure that will cater to your requirements. All the templates prepared by Slidegeeks are easy to download and edit. Our research experts have taken care of the corporate themes as well. So, give it a try and see the results. This slide covers dashboard to analyse automobile delivery status along with evaluating top sales representatives for leader board. The purpose of this template is to provide an overview on deliveries scheduled, started, in process and completed along with delivery progress chart.
Ultimate Guide To Developing Vehicle Delivery Scheduling And Leader Sales Dashboard Strategy SS V
This slide covers dashboard to analyse automobile delivery status along with evaluating top sales representatives for leader board. The purpose of this template is to provide an overview on deliveries scheduled, started, in process and completed along with delivery progress chart. Whether you have daily or monthly meetings, a brilliant presentation is necessary. Ultimate Guide To Developing Vehicle Delivery Scheduling And Leader Sales Dashboard Strategy SS V can be your best option for delivering a presentation. Represent everything in detail using Ultimate Guide To Developing Vehicle Delivery Scheduling And Leader Sales Dashboard Strategy SS V and make yourself stand out in meetings. The template is versatile and follows a structure that will cater to your requirements. All the templates prepared by Slidegeeks are easy to download and edit. Our research experts have taken care of the corporate themes as well. So, give it a try and see the results. This slide covers dashboard to analyse automobile delivery status along with evaluating top sales representatives for leader board. The purpose of this template is to provide an overview on deliveries scheduled, started, in process and completed along with delivery progress chart.
Data Assimilation Data Integration Processes Run Ppt Pictures Templates PDF
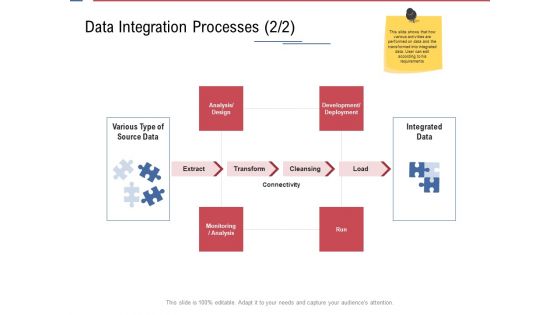
Deliver and pitch your topic in the best possible manner with this data assimilation data integration processes run ppt pictures templates pdf. Use them to share invaluable insights on extract, transform, cleansing, load and impress your audience. This template can be altered and modified as per your expectations. So, grab it now.
A134 Statistical Tools For Evidence Statistical Data Analysis Process Hypotheses Testing
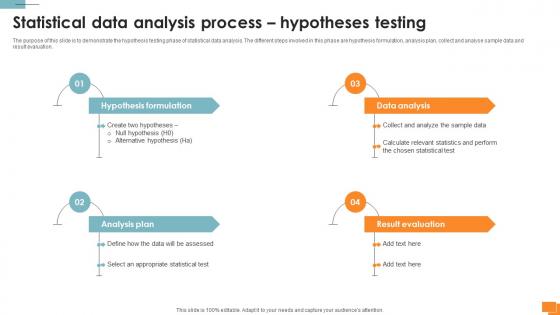
The purpose of this slide is to demonstrate the hypothesis testing phase of statistical data analysis. The different steps involved in this phase are hypothesis formulation, analysis plan, collect and analyse sample data and result evaluation. Create an editable A134 Statistical Tools For Evidence Statistical Data Analysis Process Hypotheses Testing that communicates your idea and engages your audience. Whether you are presenting a business or an educational presentation, pre-designed presentation templates help save time. A134 Statistical Tools For Evidence Statistical Data Analysis Process Hypotheses Testing is highly customizable and very easy to edit, covering many different styles from creative to business presentations. Slidegeeks has creative team members who have crafted amazing templates. So, go and get them without any delay. The purpose of this slide is to demonstrate the hypothesis testing phase of statistical data analysis. The different steps involved in this phase are hypothesis formulation, analysis plan, collect and analyse sample data and result evaluation.
Streamlining Operations Through Clothing Business Strategy Track Metrics To Analyze Social Media Pictures PDF
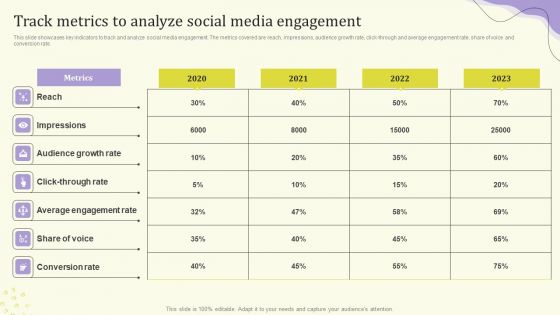
This slide showcases key indicators to track and analyze social media engagement. The metrics covered are reach, impressions, audience growth rate, click-through and average engagement rate, share of voice and conversion rate. Slidegeeks is here to make your presentations a breeze with Streamlining Operations Through Clothing Business Strategy Track Metrics To Analyze Social Media Pictures PDF With our easy to use and customizable templates, you can focus on delivering your ideas rather than worrying about formatting. With a variety of designs to choose from, you are sure to find one that suits your needs. And with animations and unique photos, illustrations, and fonts, you can make your presentation pop. So whether you are giving a sales pitch or presenting to the board, make sure to check out Slidegeeks first.
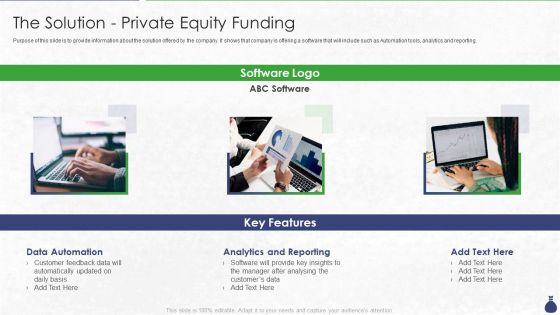
The Solution Private Equity Funding Ppt Pictures File Formats PDF
Purpose of this slide is to provide information about the solution offered by the company. It shows that company is offering a software that will include such as Automation tools, analytics and reporting. Presenting The Solution Private Equity Funding Ppt Pictures File Formats PDF to provide visual cues and insights. Share and navigate important information on three stages that need your due attention. This template can be used to pitch topics like Analytics And Reporting, Data Automation Customer. In addtion, this PPT design contains high resolution images, graphics, etc, that are easily editable and available for immediate download.
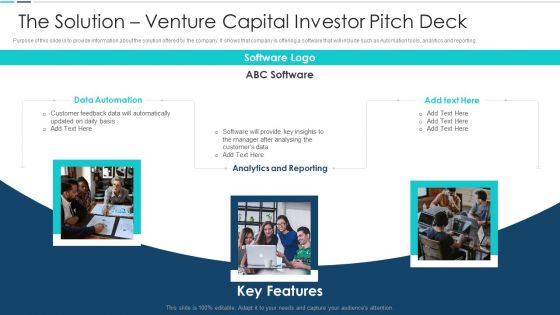
The Solution Venture Capital Investor Pitch Deck Pictures PDF
Purpose of this slide is to provide information about the solution offered by the company. It shows that company is offering a software that will include such as Automation tools, analytics and reporting. Presenting The Solution Venture Capital Investor Pitch Deck Pictures PDF to provide visual cues and insights. Share and navigate important information on three stages that need your due attention. This template can be used to pitch topics like Analytics And Reporting, Data Automation Customer. In addtion, this PPT design contains high resolution images, graphics, etc, that are easily editable and available for immediate download.
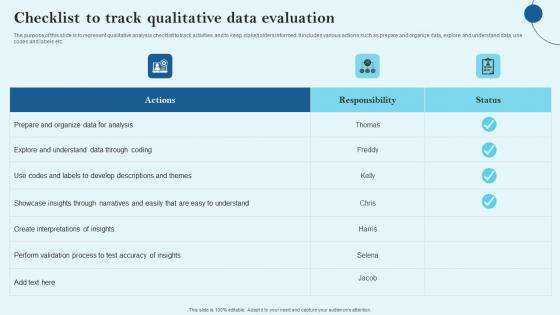
Checklist To Track Qualitative Data Evaluation Microsoft Pdf
The purpose of this slide is to represent qualitative analysis checklist to track activities and to keep stakeholders informed. It includes various actions such as prepare and organize data, explore and understand data, use codes and labels etc. Pitch your topic with ease and precision using this Checklist To Track Qualitative Data Evaluation Microsoft Pdf This layout presents information on Prepare And Organize, Data For Analysis, Responsibility It is also available for immediate download and adjustment. So, changes can be made in the color, design, graphics or any other component to create a unique layout. The purpose of this slide is to represent qualitative analysis checklist to track activities and to keep stakeholders informed. It includes various actions such as prepare and organize data, explore and understand data, use codes and labels etc.
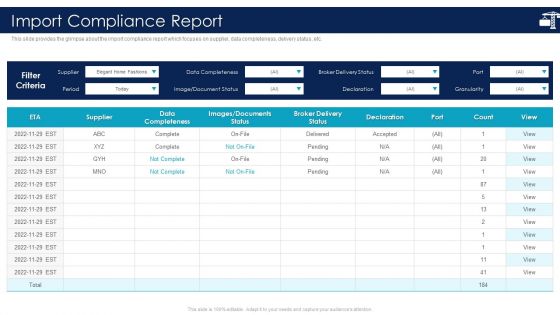
Inbound Logistics And Supply Chain Introduction Import Compliance Report Download PDF
This slide provides the glimpse about the import compliance report which focuses on supplier, data completeness, delivery status, etc.Deliver an awe inspiring pitch with this creative Inbound Logistics And Supply Chain Introduction Import Compliance Report Download PDF bundle. Topics like Data Completeness, Images Or Documents Status, Broker Delivery can be discussed with this completely editable template. It is available for immediate download depending on the needs and requirements of the user.
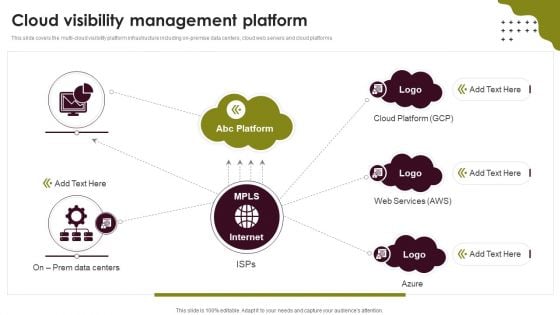
Cloud Computing Scalability Cloud Visibility Management Platform Pictures PDF
This slide covers the multi-cloud visibility platform infrastructure including on-premise data centers, cloud web servers and cloud platforms. Slidegeeks is here to make your presentations a breeze with Cloud Computing Scalability Cloud Visibility Management Platform Pictures PDF With our easy-to-use and customizable templates, you can focus on delivering your ideas rather than worrying about formatting. With a variety of designs to choose from, youre sure to find one that suits your needs. And with animations and unique photos, illustrations, and fonts, you can make your presentation pop. So whether youre giving a sales pitch or presenting to the board, make sure to check out Slidegeeks first.
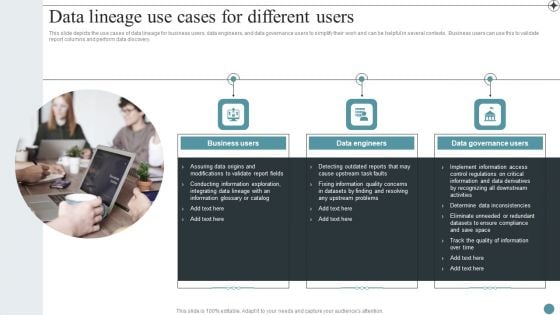
Data Lineage Use Cases For Different Users Deploying Data Lineage IT Demonstration PDF
This slide depicts the use cases of data lineage for business users, data engineers, and data governance users to simplify their work and can be helpful in several contexts. Business users can use this to validate report columns and perform data discovery.Are you in need of a template that can accommodate all of your creative concepts This one is crafted professionally and can be altered to fit any style. Use it with Google Slides or PowerPoint. Include striking photographs, symbols, depictions, and other visuals. Fill, move around, or remove text boxes as desired. Test out color palettes and font mixtures. Edit and save your work, or work with colleagues. Download Data Lineage Use Cases For Different Users Deploying Data Lineage IT Demonstration PDF and observe how to make your presentation outstanding. Give an impeccable presentation to your group and make your presentation unforgettable.
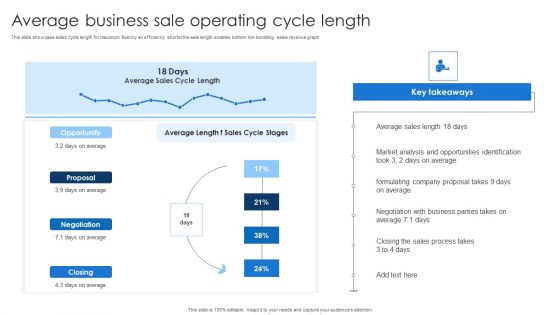
Average Business Sale Operating Cycle Length Ideas PDF
This slide showcase sales cycle length for maximum fluency an efficiency shorter the sale length enables bottom line boosting sales revenue graph.Showcasing this set of slides titled Average Business Sale Operating Cycle Length Ideas PDF. The topics addressed in these templates are Average Sales, Opportunities Identification, Negotiation Business. All the content presented in this PPT design is completely editable. Download it and make adjustments in color, background, font etc. as per your unique business setting.
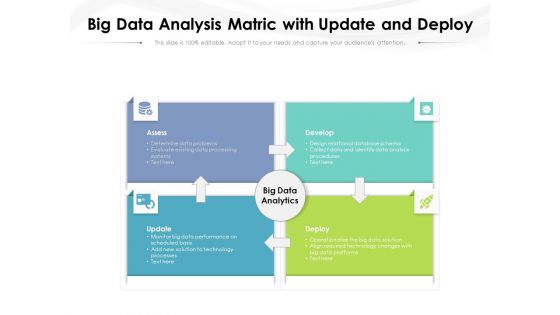
Big Data Analysis Matric With Update And Deploy Ppt PowerPoint Presentation Inspiration Styles PDF
Presenting this set of slides with name big data analysis matric with update and deploy ppt powerpoint presentation inspiration styles pdf. This is a four stage process. The stages in this process are assess, develop, update, deploy, big data analytics. This is a completely editable PowerPoint presentation and is available for immediate download. Download now and impress your audience.
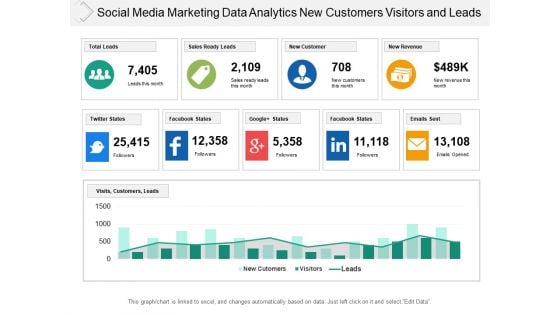
Social Media Marketing Data Analytics New Customers Visitors And Leads Ppt PowerPoint Presentation Professional Pictures
This is a social media marketing data analytics new customers visitors and leads ppt powerpoint presentation professional pictures. This is a two stage process. The stages in this process are business analytics, ba, organizations data.


 Continue with Email

 Home
Home


