Snapshot
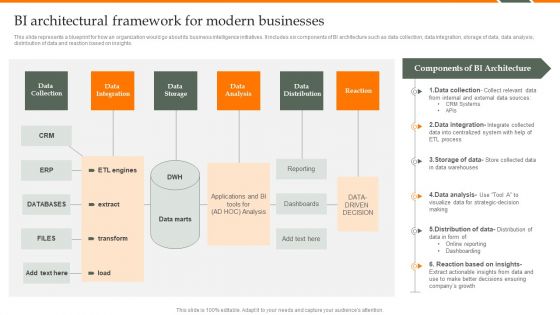
Human Resource Analytics Bi Architectural Framework For Modern Businesses Pictures PDF
This slide represents a blueprint for how an organization would go about its business intelligence initiatives. It includes six components of BI architecture such as data collection, data integration, storage of data, data analysis, distribution of data and reaction based on insights. Want to ace your presentation in front of a live audience Our Human Resource Analytics Bi Architectural Framework For Modern Businesses Pictures PDF can help you do that by engaging all the users towards you. Slidegeeks experts have put their efforts and expertise into creating these impeccable powerpoint presentations so that you can communicate your ideas clearly. Moreover, all the templates are customizable, and easy-to-edit and downloadable. Use these for both personal and commercial use.
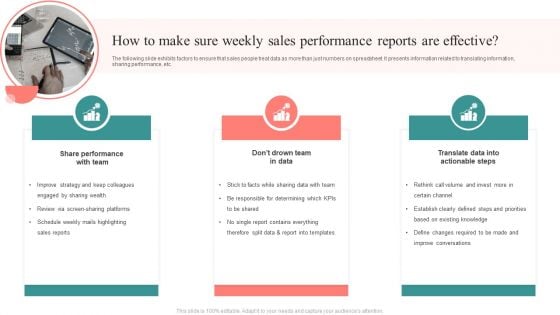
How To Make Sure Weekly Sales Performance Reports Are Effective Ideas PDF
The following slide exhibits factors to ensure that sales people treat data as more than just numbers on spreadsheet. It presents information related to translating information, sharing performance, etc. Presenting How To Make Sure Weekly Sales Performance Reports Are Effective Ideas PDF to dispense important information. This template comprises three stages. It also presents valuable insights into the topics including Share Performance Team, Team Data, Translate Data, Actionable Steps. This is a completely customizable PowerPoint theme that can be put to use immediately. So, download it and address the topic impactfully.
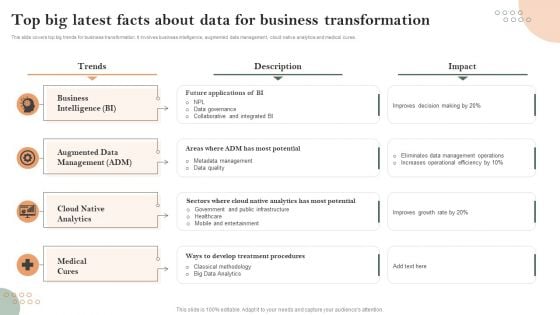
Top Big Latest Facts About Data For Business Transformation Information PDF
This slide covers top big trends for business transformation. It involves business intelligence, augmented data management, cloud native analytics and medical cures. Showcasing this set of slides titled Top Big Latest Facts About Data For Business Transformation Information PDF. The topics addressed in these templates are Business Intelligence, Augmented Data Management, Cloud Native Analytics. All the content presented in this PPT design is completely editable. Download it and make adjustments in color, background, font etc. as per your unique business setting.
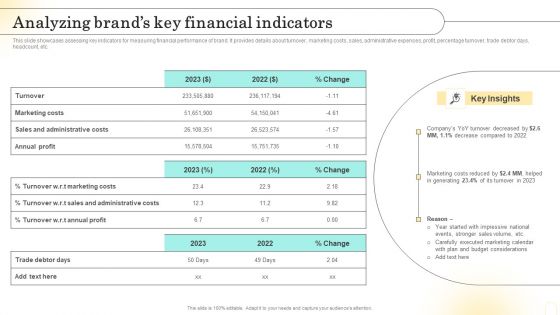
Emotional Marketing Strategy To Nurture Analyzing Brands Key Financial Indicators Demonstration PDF
This slide showcases assessing key indicators for measuring financial performance of brand. It provides details about turnover, marketing costs, sales, administrative expenses, profit, percentage turnover, trade debtor days, headcount, etc. Create an editable Emotional Marketing Strategy To Nurture Analyzing Brands Key Financial Indicators Demonstration PDF that communicates your idea and engages your audience. Whether youre presenting a business or an educational presentation, pre-designed presentation templates help save time. Emotional Marketing Strategy To Nurture Analyzing Brands Key Financial Indicators Demonstration PDF is highly customizable and very easy to edit, covering many different styles from creative to business presentations. Slidegeeks has creative team members who have crafted amazing templates. So, go and get them without any delay.
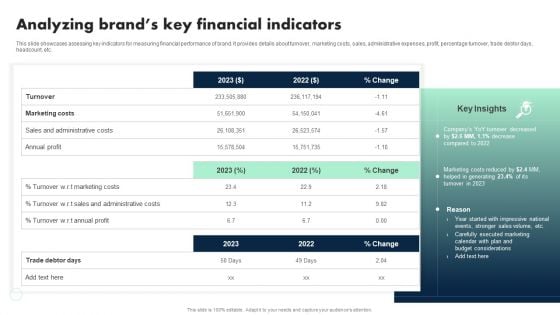
Apple Emotional Marketing Strategy Analyzing Brands Key Financial Indicators Rules PDF
This slide showcases assessing key indicators for measuring financial performance of brand. It provides details about turnover, marketing costs, sales, administrative expenses, profit, percentage turnover, trade debtor days, headcount, etc. Here you can discover an assortment of the finest PowerPoint and Google Slides templates. With these templates, you can create presentations for a variety of purposes while simultaneously providing your audience with an eye catching visual experience. Download Apple Emotional Marketing Strategy Analyzing Brands Key Financial Indicators Rules PDF to deliver an impeccable presentation. These templates will make your job of preparing presentations much quicker, yet still, maintain a high level of quality. Slidegeeks has experienced researchers who prepare these templates and write high quality content for you. Later on, you can personalize the content by editing the Apple Emotional Marketing Strategy Analyzing Brands Key Financial Indicators Rules PDF.
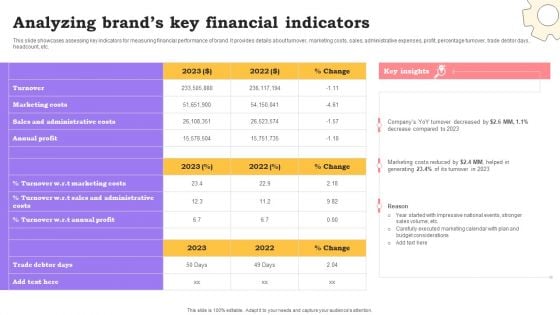
Marketing Commodities And Offerings Analyzing Brands Key Financial Indicators Demonstration PDF
This slide showcases assessing key indicators for measuring financial performance of brand. It provides details about turnover, marketing costs, sales, administrative expenses, profit, percentage turnover, trade debtor days, headcount, etc. Here you can discover an assortment of the finest PowerPoint and Google Slides templates. With these templates, you can create presentations for a variety of purposes while simultaneously providing your audience with an eye catching visual experience. Download Marketing Commodities And Offerings Analyzing Brands Key Financial Indicators Demonstration PDF to deliver an impeccable presentation. These templates will make your job of preparing presentations much quicker, yet still, maintain a high level of quality. Slidegeeks has experienced researchers who prepare these templates and write high quality content for you. Later on, you can personalize the content by editing the Marketing Commodities And Offerings Analyzing Brands Key Financial Indicators Demonstration PDF.
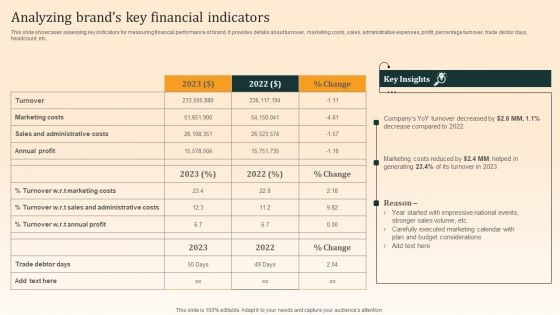
Nike Emotional Branding Strategy Analyzing Brands Key Financial Indicators Summary PDF
This slide showcases assessing key indicators for measuring financial performance of brand. It provides details about turnover, marketing costs, sales, administrative expenses, profit, percentage turnover, trade debtor days, headcount, etc. Create an editable Nike Emotional Branding Strategy Analyzing Brands Key Financial Indicators Summary PDF that communicates your idea and engages your audience. Whether youre presenting a business or an educational presentation, pre designed presentation templates help save time. Nike Emotional Branding Strategy Analyzing Brands Key Financial Indicators Summary PDF is highly customizable and very easy to edit, covering many different styles from creative to business presentations. Slidegeeks has creative team members who have crafted amazing templates. So, go and get them without any delay.

CASB 2 0 IT Cloud Access Security Broker Pillar Data Security
This slide talks about the data security pillar of the cloud access security broker pillar. This slide highlights how CASB data security can help organizations improve their IT requirements and business operations and detect security breaches before they happen. The CASB 2 0 IT Cloud Access Security Broker Pillar Data Security is a compilation of the most recent design trends as a series of slides. It is suitable for any subject or industry presentation, containing attractive visuals and photo spots for businesses to clearly express their messages. This template contains a variety of slides for the user to input data, such as structures to contrast two elements, bullet points, and slides for written information. Slidegeeks is prepared to create an impression. This slide talks about the data security pillar of the cloud access security broker pillar. This slide highlights how CASB data security can help organizations improve their IT requirements and business operations and detect security breaches before they happen.
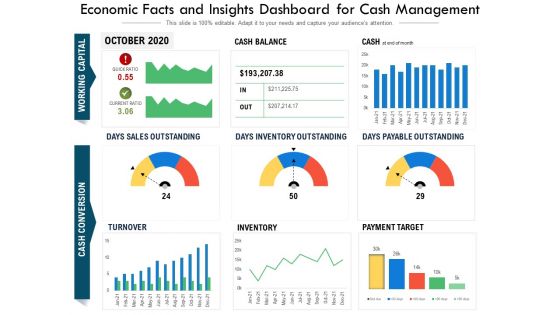
Economic Facts And Insights Dashboard For Cash Management Ppt PowerPoint Presentation Outline Guide PDF
Pitch your topic with ease and precision using this economic facts and insights dashboard for cash management ppt powerpoint presentation outline guide pdf. This layout presents information on days sales outstanding, days inventory outstanding, days payable outstanding, accounts payable by payment target, inventory, ar turnover vs ap turnover. It is also available for immediate download and adjustment. So, changes can be made in the color, design, graphics or any other component to create a unique layout.
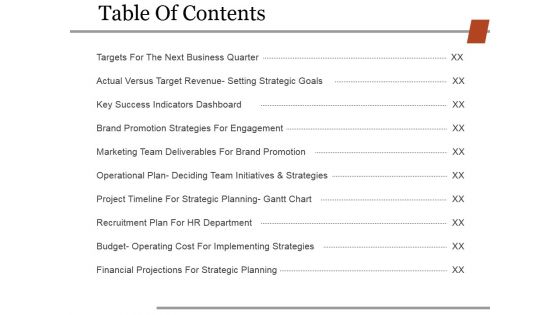
Table Of Contents Template 1 Ppt PowerPoint Presentation Infographic Template Gridlines
This is a table of contents template 1 ppt powerpoint presentation infographic template gridlines. This is a ten stage process. The stages in this process are targets for the next business quarter, actual versus target revenue setting strategic goals, key success indicators dashboard.

Splunk Analysis Of Big Data To Assess Business Value Sample Pdf
Following slide showcases splunk big data analysis to evaluate business value. The purpose of this slide is to help businesses in forming better decisions by providing insights into their data. It includes components such as search, deploy, proactive monitoring, etc. Showcasing this set of slides titled Splunk Analysis Of Big Data To Assess Business Value Sample Pdf The topics addressed in these templates are Enterprise Scalability, Operational Intelligence All the content presented in this PPT design is completely editable. Download it and make adjustments in color, background, font etc. as per your unique business setting. Following slide showcases splunk big data analysis to evaluate business value. The purpose of this slide is to help businesses in forming better decisions by providing insights into their data. It includes components such as search, deploy, proactive monitoring, etc.
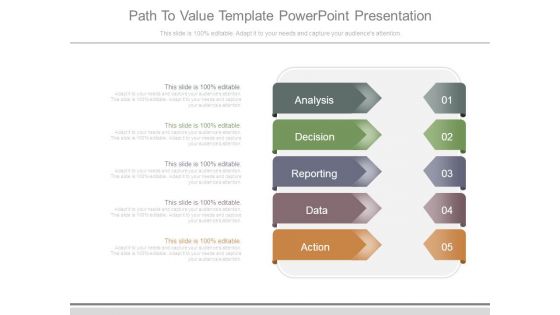
Path To Value Template Powerpoint Presentation
This is a path to value template powerpoint presentation. This is a five stage process. The stages in this process are analysis, decision, reporting, data, action.
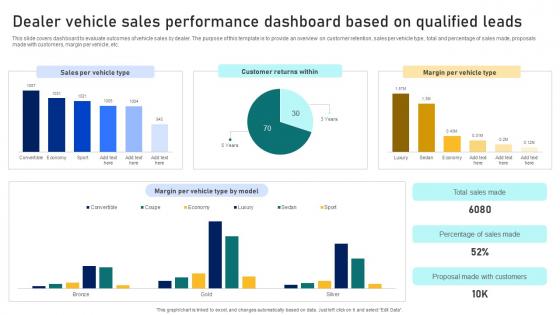
Guide To Building A Successful Dealer Vehicle Sales Performance Dashboard Based On Qualified Strategy SS V
This slide covers dashboard to evaluate outcomes of vehicle sales by dealer. The purpose of this template is to provide an overview on customer retention, sales per vehicle type, total and percentage of sales made, proposals made with customers, margin per vehicle, etc. Present like a pro with Guide To Building A Successful Dealer Vehicle Sales Performance Dashboard Based On Qualified Strategy SS V. Create beautiful presentations together with your team, using our easy-to-use presentation slides. Share your ideas in real-time and make changes on the fly by downloading our templates. So whether you are in the office, on the go, or in a remote location, you can stay in sync with your team and present your ideas with confidence. With Slidegeeks presentation got a whole lot easier. Grab these presentations today. This slide covers dashboard to evaluate outcomes of vehicle sales by dealer. The purpose of this template is to provide an overview on customer retention, sales per vehicle type, total and percentage of sales made, proposals made with customers, margin per vehicle, etc.
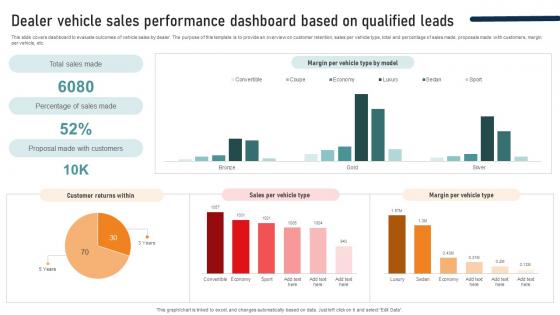
Ultimate Guide To Developing Dealer Vehicle Sales Performance Dashboard Based On Qualified Strategy SS V
This slide covers dashboard to evaluate outcomes of vehicle sales by dealer. The purpose of this template is to provide an overview on customer retention, sales per vehicle type, total and percentage of sales made, proposals made with customers, margin per vehicle, etc. Present like a pro with Ultimate Guide To Developing Dealer Vehicle Sales Performance Dashboard Based On Qualified Strategy SS V. Create beautiful presentations together with your team, using our easy-to-use presentation slides. Share your ideas in real-time and make changes on the fly by downloading our templates. So whether you are in the office, on the go, or in a remote location, you can stay in sync with your team and present your ideas with confidence. With Slidegeeks presentation got a whole lot easier. Grab these presentations today. This slide covers dashboard to evaluate outcomes of vehicle sales by dealer. The purpose of this template is to provide an overview on customer retention, sales per vehicle type, total and percentage of sales made, proposals made with customers, margin per vehicle, etc.
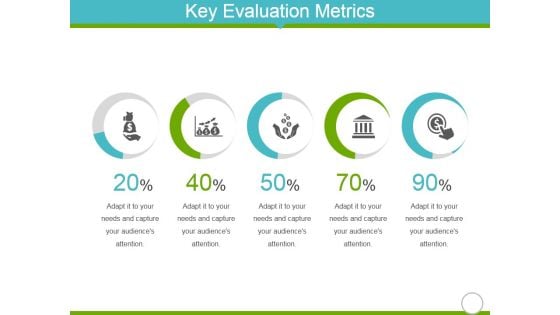
Key Evaluation Metrics Ppt Powerpoint Presentation Styles Design Inspiration
This is a key evaluation metrics ppt powerpoint presentation styles design inspiration. This is a five stage process. The stages in this process are business, marketing, icons, finance.
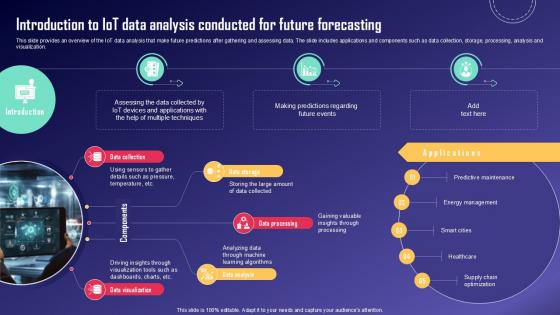
Introduction To IoT Data Analysis IoT Fleet Monitoring Ppt PowerPoint IoT SS V
This slide provides an overview of the IoT data analysis that make future predictions after gathering and assessing data. The slide includes applications and components such as data collection, storage, processing, analysis and visualization. Are you in need of a template that can accommodate all of your creative concepts This one is crafted professionally and can be altered to fit any style. Use it with Google Slides or PowerPoint. Include striking photographs, symbols, depictions, and other visuals. Fill, move around, or remove text boxes as desired. Test out color palettes and font mixtures. Edit and save your work, or work with colleagues. Download Introduction To IoT Data Analysis IoT Fleet Monitoring Ppt PowerPoint IoT SS V and observe how to make your presentation outstanding. Give an impeccable presentation to your group and make your presentation unforgettable. This slide provides an overview of the IoT data analysis that make future predictions after gathering and assessing data. The slide includes applications and components such as data collection, storage, processing, analysis and visualization.
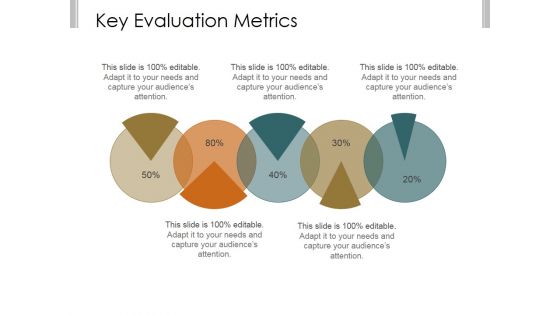
Key Evaluation Metrics Ppt PowerPoint Presentation Example File
This is a key evaluation metrics ppt powerpoint presentation example file. This is a five stage process. The stages in this process are business, strategy, marketing, analysis, finance.
Key Evaluation Metrics Ppt PowerPoint Presentation Show Guide
This is a key evaluation metrics ppt powerpoint presentation show guide. This is a five stage process. The stages in this process are donut, icons, business, strategy, analysis.
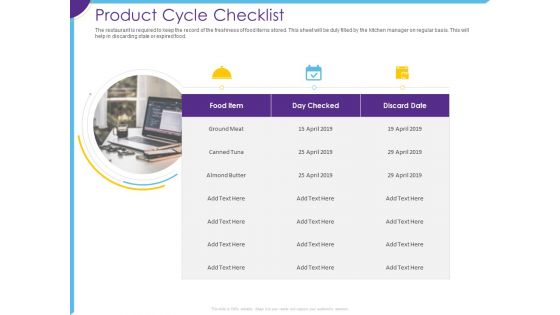
Optimization Restaurant Operations Product Cycle Checklist Ppt Gallery Objects PDF
Deliver an awe-inspiring pitch with this creative optimization restaurant operations product cycle checklist ppt gallery objects pdf bundle. Topics like food item, day checked, discard date can be discussed with this completely editable template. It is available for immediate download depending on the needs and requirements of the user.
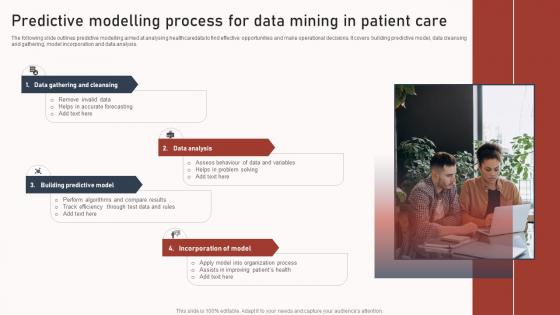
Predictive Modelling Process For Data Mining In Patient Care Slides Pdf
The following slide outlines predictive modelling aimed at analysing healthcaredata to find effective opportunities and make operational decisions. It covers building predictive model, data cleansing and gathering, model incorporation and data analysis. Showcasing this set of slides titled Predictive Modelling Process For Data Mining In Patient Care Slides Pdf. The topics addressed in these templates are Data Gathering Cleansing, Data Analysis, Incorporation Model. All the content presented in this PPT design is completely editable. Download it and make adjustments in color, background, font etc. as per your unique business setting. The following slide outlines predictive modelling aimed at analysing healthcaredata to find effective opportunities and make operational decisions. It covers building predictive model, data cleansing and gathering, model incorporation and data analysis.
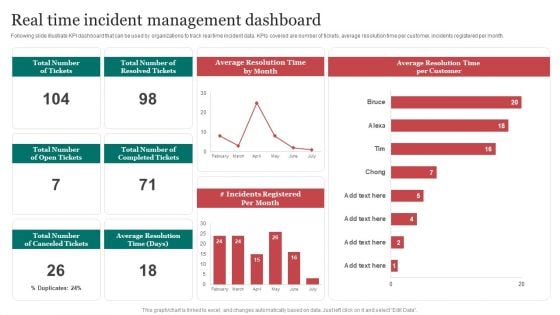
Real Time Incident Management Improving Cybersecurity With Incident Professional PDF
Following slide illustrate KPI dashboard that can be used by organizations to track real time incident data. KPIs covered are number of tickets, average resolution time per customer, incidents registered per month. The Real Time Incident Management Improving Cybersecurity With Incident Professional PDF is a compilation of the most recent design trends as a series of slides. It is suitable for any subject or industry presentation, containing attractive visuals and photo spots for businesses to clearly express their messages. This template contains a variety of slides for the user to input data, such as structures to contrast two elements, bullet points, and slides for written information. Slidegeeks is prepared to create an impression.
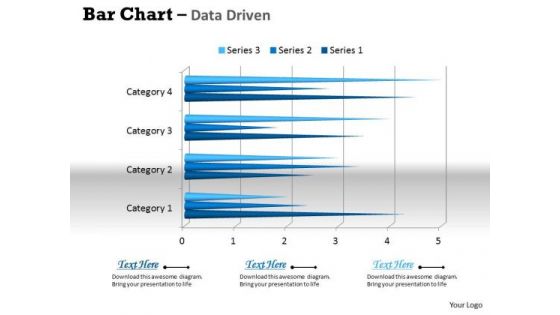
Data Analysis In Excel 3d Bar Chart For Business Trends PowerPoint Templates
Connect The Dots With Our data analysis in excel 3d bar chart for business trends Powerpoint Templates . Watch The Whole Picture Clearly Emerge.
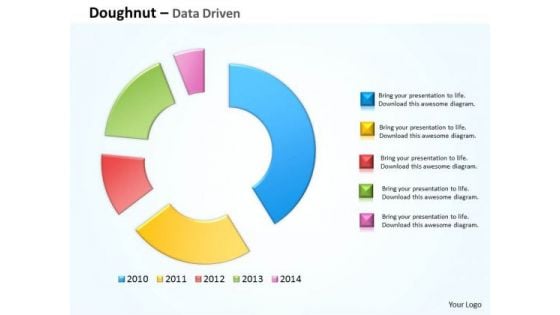
Financial Data Analysis Driven Compare Market Share Of Brand PowerPoint Templates
Doll Up Your Thoughts With Our financial data analysis driven compare market share of brand Powerpoint Templates . They Will Make A Pretty Picture.
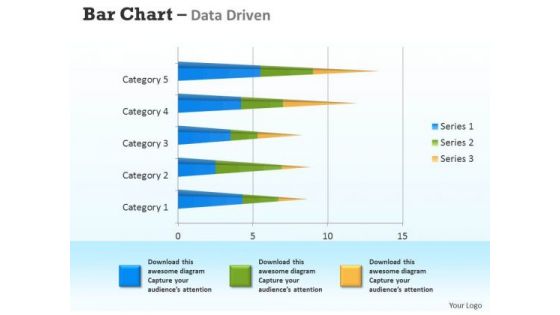
Microsoft Excel Data Analysis 3d Bar Chart For Analyzing Survey PowerPoint Templates
Connect The Dots With Our microsoft excel data analysis 3d bar chart for analyzing survey Powerpoint Templates . Watch The Whole Picture Clearly Emerge.
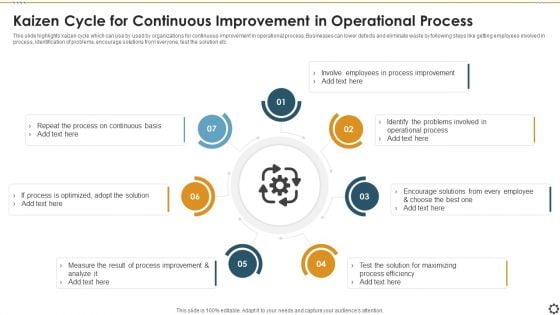
Kaizen Cycle For Continuous Improvement In Operational Process Formats PDF
This slide highlights kaizen cycle which can use by used by organizations for continuous improvement in operational process. Businesses can lower defects and eliminate waste by following steps like getting employees involved in process, identification of problems, encourage solutions from everyone, test the solution etc. Persuade your audience using this kaizen cycle for continuous improvement in operational process formats pdf. This PPT design covers seven stages, thus making it a great tool to use. It also caters to a variety of topics including involve employees in process improvement, operational process, encourage solutions , employee and choose. Download this PPT design now to present a convincing pitch that not only emphasizes the topic but also showcases your presentation skills.

Performing Basket Analysis In Ecommerce Using Data Mining Tools To Optimize Processes AI SS V
This slide showcases basket analysis, a data mining technique which can guide ecommerce websites to identify customer insights properly. It provides details about product affinities, shopper profile, planograms, product combos, etc. Presenting this PowerPoint presentation, titled Performing Basket Analysis In Ecommerce Using Data Mining Tools To Optimize Processes AI SS V, with topics curated by our researchers after extensive research. This editable presentation is available for immediate download and provides attractive features when used. Download now and captivate your audience. Presenting this Performing Basket Analysis In Ecommerce Using Data Mining Tools To Optimize Processes AI SS V. Our researchers have carefully researched and created these slides with all aspects taken into consideration. This is a completely customizable Performing Basket Analysis In Ecommerce Using Data Mining Tools To Optimize Processes AI SS V that is available for immediate downloading. Download now and make an impact on your audience. Highlight the attractive features available with our PPTs. This slide showcases basket analysis, a data mining technique which can guide ecommerce websites to identify customer insights properly. It provides details about product affinities, shopper profile, planograms, product combos, etc.
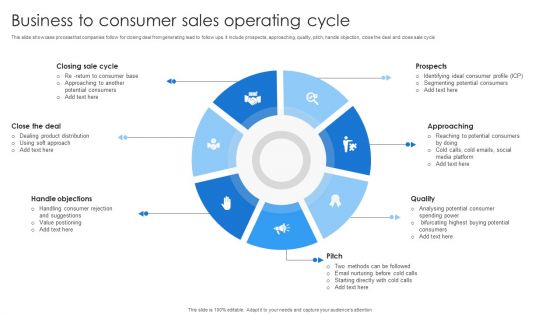
Business To Consumer Sales Operating Cycle Introduction PDF
This slide showcase process that companies follow for closing deal from generating lead to follow ups. It include prospects, approaching, quality, pitch, handle objection, close the deal and close sale cycle.Presenting Business To Consumer Sales Operating Cycle Introduction PDF to dispense important information. This template comprises seven stages. It also presents valuable insights into the topics including Approaching Another, Handle Objections, Segmenting Potential. This is a completely customizable PowerPoint theme that can be put to use immediately. So, download it and address the topic impactfully.
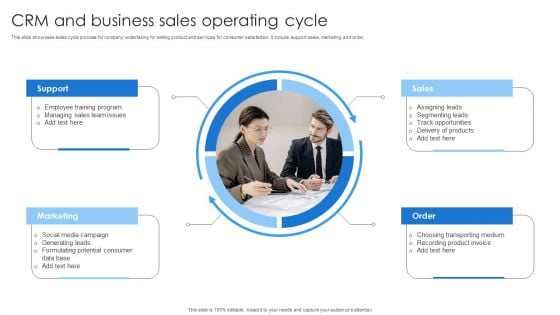
CRM And Business Sales Operating Cycle Clipart PDF
This slide showcase sales cycle process for company undertaking for selling product and services for consumer satisfaction. It include support sales, marketing and order.Persuade your audience using this CRM And Business Sales Operating Cycle Clipart PDF. This PPT design covers four stages, thus making it a great tool to use. It also caters to a variety of topics including Generating Leads, Formulating Potential, Track Opportunities. Download this PPT design now to present a convincing pitch that not only emphasizes the topic but also showcases your presentation skills.
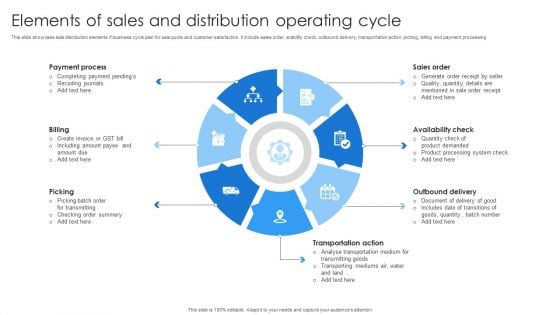
Elements Of Sales And Distribution Operating Cycle Microsoft PDF
This slide showcase sale distribution elements if business cycle plan for sale quote and customer satisfaction. It include sales order, arability check, outbound delivery, transportation action, picking, billing and payment processing.Presenting Elements Of Sales And Distribution Operating Cycle Microsoft PDF to dispense important information. This template comprises seven stages. It also presents valuable insights into the topics including Document Delivery, Includes Date, Goods Quantity. This is a completely customizable PowerPoint theme that can be put to use immediately. So, download it and address the topic impactfully.

Strategies To Boost Business Sales Operating Cycle Introduction PDF
This slide showcase tactics to be followed to escalate sales and smooth sales cycle into the process. It includes automotive repetitive task, high performance, use incremental closes, planning sales meeting and CRM contact list.Presenting Strategies To Boost Business Sales Operating Cycle Introduction PDF to dispense important information. This template comprises five stages. It also presents valuable insights into the topics including Performing Channels, Incremental Closes, Planning Sales. This is a completely customizable PowerPoint theme that can be put to use immediately. So, download it and address the topic impactfully.
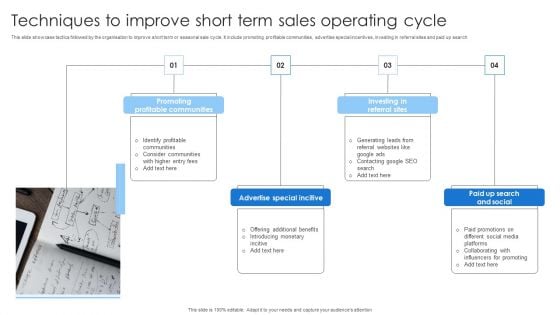
Techniques To Improve Short Term Sales Operating Cycle Brochure PDF
This slide showcase tactics followed by the organisation to improve short term or seasonal sale cycle. It include promoting profitable communities, advertise special incentives, investing in referral sites and paid up search. Presenting Techniques To Improve Short Term Sales Operating Cycle Brochure PDF to dispense important information. This template comprises four stages. It also presents valuable insights into the topics including Advertise Special Incitive, Profitable Investing, Referral Sites. This is a completely customizable PowerPoint theme that can be put to use immediately. So, download it and address the topic impactfully.
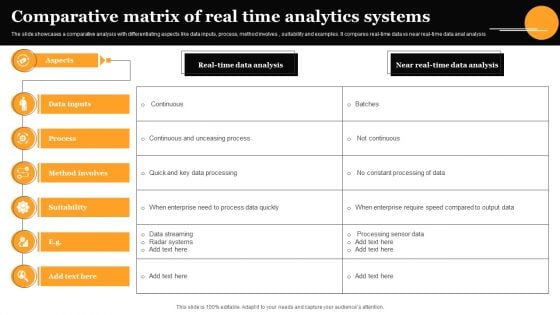
Comparative Matrix Of Real Time Analytics Systems Background PDF
The slide showcases a comparative analysis with differentiating aspects like data inputs, process, method involves , suitability and examples. It compares real-time data vs near real-time data anal analysis. Showcasing this set of slides titled Comparative Matrix Of Real Time Analytics Systems Background PDF. The topics addressed in these templates are Data Inputs, Process, Method Involves. All the content presented in this PPT design is completely editable. Download it and make adjustments in color, background, font etc. as per your unique business setting.
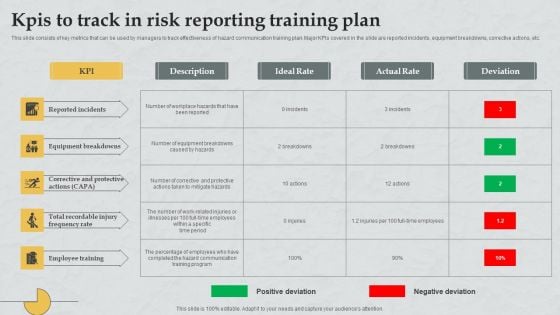
Kpis To Track In Risk Reporting Training Plan Introduction PDF
This slide consists of key metrics that can be used by managers to track effectiveness of hazard communication training plan. Major KPIs covered in the slide are reported incidents, equipment breakdowns, corrective actions, etc. Showcasing this set of slides titled Kpis To Track In Risk Reporting Training Plan Introduction PDF. The topics addressed in these templates are Reported Incidents, Equipment Breakdowns, Corrective Protective Actions. All the content presented in this PPT design is completely editable. Download it and make adjustments in color, background, font etc. as per your unique business setting.

Stock Photo New Business Strategy Picture Of American Star Stock Photos
Our New Business Strategy Picture Of American Star Stock Photos Powerpoint Templates Enjoy Drama. They Provide Entertaining Backdrops.
Generate Digitalization Roadmap For Business Icons Slide Inspiration PDF
Help your business to create an attention grabbing presentation using our generate digitalization roadmap for business digital vitality dashboard diagrams pdf set of slides. The slide contains innovative icons that can be flexibly edited. Choose this generate digitalization roadmap for business digital vitality dashboard diagrams pdf template to create a satisfactory experience for your customers. Go ahead and click the download button.
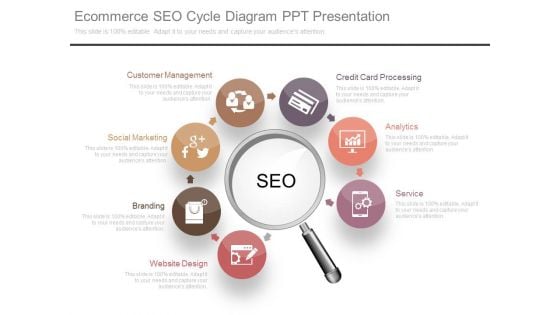
Ecommerce Seo Cycle Diagram Ppt Presentation
This is a ecommerce seo cycle diagram ppt presentation. This is a seven stage process. The stages in this process are service, analytics, credit card processing, customer management, social marketing, branding, website design.
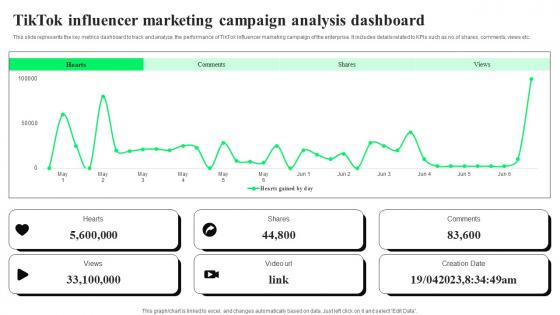
TikTok Influencer Marketing Campaign TikTok Advertising Strategies To Provide Effective Themes Pdf
This slide represents the key metrics dashboard to track and analyze the performance of TikTok influencer marketing campaign of the enterprise. It includes details related to KPIs such as no.of shares, comments, views etc. Slidegeeks is here to make your presentations a breeze with TikTok Influencer Marketing Campaign TikTok Advertising Strategies To Provide Effective Themes Pdf With our easy to use and customizable templates, you can focus on delivering your ideas rather than worrying about formatting. With a variety of designs to choose from, you are sure to find one that suits your needs. And with animations and unique photos, illustrations, and fonts, you can make your presentation pop. So whether you are giving a sales pitch or presenting to the board, make sure to check out Slidegeeks first This slide represents the key metrics dashboard to track and analyze the performance of TikTok influencer marketing campaign of the enterprise. It includes details related to KPIs such as no.of shares, comments, views etc.
Support Center Report On Agents Monthly Performance Icons PDF
This slide signifies the matrix on call center report based on monthly performance evaluation of all agents. It includes name of customer support executive, total calls done, average duration and conversions. Showcasing this set of slides titled Support Center Report On Agents Monthly Performance Icons PDF. The topics addressed in these templates are Support Center Report, On Agents, Monthly Performance. All the content presented in this PPT design is completely editable. Download it and make adjustments in color, background, font etc. as per your unique business setting.
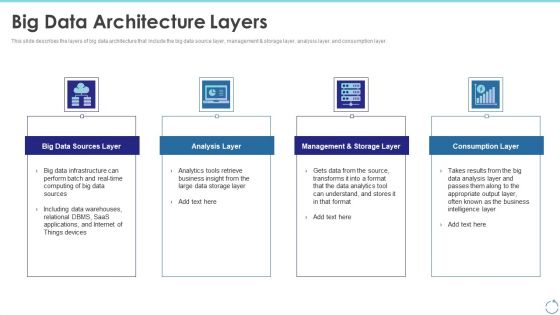
Big Data Architecture Layers Ppt Gallery Information PDF
This slide describes the layers of big data architecture that include the big data source layer, management and storage layer, analysis layer, and consumption layer. This is a big data architecture layers ppt gallery information pdf template with various stages. Focus and dispense information on four stages using this creative set, that comes with editable features. It contains large content boxes to add your information on topics like devices, applications, data warehouses, analytics. You can also showcase facts, figures, and other relevant content using this PPT layout. Grab it now.
Warehouse Key Management Metrics For Performance Measurement Icon Inspiration PDF
Showcasing this set of slides titled Warehouse Key Management Metrics For Performance Measurement Icon Inspiration PDF. The topics addressed in these templates are Warehouse, Key Management Metrics, Performance Measurement Icon. All the content presented in this PPT design is completely editable. Download it and make adjustments in color, background, font etc. as per your unique business setting.
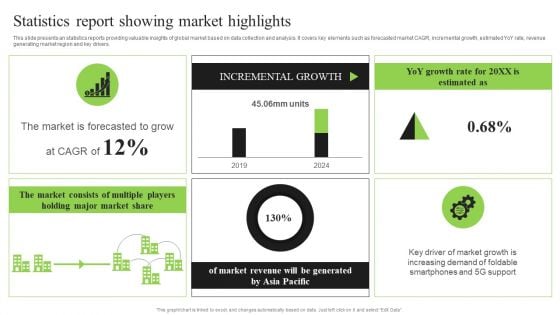
Guidebook For Executing Business Market Intelligence Statistics Report Showing Market Graphics PDF
This slide presents an statistics reports providing valuable insights of global market based on data collection and analysis. It covers key elements such as forecasted market CAGR, incremental growth, estimated YoY rate, revenue generating market region and key drivers. Do you have to make sure that everyone on your team knows about any specific topic I yes, then you should give Guidebook For Executing Business Market Intelligence Statistics Report Showing Market Graphics PDF a try. Our experts have put a lot of knowledge and effort into creating this impeccable Guidebook For Executing Business Market Intelligence Statistics Report Showing Market Graphics PDF. You can use this template for your upcoming presentations, as the slides are perfect to represent even the tiniest detail. You can download these templates from the Slidegeeks website and these are easy to edit. So grab these today.
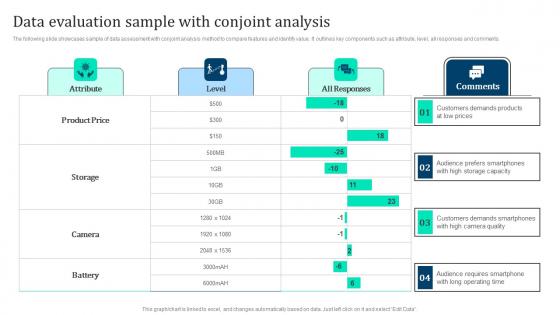
Data Evaluation Sample With Conjoint Marketing Intelligence Guide Data Gathering Sample Pdf
The following slide showcases sample of data assessment with conjoint analysis method to compare features and identify value. It outlines key components such as attribute, level, all responses and comments. Slidegeeks is here to make your presentations a breeze with Data Evaluation Sample With Conjoint Marketing Intelligence Guide Data Gathering Sample Pdf With our easy to use and customizable templates, you can focus on delivering your ideas rather than worrying about formatting. With a variety of designs to choose from, you are sure to find one that suits your needs. And with animations and unique photos, illustrations, and fonts, you can make your presentation pop. So whether you are giving a sales pitch or presenting to the board, make sure to check out Slidegeeks first The following slide showcases sample of data assessment with conjoint analysis method to compare features and identify value. It outlines key components such as attribute, level, all responses and comments.
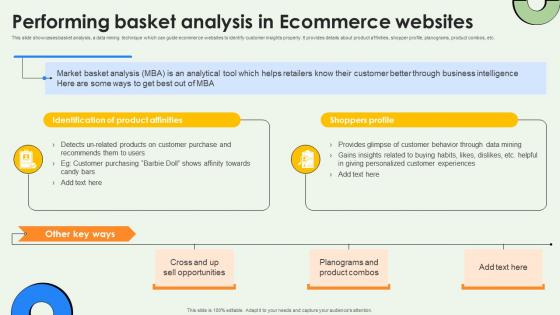
Data Warehousing And Performing Basket Analysis In Ecommerce Websites AI SS V
This slide showcases basket analysis, a data mining technique which can guide ecommerce websites to identify customer insights properly. It provides details about product affinities, shopper profile, planograms, product combos, etc. If you are looking for a format to display your unique thoughts, then the professionally designed Data Warehousing And Performing Basket Analysis In Ecommerce Websites AI SS V is the one for you. You can use it as a Google Slides template or a PowerPoint template. Incorporate impressive visuals, symbols, images, and other charts. Modify or reorganize the text boxes as you desire. Experiment with shade schemes and font pairings. Alter, share or cooperate with other people on your work. Download Data Warehousing And Performing Basket Analysis In Ecommerce Websites AI SS V and find out how to give a successful presentation. Present a perfect display to your team and make your presentation unforgettable. This slide showcases basket analysis, a data mining technique which can guide ecommerce websites to identify customer insights properly. It provides details about product affinities, shopper profile, planograms, product combos, etc.
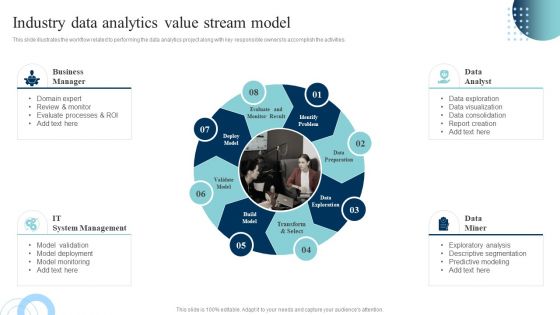
Data Evaluation And Processing Toolkit Industry Data Analytics Value Stream Model Clipart PDF
This slide illustrates the workflow related to performing the data analytics project along with key responsible owners to accomplish the activities. The Data Evaluation And Processing Toolkit Industry Data Analytics Value Stream Model Clipart PDF is a compilation of the most recent design trends as a series of slides. It is suitable for any subject or industry presentation, containing attractive visuals and photo spots for businesses to clearly express their messages. This template contains a variety of slides for the user to input data, such as structures to contrast two elements, bullet points, and slides for written information. Slidegeeks is prepared to create an impression.
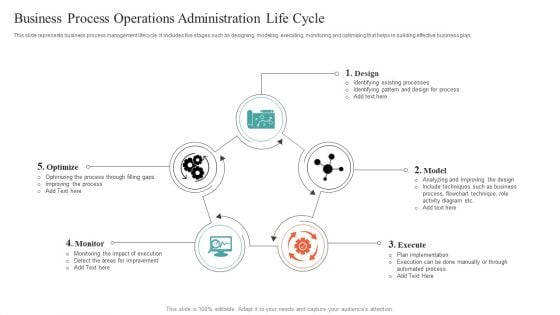
Business Process Operations Administration Life Cycle Slides PDF
This slide represents business process management lifecycle. It includes five stages such as designing, modeling, executing, monitoring and optimizing that helps in building effective business plan. Presenting Business Process Operations Administration Life Cycle Slides PDF to dispense important information. This template comprises five stages. It also presents valuable insights into the topics including Optimize, Design, Execute. This is a completely customizable PowerPoint theme that can be put to use immediately. So, download it and address the topic impactfully.
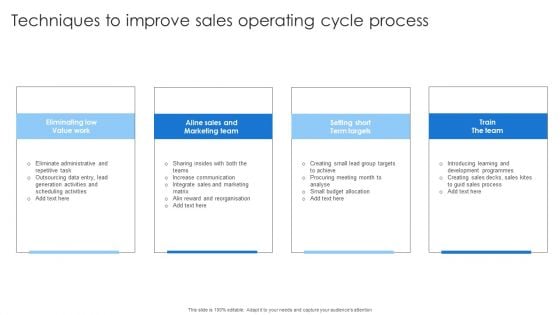
Techniques To Improve Sales Operating Cycle Process Professional PDF
Persuade your audience using this Techniques To Improve Sales Operating Cycle Process Professional PDF. This PPT design covers four stages, thus making it a great tool to use. It also caters to a variety of topics including Marketing Team, Eliminate Administrative, Reward Reorganisation. Download this PPT design now to present a convincing pitch that not only emphasizes the topic but also showcases your presentation skills.
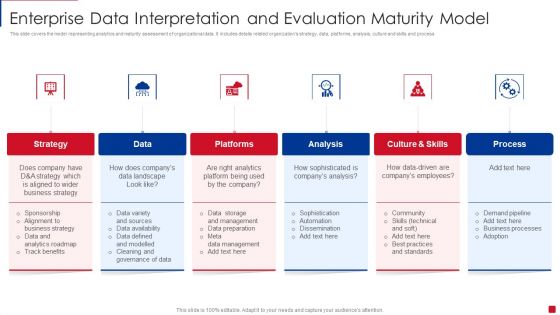
Enterprise Data Interpretation And Evaluation Maturity Model Slides PDF
This slide covers the model representing analytics and maturity assessment of organizational data. It includes details related organizations strategy, data, platforms, analysis, culture and skills and process Persuade your audience using this Enterprise Data Interpretation And Evaluation Maturity Model Slides PDF. This PPT design covers six stages, thus making it a great tool to use. It also caters to a variety of topics including Platforms, Analysis, Culture And Skills. Download this PPT design now to present a convincing pitch that not only emphasizes the topic but also showcases your presentation skills.
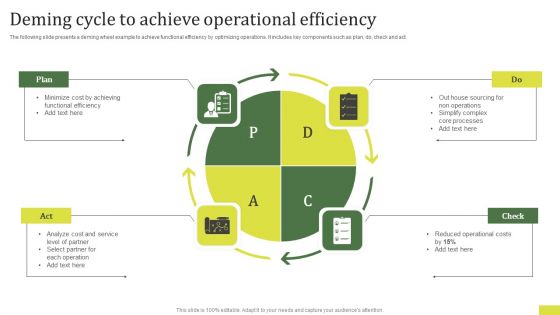
Deming Cycle To Achieve Operational Efficiency Information PDF
The following slide presents a deming wheel example to achieve functional efficiency by optimizing operations. It includes key components such as plan, do, check and act. Persuade your audience using this Deming Cycle To Achieve Operational Efficiency Information PDF. This PPT design covers four stages, thus making it a great tool to use. It also caters to a variety of topics including Plan, Act, Check. Download this PPT design now to present a convincing pitch that not only emphasizes the topic but also showcases your presentation skills.
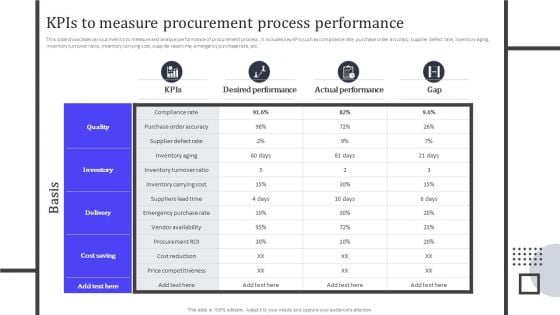
Kpis To Measure Procurement Process Performance Template PDF
This slide showcases various metrics to measure and analyze performance of procurement process . It includes key KPIs such as compliance rate, purchase order accuracy, supplier defect rate, inventory aging, inventory turnover ratio, inventory carrying cost, supplier lead time, emergency purchase rate, etc. From laying roadmaps to briefing everything in detail, our templates are perfect for you. You can set the stage with your presentation slides. All you have to do is download these easy to edit and customizable templates. Kpis To Measure Procurement Process Performance Template PDF will help you deliver an outstanding performance that everyone would remember and praise you for. Do download this presentation today.
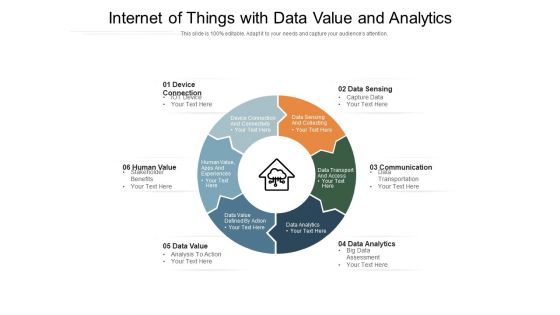
Internet Of Things With Data Value And Analytics Ppt PowerPoint Presentation Gallery Pictures PDF
Presenting this set of slides with name internet of things with data value and analytics ppt powerpoint presentation gallery pictures pdf. This is a six stage process. The stages in this process are data analytics, data value, data sensing. This is a completely editable PowerPoint presentation and is available for immediate download. Download now and impress your audience.
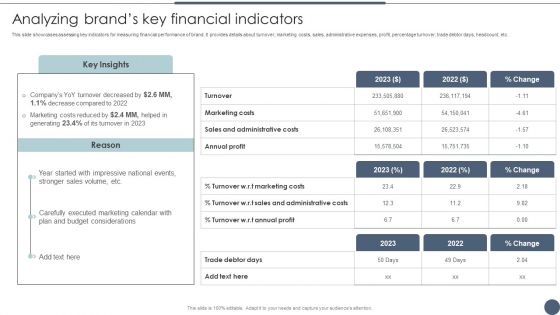
Analyzing Brands Key Financial Indicators Utilizing Emotional And Rational Branding For Improved Consumer Outreach Template PDF
This slide showcases assessing key indicators for measuring financial performance of brand. It provides details about turnover, marketing costs, sales, administrative expenses, profit, percentage turnover, trade debtor days, headcount, etc. Slidegeeks is one of the best resources for PowerPoint templates. You can download easily and regulate Analyzing Brands Key Financial Indicators Utilizing Emotional And Rational Branding For Improved Consumer Outreach Template PDF for your personal presentations from our wonderful collection. A few clicks is all it takes to discover and get the most relevant and appropriate templates. Use our Templates to add a unique zing and appeal to your presentation and meetings. All the slides are easy to edit and you can use them even for advertisement purposes.
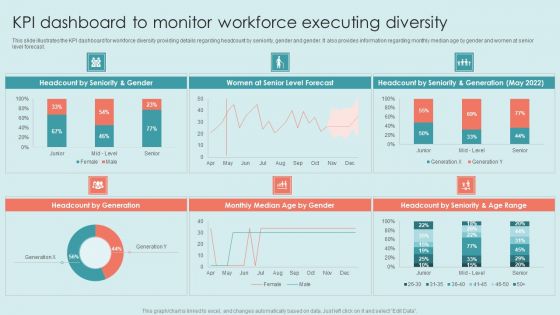
Executing Diversity KPI Dashboard To Monitor Workforce Executing Diversity Background PDF
This slide covers information regarding the key traits of inclusive leadership such as commitment, courage, cognize bias, curiosity etc. It also provides details about thinking to develop and behavior to adopt for becoming an effective inclusive leader. If your project calls for a presentation, then Slidegeeks is your go-to partner because we have professionally designed, easy-to-edit templates that are perfect for any presentation. After downloading, you can easily edit Executing Diversity KPI Dashboard To Monitor Workforce Executing Diversity Background PDF and make the changes accordingly. You can rearrange slides or fill them with different images. Check out all the handy templates.
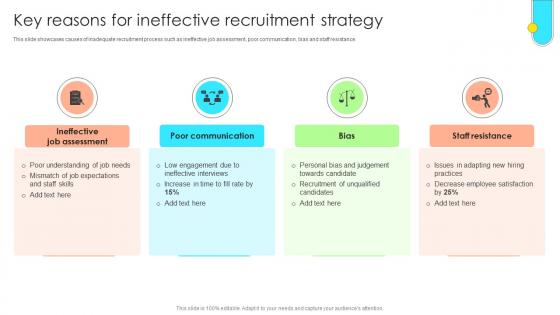
Data Driven Approach To Optimise Key Reasons For Ineffective Recruitment Strategy CRP SS V
This slide showcases causes of inadequate recruitment process such as ineffective job assessment, poor communication, bias and staff resistance. The Data Driven Approach To Optimise Key Reasons For Ineffective Recruitment Strategy CRP SS V is a compilation of the most recent design trends as a series of slides. It is suitable for any subject or industry presentation, containing attractive visuals and photo spots for businesses to clearly express their messages. This template contains a variety of slides for the user to input data, such as structures to contrast two elements, bullet points, and slides for written information. Slidegeeks is prepared to create an impression. This slide showcases causes of inadequate recruitment process such as ineffective job assessment, poor communication, bias and staff resistance.

Before Vs After Data Integration Implementation Data Integration Strategies For Business
This slide showcases the comparative analysis of the before versus after data integration implementation. The purpose of this slide is to discuss the different performance aspects and how data management has proved beneficial for these aspects. Get a simple yet stunning designed Before Vs After Data Integration Implementation Data Integration Strategies For Business. It is the best one to establish the tone in your meetings. It is an excellent way to make your presentations highly effective. So, download this PPT today from Slidegeeks and see the positive impacts. Our easy-to-edit Before Vs After Data Integration Implementation Data Integration Strategies For Business can be your go-to option for all upcoming conferences and meetings. So, what are you waiting for Grab this template today. This slide showcases the comparative analysis of the before versus after data integration implementation. The purpose of this slide is to discuss the different performance aspects and how data management has proved beneficial for these aspects.
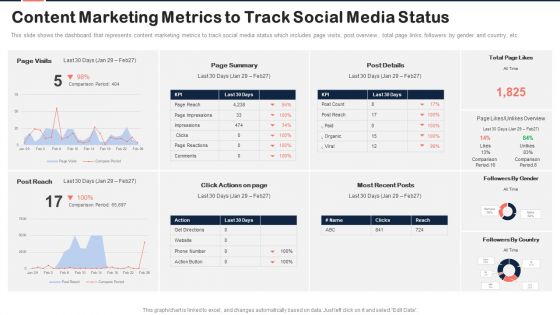
Implementing Content Marketing Plan To Nurture Leads Content Marketing Metrics To Track Diagrams PDF
This slide shows the dashboard that represents content marketing metrics to track social media status which includes page visits, post overview, total page links, followers by gender and country, etc. Crafting an eye catching presentation has never been more straightforward. Let your presentation shine with this tasteful yet straightforward Implementing Content Marketing Plan To Nurture Leads Content Marketing Metrics To Track Diagrams PDF template. It offers a minimalistic and classy look that is great for making a statement. The colors have been employed intelligently to add a bit of playfulness while still remaining professional. Construct the ideal Implementing Content Marketing Plan To Nurture Leads Content Marketing Metrics To Track Diagrams PDF that effortlessly grabs the attention of your audience Begin now and be certain to wow your customers.
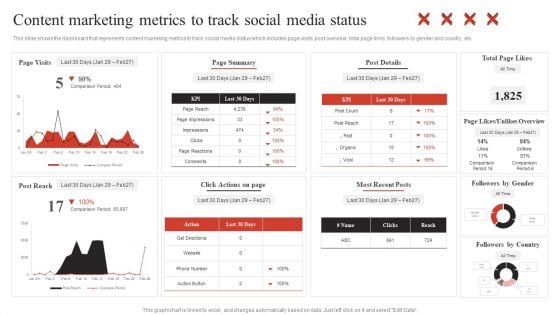
Developing Content Marketing Content Marketing Metrics To Track Social Media Themes PDF
This slide shows the dashboard that represents content marketing metrics to track social media status which includes page visits, post overview, total page links, followers by gender and country, etc. Do you have to make sure that everyone on your team knows about any specific topic I yes, then you should give Developing Content Marketing Content Marketing Metrics To Track Social Media Themes PDF a try. Our experts have put a lot of knowledge and effort into creating this impeccable Developing Content Marketing Content Marketing Metrics To Track Social Media Themes PDF. You can use this template for your upcoming presentations, as the slides are perfect to represent even the tiniest detail. You can download these templates from the Slidegeeks website and these are easy to edit. So grab these today.

Predictive Analytics Methods Predictive Analytics Models For Predictive Problems Graphics PDF
This slide depicts the overview of predictive analytics models, including the predictive problems they solve, such as binary results, number prediction, detecting odd behavior, and so on. The models include classification, forecasting, anomaly, cluster, and time series. The Predictive Analytics Methods Predictive Analytics Models For Predictive Problems Graphics PDF is a compilation of the most recent design trends as a series of slides. It is suitable for any subject or industry presentation, containing attractive visuals and photo spots for businesses to clearly express their messages. This template contains a variety of slides for the user to input data, such as structures to contrast two elements, bullet points, and slides for written information. Slidegeeks is prepared to create an impression.
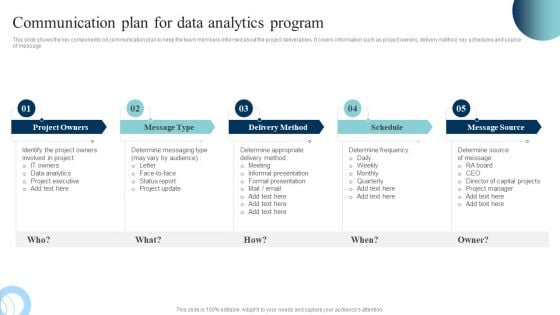
Data Evaluation And Processing Toolkit Communication Plan For Data Analytics Program Inspiration PDF
This slide elaborates the communication plan for translating the data analytics deliverables to the management. Slidegeeks is here to make your presentations a breeze with Data Evaluation And Processing Toolkit Communication Plan For Data Analytics Program Inspiration PDF With our easy-to-use and customizable templates, you can focus on delivering your ideas rather than worrying about formatting. With a variety of designs to choose from, youre sure to find one that suits your needs. And with animations and unique photos, illustrations, and fonts, you can make your presentation pop. So whether youre giving a sales pitch or presenting to the board, make sure to check out Slidegeeks first.
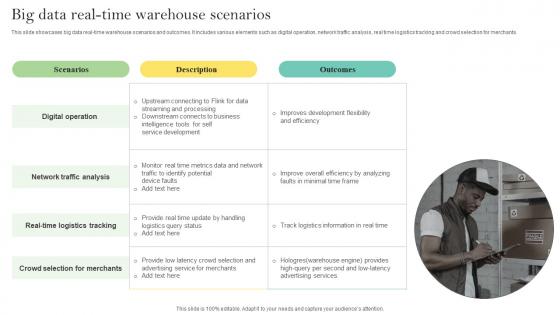
Big Data Real Time Warehouse Scenarios Ppt Slides Background Designs Pdf
This slide showcases big data real-time warehouse scenarios and outcomes. It includes various elements such as digital operation, network traffic analysis, real time logistics tracking and crowd selection for merchants. Pitch your topic with ease and precision using this Big Data Real Time Warehouse Scenarios Ppt Slides Background Designs Pdf. This layout presents information on Digital Operation, Network Traffic Analysis, Real Time Logistics. It is also available for immediate download and adjustment. So, changes can be made in the color, design, graphics or any other component to create a unique layout. This slide showcases big data real-time warehouse scenarios and outcomes. It includes various elements such as digital operation, network traffic analysis, real time logistics tracking and crowd selection for merchants.
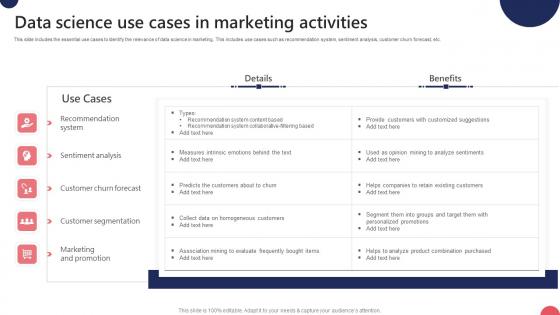
Data Science Use Cases In Marketing Activities Ppt Portfolio Graphics Tutorials Pdf
This slide includes the essential use cases to identify the relevance of data science in marketing. This includes use cases such as recommendation system, sentiment analysis, customer churn forecast, etc. Showcasing this set of slides titled Data Science Use Cases In Marketing Activities Ppt Portfolio Graphics Tutorials Pdf. The topics addressed in these templates are Recommendation System, Sentiment Analysis, Customer Churn Forecast. All the content presented in this PPT design is completely editable. Download it and make adjustments in color, background, font etc. as per your unique business setting. This slide includes the essential use cases to identify the relevance of data science in marketing. This includes use cases such as recommendation system, sentiment analysis, customer churn forecast, etc.


 Continue with Email

 Home
Home


