Snapshot
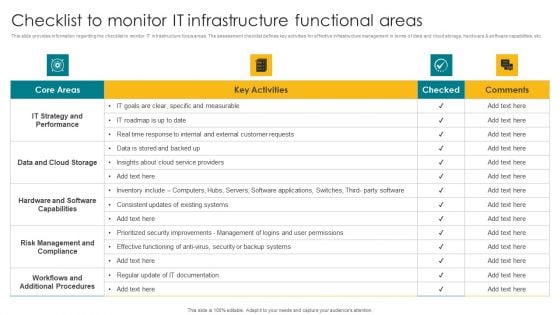
Checklist To Monitor IT Infrastructure Functional Areas Demonstration PDF
This slide provides information regarding the checklist to monitor IT infrastructure focus areas. The assessment checklist defines key activities for effective infrastructure management in terms of data and cloud storage, hardware and software capabilities, etc. This Checklist To Monitor IT Infrastructure Functional Areas Demonstration PDF from Slidegeeks makes it easy to present information on your topic with precision. It provides customization options, so you can make changes to the colors, design, graphics, or any other component to create a unique layout. It is also available for immediate download, so you can begin using it right away. Slidegeeks has done good research to ensure that you have everything you need to make your presentation stand out. Make a name out there for a brilliant performance.
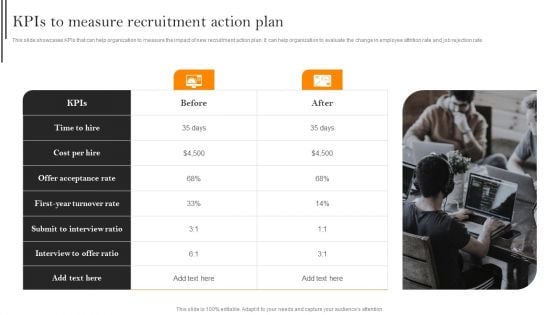
Improving Hiring Process For Workforce Retention In Organization Kpis To Measure Recruitment Action Plan Mockup PDF
This slide showcases KPIs that can help organization to measure the impact of new recruitment action plan. It can help organization to evaluate the change in employee attrition rate and job rejection rate. Slidegeeks is here to make your presentations a breeze with Improving Hiring Process For Workforce Retention In Organization Kpis To Measure Recruitment Action Plan Mockup PDF With our easy to use and customizable templates, you can focus on delivering your ideas rather than worrying about formatting. With a variety of designs to choose from, you are sure to find one that suits your needs. And with animations and unique photos, illustrations, and fonts, you can make your presentation pop. So whether you are giving a sales pitch or presenting to the board, make sure to check out Slidegeeks first.
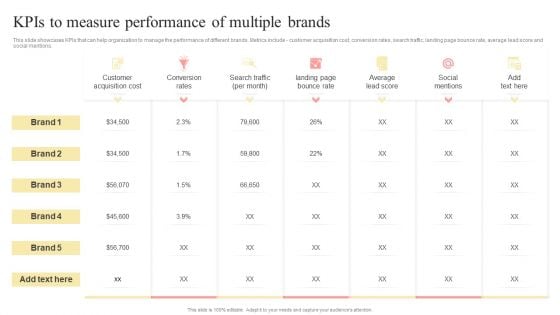
Kpis To Measure Performance Of Multiple Brands Multi Branding Approaches For Different Template PDF
This slide showcases KPIs that can help organization to manage the performance of different brands. Metrics include customer acquisition cost, conversion rates, search traffic, landing page bounce rate, average lead score and social mentions.The Kpis To Measure Performance Of Multiple Brands Multi Branding Approaches For Different Template PDF is a compilation of the most recent design trends as a series of slides. It is suitable for any subject or industry presentation, containing attractive visuals and photo spots for businesses to clearly express their messages. This template contains a variety of slides for the user to input data, such as structures to contrast two elements, bullet points, and slides for written information. Slidegeeks is prepared to create an impression.
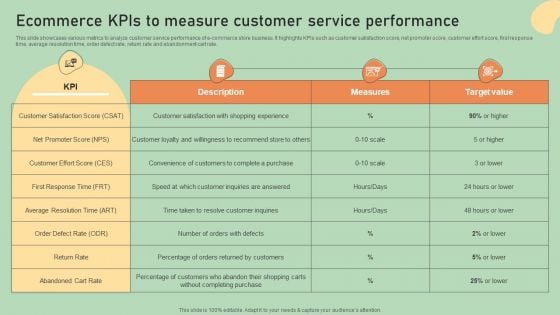
E Commerce Business Development Plan Ecommerce Kpis To Measure Customer Service Background PDF
This slide showcases various metrics to analyze customer service performance of e-commerce store business. It highlights KPIs such as customer satisfaction score, net promoter score, customer effort score, first response time, average resolution time, order defect rate, return rate and abandonment cart rate. The E Commerce Business Development Plan Ecommerce Kpis To Measure Customer Service Background PDF is a compilation of the most recent design trends as a series of slides. It is suitable for any subject or industry presentation, containing attractive visuals and photo spots for businesses to clearly express their messages. This template contains a variety of slides for the user to input data, such as structures to contrast two elements, bullet points, and slides for written information. Slidegeeks is prepared to create an impression.
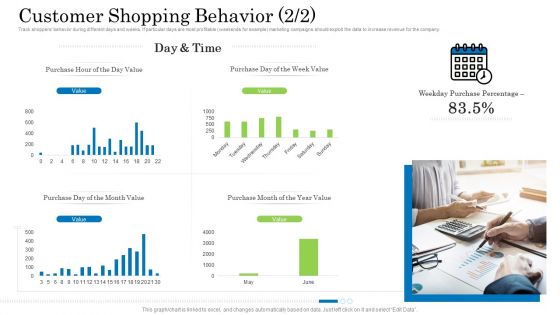
Customer Behavioral Data And Analytics Customer Shopping Behavior Week Inspiration PDF
Track shoppers behavior during different days and weeks. If particular days are most profitable weekends for example marketing campaigns should exploit the data to increase revenue for the company. Deliver and pitch your topic in the best possible manner with this customer behavioral data and analytics customer shopping behavior week inspiration pdf. Use them to share invaluable insights on purchase hour of the day value, purchase day of the week value, purchase day of the month value, purchase month of the year value and impress your audience. This template can be altered and modified as per your expectations. So, grab it now.
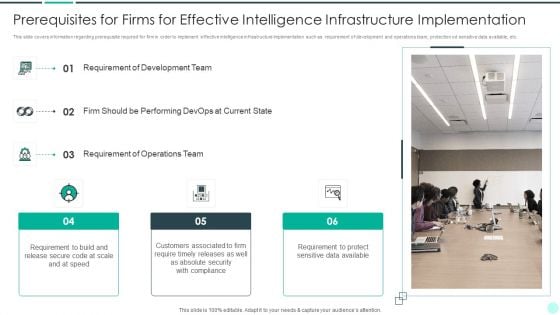
Executing Advance Data Analytics At Workspace Prerequisites For Firms Clipart PDF
This slide covers information regarding prerequisite required for firm in order to implement effective intelligence infrastructure implementation such as requirement of development and operations team, protection od sensitive data available, etc. This is a executing advance data analytics at workspace prerequisites for firms clipart pdf template with various stages. Focus and dispense information on three stages using this creative set, that comes with editable features. It contains large content boxes to add your information on topics like requirement, development, team, performing, operations. You can also showcase facts, figures, and other relevant content using this PPT layout. Grab it now.
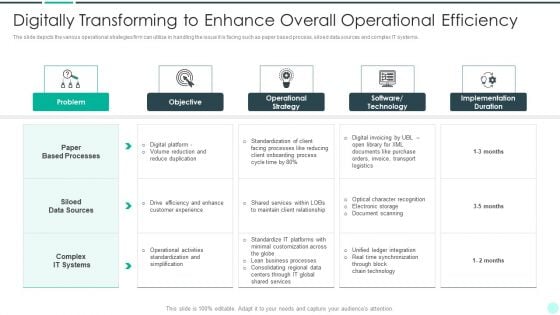
Executing Advance Data Analytics At Workspace Digitally Transforming To Enhance Demonstration PDF
The slide depicts the various operational strategies firm can utilize in handling the issue it is facing such as paper based process, siloed data sources and complex IT systems. Presenting executing advance data analytics at workspace digitally transforming to enhance demonstration pdf to provide visual cues and insights. Share and navigate important information on six stages that need your due attention. This template can be used to pitch topics like digitally transforming to enhance overall operational efficiency. In addtion, this PPT design contains high resolution images, graphics, etc, that are easily editable and available for immediate download.
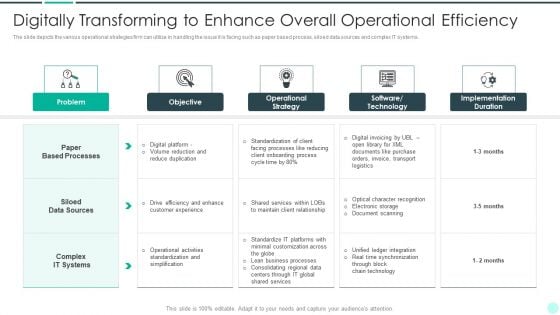
Executing Advance Data Analytics At Workspace Digitally Transforming To Enhance Portrait PDF
The slide depicts the various operational strategies firm can utilize in handling the issue it is facing such as paper based process, siloed data sources and complex IT systems. This is a executing advance data analytics at workspace digitally transforming to enhance portrait pdf template with various stages. Focus and dispense information on five stages using this creative set, that comes with editable features. It contains large content boxes to add your information on topics like objective, operational strategy, software technology. You can also showcase facts, figures, and other relevant content using this PPT layout. Grab it now.
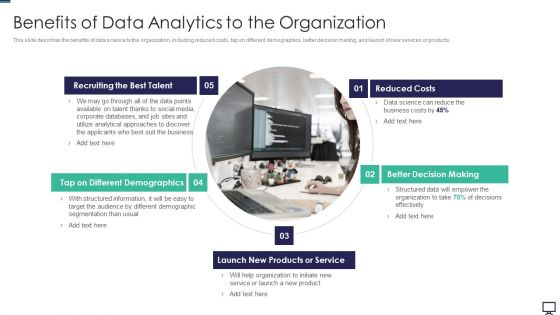
Benefits Of Data Analytics To The Organization Ppt Infographic Template Deck PDF
This slide describes the benefits of data science to the organization, including reduced costs, tap on different demographics, better decision making, and launch of new services or products. Presenting benefits of data analytics to the organization ppt infographic template deck pdf to provide visual cues and insights. Share and navigate important information on five stages that need your due attention. This template can be used to pitch topics like demographics, recruiting, products, service, reduced costs. In addtion, this PPT design contains high resolution images, graphics, etc, that are easily editable and available for immediate download.
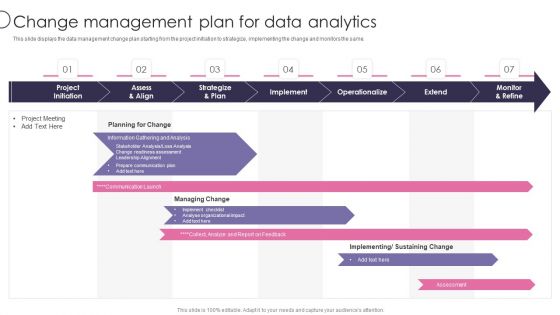
Information Transformation Process Toolkit Change Management Plan For Data Analytics Microsoft PDF
This slide displays the data management change plan starting from the project initiation to strategize, implementing the change and monitors the same. Presenting Information Transformation Process Toolkit Change Management Plan For Data Analytics Microsoft PDF to provide visual cues and insights. Share and navigate important information on seven stages that need your due attention. This template can be used to pitch topics like Project Initiation, Implement, Operationalize. In addtion, this PPT design contains high resolution images, graphics, etc, that are easily editable and available for immediate download.

Methods To Collect Customer Behavior Data Analytics Ppt Show Example Topics PDF
The following slide showcases ways to collect consumer behavior data to make more customer focused decisions in business. Key ways covered are customer feedback, community forums as focus group and customer engagement. Persuade your audience using this Methods To Collect Customer Behavior Data Analytics Ppt Show Example Topics PDF. This PPT design covers three stages, thus making it a great tool to use. It also caters to a variety of topics including Customer Feedback, Community Forums, Customer Program. Download this PPT design now to present a convincing pitch that not only emphasizes the topic but also showcases your presentation skills.
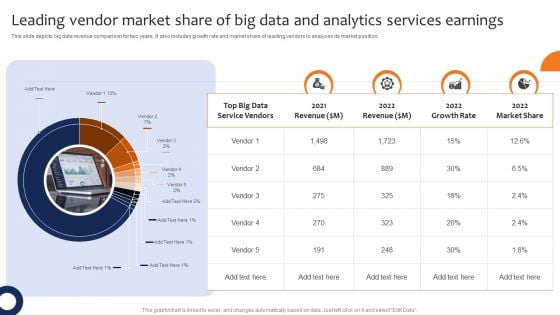
Leading Vendor Market Share Of Big Data And Analytics Services Earnings Professional PDF
This slide depicts big data revenue comparison for two years. It also includes growth rate and market share of leading vendors to analyses its market position. Pitch your topic with ease and precision using this Leading Vendor Market Share Of Big Data And Analytics Services Earnings Professional PDF. This layout presents information on Revenue, Growth Rate, Market Share. It is also available for immediate download and adjustment. So, changes can be made in the color, design, graphics or any other component to create a unique layout.
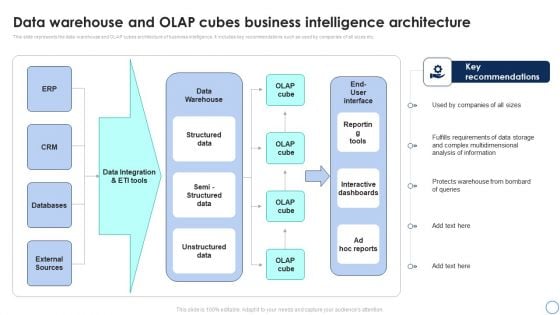
Business Analytics Application Data Warehouse And Olap Cubes Business Intelligence Introduction PDF
This slide represents the data warehouse and OLAP cubes architecture of business intelligence. It includes key recommendations such as used by companies of all sizes etc. Make sure to capture your audiences attention in your business displays with our gratis customizable Business Analytics Application Data Warehouse And Olap Cubes Business Intelligence Introduction PDF. These are great for business strategies, office conferences, capital raising or task suggestions. If you desire to acquire more customers for your tech business and ensure they stay satisfied, create your own sales presentation with these plain slides.
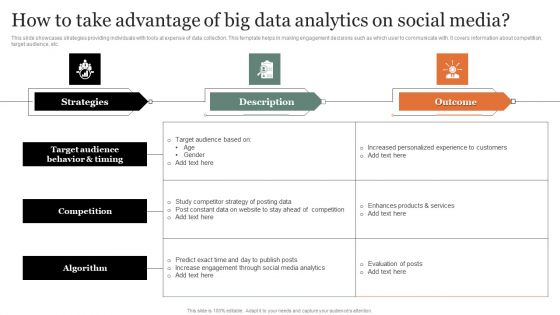
How To Take Advantage Of Big Data Analytics On Social Media Infographics PDF
This slide showcases strategies providing individuals with tools at expense of data collection. This template helps in making engagement decisions such as which user to communicate with. It covers information about competition, target audience, etc. Pitch your topic with ease and precision using this How To Take Advantage Of Big Data Analytics On Social Media Infographics PDF Graphics. This layout presents information on Target Audience Behavior, Competition, Algorithm. It is also available for immediate download and adjustment. So, changes can be made in the color, design, graphics or any other component to create a unique layout.
Presentation Of BPO Data Through Chart Ppt Pictures Design Inspiration PDF
Pitch your topic with ease and precision using this presentation of bpo data through chart ppt pictures design inspiration pdf. This layout presents information on presentation of bpo data through chart. It is also available for immediate download and adjustment. So, changes can be made in the color, design, graphics or any other component to create a unique layout.
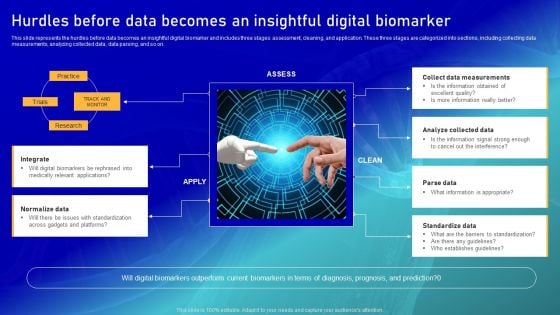
Biomarker Categorization Hurdles Before Data Becomes An Insightful Digital Biomarker Pictures PDF
This slide represents the hurdles before data becomes an insightful digital biomarker and includes three stages assessment, cleaning, and application. These three stages are categorized into sections, including collecting data measurements, analyzing collected data, data parsing, and so on. Make sure to capture your audiences attention in your business displays with our gratis customizable Biomarker Categorization Hurdles Before Data Becomes An Insightful Digital Biomarker Pictures PDF. These are great for business strategies, office conferences, capital raising or task suggestions. If you desire to acquire more customers for your tech business and ensure they stay satisfied, create your own sales presentation with these plain slides.
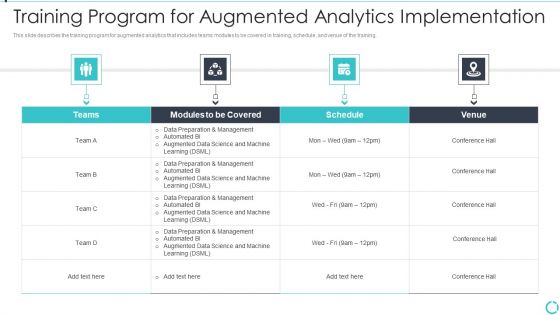
Augmented Analytics Implementation IT Training Program For Augmented Analytics Mockup PDF
This slide describes the training program for augmented analytics that includes teams modules to be covered in training, schedule, and venue of the training. Deliver and pitch your topic in the best possible manner with this Augmented Analytics Implementation IT Training Program For Augmented Analytics Mockup PDF. Use them to share invaluable insights on Modules Covered, Team, Data Preparation And Management, Augmented Data Science And Machine and impress your audience. This template can be altered and modified as per your expectations. So, grab it now.

Most Critical Vs Of Big Data Analytics Hyperautomation Software Solutions IT Guidelines PDF
This slide represents the most critical Vs of big data, such as volume, variety, velocity, veracity, value, and variability and how they work. Each of these Vs describes the feature of big data where volume represents the amount of collected information, variety tells the data type, and so on.This Most Critical Vs Of Big Data Analytics Hyperautomation Software Solutions IT Guidelines PDF from Slidegeeks makes it easy to present information on your topic with precision. It provides customization options, so you can make changes to the colors, design, graphics, or any other component to create a unique layout. It is also available for immediate download, so you can begin using it right away. Slidegeeks has done good research to ensure that you have everything you need to make your presentation stand out. Make a name out there for a brilliant performance.
Business Diagram Battery Icon With Power Icons Energy Technology PowerPoint Slide
This business diagram displays battery icon with power charging. Use this diagram, in your presentations to display energy saving, battery and technology. Create professional presentations using this diagram slide.
Business Diagram Battery With Alert Sign And Dices Power Technology PowerPoint Slide
This business diagram displays risk alert on battery icon. Use this diagram, in your presentations to display energy saving, battery and technology. Create professional presentations using this diagram slide.
Business Diagram Battery With Empty Sign For Power Generation PowerPoint Slide
This business diagram displays empty sign alert on battery icon. Use this diagram, in your presentations to display energy saving, battery and technology. Create professional presentations using this diagram slide.
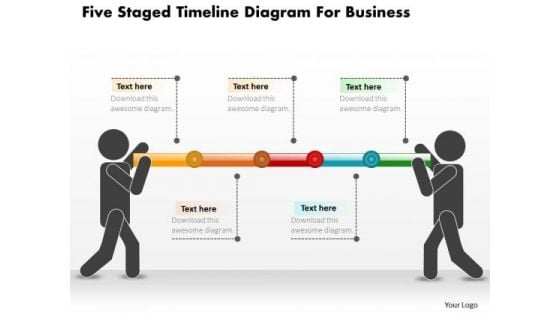
Business Diagram Five Staged Timeline Diagram For Business PowerPoint Slide
This PowerPoint template displays five points timeline diagram. This business diagram has been designed with graphic of timeline with five points, text space and start, end points. Use this diagram, in your presentations to display process steps, stages, timelines and business management. Make wonderful presentations using this business slide.
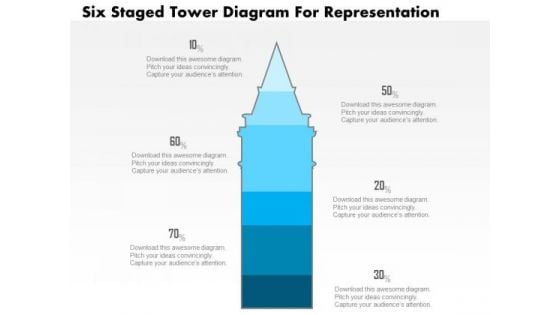
Business Diagram Five Staged Tower Diagram For Representation PowerPoint Slide
This business slide displays five staged tower diagram. It contains blue tower graphic divided into five parts. This diagram slide depicts processes, stages, steps, points, options information display. Use this diagram, in your presentations to express your views innovatively.
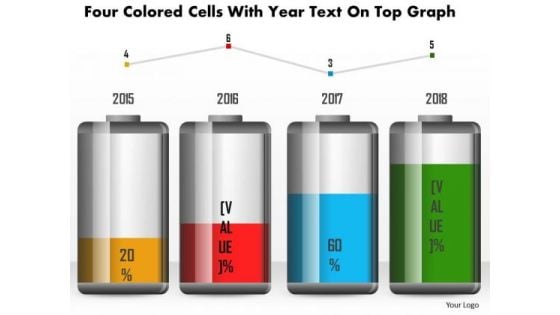
Business Diagram Four Colored Cells With Year Text On Top Graph PowerPoint Slide
This business diagram has been designed with battery cell graphic for business timeline. This slide can be used for business planning and management. Use this diagram for your business and success milestones related presentations.
Business Diagram Green Battery Cell With Full Charging Symbol PowerPoint Slide
This business diagram displays full battery charge icon. Use this diagram, in your presentations to display energy saving, battery and technology. Create professional presentations using this diagram slide.
Business Diagram Hour Glass With 3d Man And Icons PowerPoint Slide
This diagram displays 3d man with hour glass and icons. This diagram contains concept of communication and technology. Use this diagram to display business process workflows in any presentations.
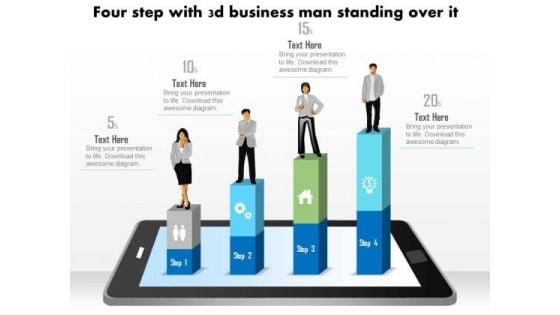
Business Diagram Four Steps With 3d Business Person Standing Over It PowerPoint Slide
This business diagram displays bar graph with business person standing on it. This Power Point template has been designed to display personal growth. You may use this diagram to impart professional appearance to your presentations.

Redis Cache Data Structure IT Checklist For Redis Cache Implementation Pictures PDF
This slide represents the checklist for Redis cache implementation, including deciding when should cache data and the best way to cache data. Deliver an awe inspiring pitch with this creative redis cache data structure it checklist for redis cache implementation pictures pdf bundle. Topics like checklist for redis cache implementation can be discussed with this completely editable template. It is available for immediate download depending on the needs and requirements of the user.
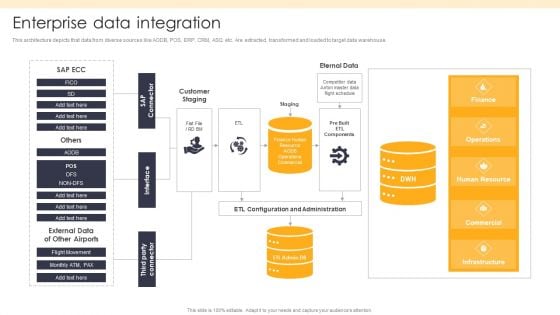
ETL Repository Enterprise Data Integration Ppt PowerPoint Presentation Show Graphics Pictures PDF
This architecture depicts that data from diverse sources like AODB, POS, ERP, CRM, ASQ etc. Are extracted, transformed and loaded to target data warehouse.Deliver and pitch your topic in the best possible manner with this ETL Repository Enterprise Data Integration Ppt PowerPoint Presentation Show Graphics Pictures PDF. Use them to share invaluable insights on Customer Staging, Configuration Administration. Operations Commercial and impress your audience. This template can be altered and modified as per your expectations. So, grab it now.
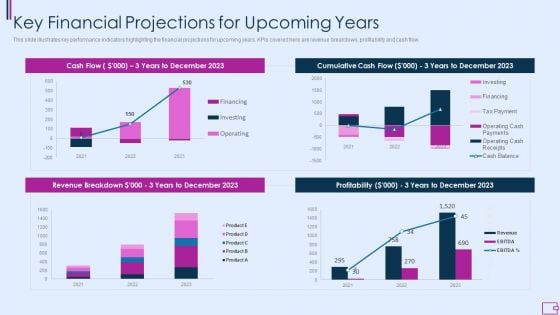
Capital Fundraising And Financial Forecast Pitch Deck Key Financial Projections For Upcoming Years Portrait PDF
This slide illustrates key performance indicators highlighting the financial projections for upcoming years. KPIs covered here are revenue breakdown, profitability and cash flow. Deliver an awe inspiring pitch with this creative capital fundraising and financial forecast pitch deck key financial projections for upcoming years portrait pdf bundle. Topics like key financial projections for upcoming years can be discussed with this completely editable template. It is available for immediate download depending on the needs and requirements of the user.
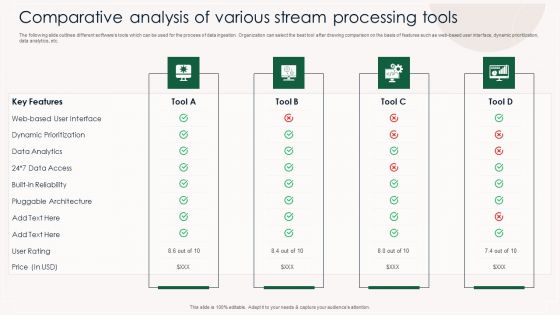
Comparative Analysis Of Various Stream Processing Tools Demonstration PDF
The following slide outlines different softwares tools which can be used for the process of data ingestion. Organization can select the best tool after drawing comparison on the basis of features such as web-based user interface, dynamic prioritization, data analytics, etc. Showcasing this set of slides titled Comparative Analysis Of Various Stream Processing Tools Demonstration PDF. The topics addressed in these templates are Data Analytics, Key Features, Dynamic Prioritization. All the content presented in this PPT design is completely editable. Download it and make adjustments in color, background, font etc. as per your unique business setting.
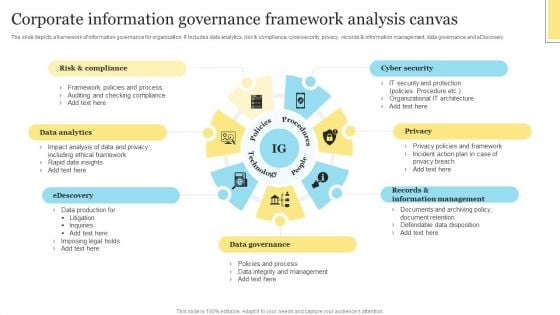
Corporate Information Governance Framework Analysis Canvas Clipart PDF
The slide depicts a framework of information governance for organization. It includes data analytics, risk and compliance, cybersecurity, privacy, records and information management, data governance and eDiscovery. Persuade your audience using this Corporate Information Governance Framework Analysis Canvas Clipart PDF. This PPT design covers four stages, thus making it a great tool to use. It also caters to a variety of topics including Risk Compliance, Data Analytics, Edescovery. Download this PPT design now to present a convincing pitch that not only emphasizes the topic but also showcases your presentation skills.
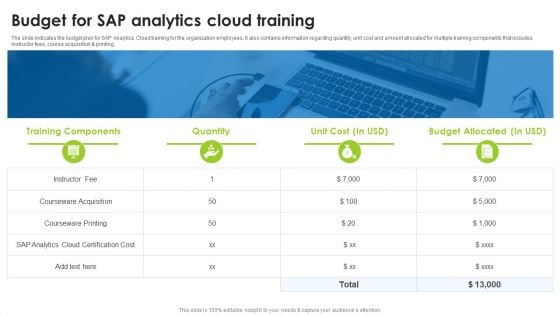
BI Technique For Data Informed Decisions Budget For Sap Analytics Cloud Training Diagrams PDF
The slide indicates the budget plan for SAP Analytics Cloud training for the organization employees. It also contains information regarding quantity, unit cost and amount allocated for multiple training components that includes instructor fees, course acquisition and printing. Boost your pitch with our creative BI Technique For Data Informed Decisions Budget For Sap Analytics Cloud Training Diagrams PDF. Deliver an awe-inspiring pitch that will mesmerize everyone. Using these presentation templates you will surely catch everyones attention. You can browse the ppts collection on our website. We have researchers who are experts at creating the right content for the templates. So you do not have to invest time in any additional work. Just grab the template now and use them.
BI Technique For Data Informed Decisions Deployment Options For Sap Analytics Cloud Icons PDF
The purpose of this slide is to provide an information regarding the deployment methods for SAP Analytics Cloud implementation in the business organization. It also contains details of each deployment options key features. Slidegeeks is one of the best resources for PowerPoint templates. You can download easily and regulate BI Technique For Data Informed Decisions Deployment Options For Sap Analytics Cloud Icons PDF for your personal presentations from our wonderful collection. A few clicks is all it takes to discover and get the most relevant and appropriate templates. Use our Templates to add a unique zing and appeal to your presentation and meetings. All the slides are easy to edit and you can use them even for advertisement purposes.
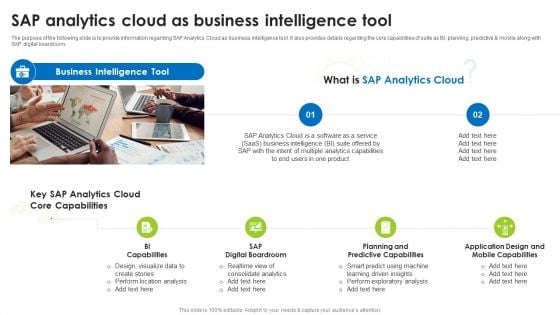
BI Technique For Data Informed Decisions Sap Analytics Cloud As Business Intelligence Tool Graphics PDF
The purpose of the following slide is to provide information regarding SAP Analytics Cloud as business intelligence tool. It also provides details regarding the core capabilities of suite as BI, planning, predictive and mobile along with SAP digital boardroom. Present like a pro with BI Technique For Data Informed Decisions Sap Analytics Cloud As Business Intelligence Tool Graphics PDF Create beautiful presentations together with your team, using our easy to use presentation slides. Share your ideas in real time and make changes on the fly by downloading our templates. So whether you are in the office, on the go, or in a remote location, you can stay in sync with your team and present your ideas with confidence. With Slidegeeks presentation got a whole lot easier. Grab these presentations today.
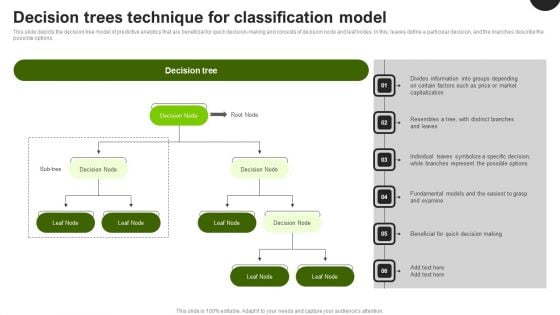
Predictive Analytics In The Age Of Big Data Decision Trees Technique For Classification Model Brochure PDF
This slide depicts the decision tree model of predictive analytics that are beneficial for quick decision-making and consists of decision node and leaf nodes. In this, leaves define a particular decision, and the branches describe the possible options. Want to ace your presentation in front of a live audience Our Predictive Analytics In The Age Of Big Data Decision Trees Technique For Classification Model Brochure PDF can help you do that by engaging all the users towards you. Slidegeeks experts have put their efforts and expertise into creating these impeccable powerpoint presentations so that you can communicate your ideas clearly. Moreover, all the templates are customizable, and easy to edit and downloadable. Use these for both personal and commercial use.
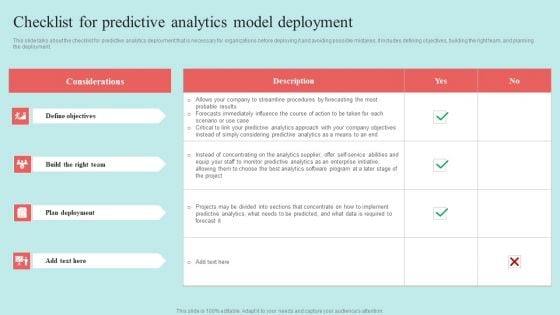
Predictive Data Model Checklist For Predictive Analytics Model Deployment Sample PDF
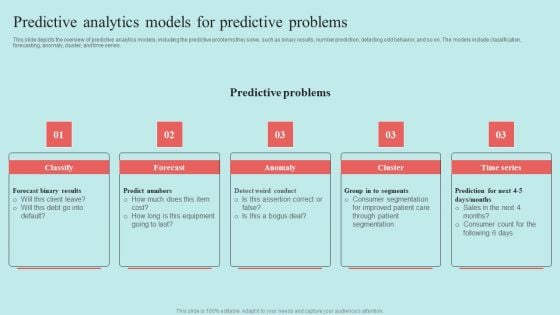
Predictive Data Model Predictive Analytics Models For Predictive Problems Structure PDF
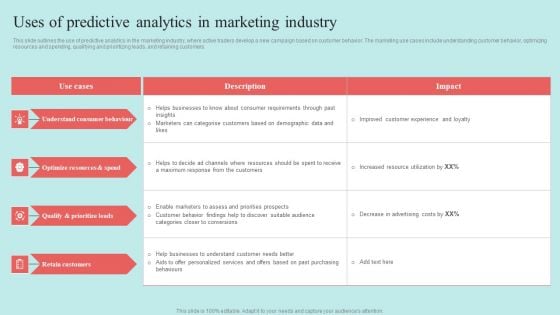
Predictive Data Model Uses Of Predictive Analytics In Marketing Industry Themes PDF
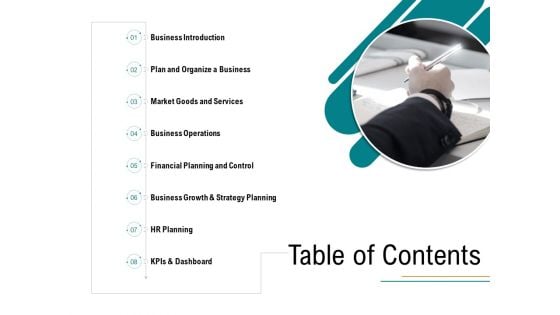
Business Operations Assessment Table Of Contents Ppt PowerPoint Presentation Infographic Template Guidelines PDF
Presenting business operations assessment table of contents ppt powerpoint presentation infographic template guidelines pdf to provide visual cues and insights. Share and navigate important information on eight stages that need your due attention. This template can be used to pitch topics like business introduction, plan and organize a business, market goods and services, business operations, financial planning and control, business growth and strategy planning , hr planning, kpis and dashboard. In addition, this PPT design contains high-resolution images, graphics, etc, that are easily editable and available for immediate download.
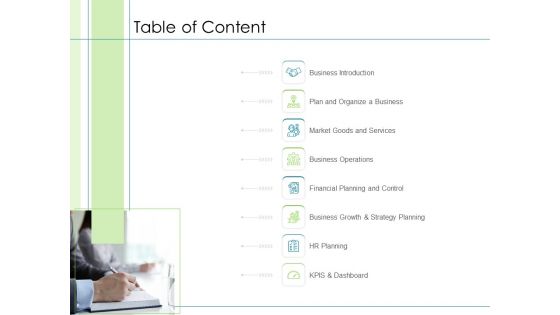
In Depth Business Assessment Table Of Content Ppt PowerPoint Presentation Inspiration Influencers PDF
Presenting in depth business assessment table of content ppt powerpoint presentation inspiration influencers pdf to provide visual cues and insights. Share and navigate important information on eight stages that need your due attention. This template can be used to pitch topics like business introduction, plan and organize business, market goods and services, business operations, financial planning and control, business growth and strategy planning, hr planning, kpis and dashboard. In addition, this PPT design contains high-resolution images, graphics, etc, that are easily editable and available for immediate download.
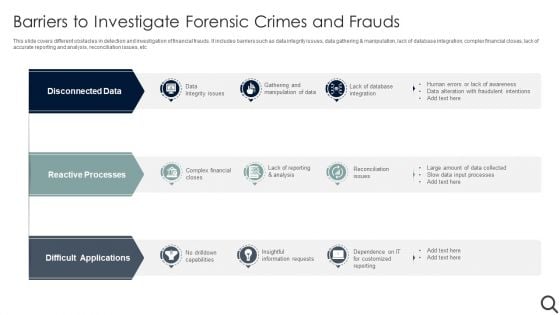
Barriers To Investigate Forensic Crimes And Frauds Graphics PDF
This slide covers different obstacles in detection and investigation of financial frauds. It includes barriers such as data integrity issues, data gathering and manipulation, lack of database integration, complex financial closes, lack of accurate reporting and analysis, reconciliation issues, etc. Presenting Barriers To Investigate Forensic Crimes And Frauds Graphics PDF to dispense important information. This template comprises three stages. It also presents valuable insights into the topics including Disconnected Data, Reactive Processes, Difficult Applications. This is a completely customizable PowerPoint theme that can be put to use immediately. So, download it and address the topic impactfully.
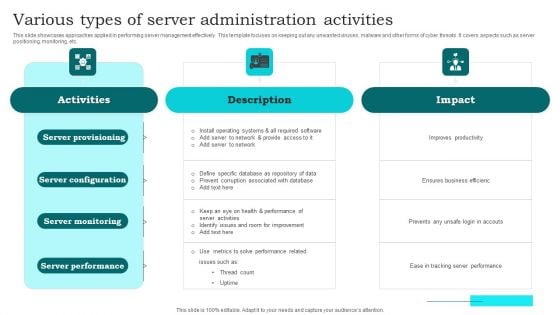
Various Types Of Server Administration Activities Clipart PDF
This slide showcases approaches applied in performing server management effectively. This template focuses on keeping out any unwanted viruses, malware and other forms of cyber threats. It covers aspects such as server positioning, monitoring, etc. Presenting Various Types Of Server Administration Activities Clipart PDF to dispense important information. This template comprises four stages. It also presents valuable insights into the topics including Server Provisioning, Server Configuration, Server Monitoring. This is a completely customizable PowerPoint theme that can be put to use immediately. So, download it and address the topic impactfully.
Developing Appealing Persona Social Media Marketing Performance Tracking Guidelines PDF
Following slide displays KPI dashboard that can be used to monitor the performance of social media marketing campaign. Metrics covered are related to fans number, engagement rate and page impressions. Create an editable Developing Appealing Persona Social Media Marketing Performance Tracking Guidelines PDF that communicates your idea and engages your audience. Whether youre presenting a business or an educational presentation, pre-designed presentation templates help save time. Developing Appealing Persona Social Media Marketing Performance Tracking Guidelines PDF is highly customizable and very easy to edit, covering many different styles from creative to business presentations. Slidegeeks has creative team members who have crafted amazing templates. So, go and get them without any delay.
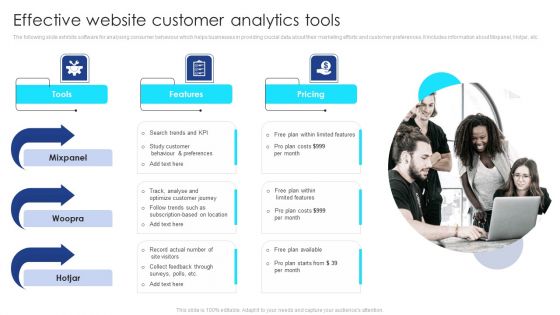
Effective Website Customer Analytics Tools Microsoft PDF
The following slide exhibits software for analysing consumer behaviour which helps businesses in providing crucial data about their marketing efforts and customer preferences. It includes information about Mixpanel, Hotjar, etc. Persuade your audience using this Effective Website Customer Analytics Tools Microsoft PDF. This PPT design covers three stages, thus making it a great tool to use. It also caters to a variety of topics including Tools, Features, Pricing. Download this PPT design now to present a convincing pitch that not only emphasizes the topic but also showcases your presentation skills.
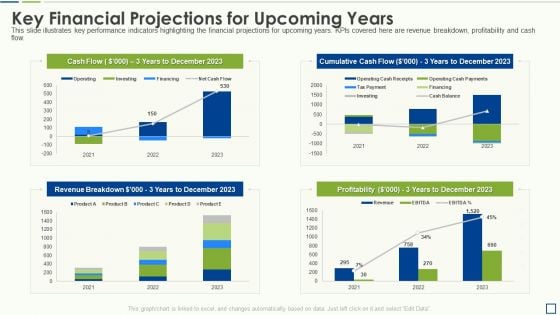
Accounting Pitch Deck Key Financial Projections For Upcoming Years Designs PDF
This slide illustrates key performance indicators highlighting the financial projections for upcoming years. KPIs covered here are revenue breakdown, profitability and cash flow.Deliver an awe inspiring pitch with this creative accounting pitch deck key financial projections for upcoming years designs pdf bundle. Topics like revenue breakdown, profitability, cumulative cash flow can be discussed with this completely editable template. It is available for immediate download depending on the needs and requirements of the user.
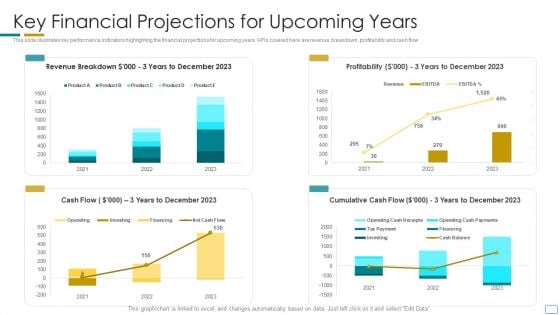
Fundraising Pitch Deck For Startup Company Key Financial Projections For Upcoming Years Brochure PDF
This slide illustrates key performance indicators highlighting the financial projections for upcoming years. KPIs covered here are revenue breakdown, profitability and cash flow Deliver an awe inspiring pitch with this creative fundraising pitch deck for startup company key financial projections for upcoming years brochure pdf bundle. Topics like profitability, revenue can be discussed with this completely editable template. It is available for immediate download depending on the needs and requirements of the user.
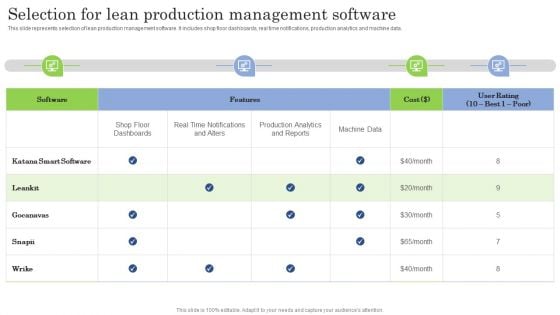
Selection For Lean Production Management Software Ppt PowerPoint Presentation Diagram PDF
This slide represents selection of lean production management software. It includes shop floor dashboards, real time notifications, production analytics and machine data. Are you searching for a Selection For Lean Production Management Software Ppt PowerPoint Presentation Diagram PDF that is uncluttered, straightforward, and original Its easy to edit, and you can change the colors to suit your personal or business branding. For a presentation that expresses how much effort you have put in, this template is ideal. With all of its features, including tables, diagrams, statistics, and lists, its perfect for a business plan presentation. Make your ideas more appealing with these professional slides. Download Selection For Lean Production Management Software Ppt PowerPoint Presentation Diagram PDF from Slidegeeks today.
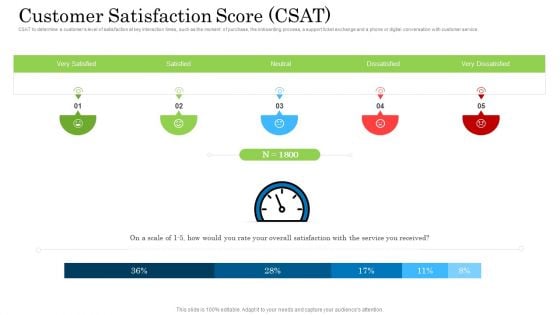
Customer Behavioral Data And Analytics Customer Satisfaction Score Csat Clipart PDF
CSAT to determine a customers level of satisfaction at key interaction times, such as the moment of purchase, the onboarding process, a support ticket exchange and a phone or digital conversation with customer service. Presenting customer behavioral data and analytics customer satisfaction score csat clipart pdf to provide visual cues and insights. Share and navigate important information on five stages that need your due attention. This template can be used to pitch topics like very satisfied, satisfied, neutral, dissatisfied, very dissatisfied. In addtion, this PPT design contains high resolution images, graphics, etc, that are easily editable and available for immediate download.
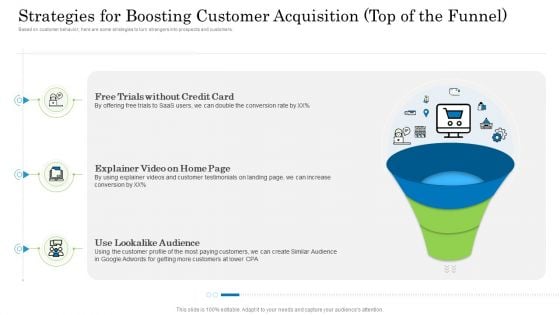
Customer Behavioral Data And Analytics Strategies For Boosting Customer Acquisition Top Of The Funnel Infographics PDF
Based on customer behavior, here are some strategies to turn strangers into prospects and customers. This is a customer behavioral data and analytics strategies for boosting customer acquisition top of the funnel infographics pdf template with various stages. Focus and dispense information on three stages using this creative set, that comes with editable features. It contains large content boxes to add your information on topics like free trials without credit card, explainer video on home page, use lookalike audience. You can also showcase facts, figures, and other relevant content using this PPT layout. Grab it now.
Customer Behavioral Data And Analytics Strategies For Higher Conversions Lower Funnel Icons PDF
Based on customer behavior, here are some strategies to ensure purchase from people already interested in buying your products. Presenting customer behavioral data and analytics strategies for higher conversions lower funnel icons pdf to provide visual cues and insights. Share and navigate important information on three stages that need your due attention. This template can be used to pitch topics like single page checkout, item in stock, prominent cta button. In addtion, this PPT design contains high resolution images, graphics, etc, that are easily editable and available for immediate download.
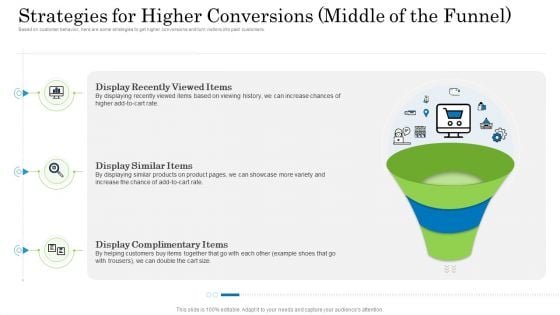
Customer Behavioral Data And Analytics Strategies For Higher Conversions Middle Of The Funnel Inspiration PDF
Based on customer behavior, here are some strategies to get higher conversions and turn visitors into paid customers. This is a customer behavioral data and analytics strategies for higher conversions middle of the funnel inspiration pdf template with various stages. Focus and dispense information on three stages using this creative set, that comes with editable features. It contains large content boxes to add your information on topics like display recently viewed items, display similar items, display complimentary items. You can also showcase facts, figures, and other relevant content using this PPT layout. Grab it now.
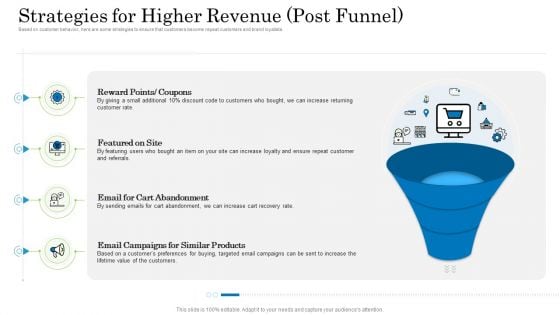
Customer Behavioral Data And Analytics Strategies For Higher Revenue Post Funnel Template PDF
Based on customer behavior, here are some strategies to ensure that customers become repeat customers and brand loyalists. Presenting customer behavioral data and analytics strategies for higher revenue post funnel template pdf to provide visual cues and insights. Share and navigate important information on three stages that need your due attention. This template can be used to pitch topics like reward points coupons, featured on site, email for cart abandonment, email campaigns for similar products. In addtion, this PPT design contains high resolution images, graphics, etc, that are easily editable and available for immediate download.
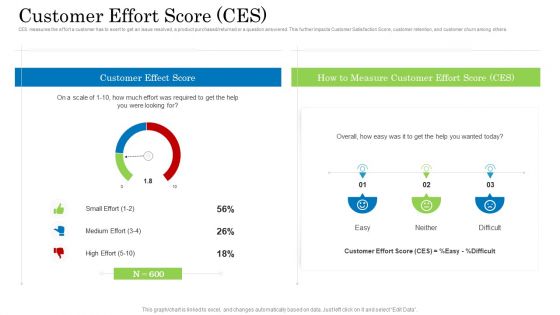
Customer Behavioral Data And Analytics Customer Effort Score Ces Professional PDF
CES measures the effort a customer has to exert to get an issue resolved, a product purchased returned or a question answered. This further impacts Customer Satisfaction Score, customer retention, and customer churn among others. Deliver an awe inspiring pitch with this creative customer behavioral data and analytics customer effort score ces professional pdf bundle. Topics like customer effect score, small effort, medium effort, high effort can be discussed with this completely editable template. It is available for immediate download depending on the needs and requirements of the user.
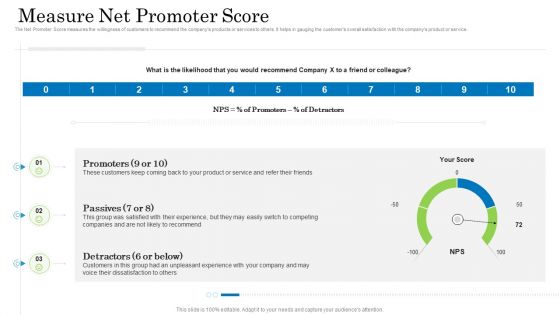
Customer Behavioral Data And Analytics Measure Net Promoter Score Mockup PDF
The Net Promoter Score measures the willingness of customers to recommend the companys products or services to others. It helps in gauging the customers overall satisfaction with the companys product or service. Deliver and pitch your topic in the best possible manner with this customer behavioral data and analytics measure net promoter score mockup pdf. Use them to share invaluable insights on promoters, passives, detractors and impress your audience. This template can be altered and modified as per your expectations. So, grab it now.
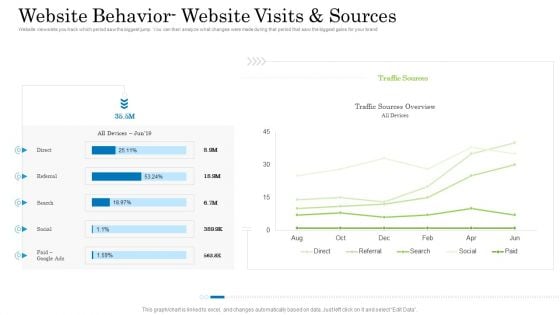
Customer Behavioral Data And Analytics Website Behavior Website Visits And Sources Structure PDF
Website views lets you track which period saw the biggest jump. You can then analyze what changes were made during that period that saw the biggest gains for your brand. Deliver and pitch your topic in the best possible manner with this customer behavioral data and analytics website behavior website visits and sources structure pdf. Use them to share invaluable insights on direct, referral, search, social and impress your audience. This template can be altered and modified as per your expectations. So, grab it now.
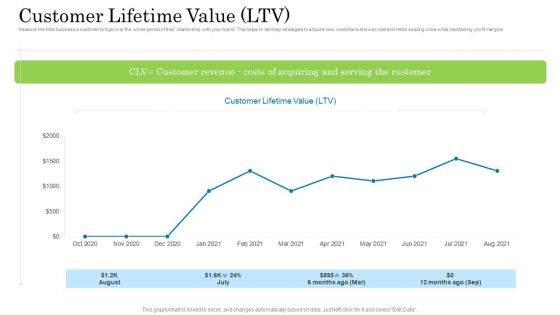
Customer Behavioral Data And Analytics Customer Lifetime Value Ltv Graphics PDF
Measure the total business a customer brings over the whole period of their relationship with your brand. This helps to develop strategies to acquire new customers at lower cost and retain existing ones while maintaining profit margins. Deliver and pitch your topic in the best possible manner with this customer behavioral data and analytics customer lifetime value ltv graphics pdf. Use them to share invaluable insights on customer lifetime value and impress your audience. This template can be altered and modified as per your expectations. So, grab it now.
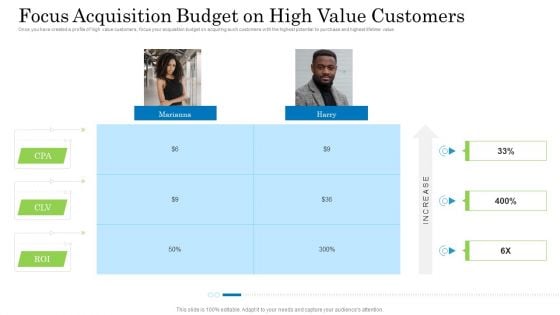
Customer Behavioral Data And Analytics Focus Acquisition Budget On High Value Customers Infographics PDF
Once you have created a profile of high value customers, focus your acquisition budget on acquiring such customers with the highest potential to purchase and highest lifetime value. Presenting customer behavioral data and analytics focus acquisition budget on high value customers infographics pdf to provide visual cues and insights. Share and navigate important information on two stages that need your due attention. This template can be used to pitch topics like focus acquisition budget on high value customers. In addtion, this PPT design contains high resolution images, graphics, etc, that are easily editable and available for immediate download.

Data Analytics IT Tasks And Skills Of Machine Learning Engineer Ppt Gallery Visual Aids PDF
This slide represents the machine learning engineers tasks and skills, including a deep knowledge of machine learning, ML algorithms, and Python and C. This is a data analytics it tasks and skills of machine learning engineer ppt gallery visual aids pdf template with various stages. Focus and dispense information on six stages using this creative set, that comes with editable features. It contains large content boxes to add your information on topics like knowledge of machine learning, python, c plus, ml algorithms. You can also showcase facts, figures, and other relevant content using this PPT layout. Grab it now.
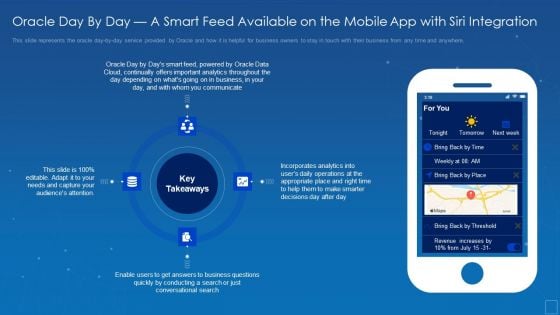
Oracle Cloud Data Analytics Administration IT Oracle Day By Day A Smart Feed Available Microsoft PDF
This slide represents the oracle day by day service provided by Oracle and how it is helpful for business owners to stay in touch with their business from any time and anywhere. This is a oracle cloud data analytics administration it oracle day by day a smart feed available microsoft pdf template with various stages. Focus and dispense information on four stages using this creative set, that comes with editable features. It contains large content boxes to add your information on topics like incorporates, decisions, appropriate, important, communicate. You can also showcase facts, figures, and other relevant content using this PPT layout. Grab it now.


 Continue with Email

 Home
Home


