Snapshot

Gathering Customer Kpis To Track Personalized Email Marketing Campaign Results Template PDF
This slide showcases KPIs that can help organization to measure the results of personalized email marketing campaigns. KPIs include - conversion rate, click through rate, click to open rate, revenue per subscriber and revenue per email. There are so many reasons you need a Gathering Customer Kpis To Track Personalized Email Marketing Campaign Results Template PDF. The first reason is you cant spend time making everything from scratch, Thus, Slidegeeks has made presentation templates for you too. You can easily download these templates from our website easily.
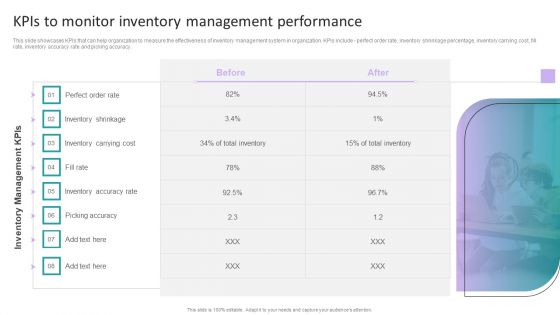
Stock Inventory Acquisition Kpis To Monitor Inventory Management Performance Template PDF
This slide showcases KPIs that can help organization to measure the effectiveness of inventory management system in organization. KPIs include - perfect order rate, inventory shrinkage percentage, inventory carrying cost, fill rate, inventory accuracy rate and picking accuracy. Want to ace your presentation in front of a live audience Our Stock Inventory Acquisition Kpis To Monitor Inventory Management Performance Template PDF can help you do that by engaging all the users towards you. Slidegeeks experts have put their efforts and expertise into creating these impeccable powerpoint presentations so that you can communicate your ideas clearly. Moreover, all the templates are customizable, and easy-to-edit and downloadable. Use these for both personal and commercial use.
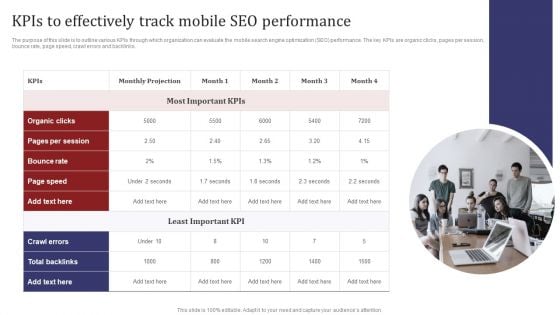
Mobile Search Engine Optimization Plan Kpis To Effectively Track Mobile SEO Performance Diagrams PDF
The purpose of this slide is to outline various KPIs through which organization can evaluate the mobile search engine optimization SEO performance. The key KPIs are organic clicks, pages per session, bounce rate, page speed, crawl errors and backlinks. There are so many reasons you need a Mobile Search Engine Optimization Plan Kpis To Effectively Track Mobile SEO Performance Diagrams PDF. The first reason is you can not spend time making everything from scratch, Thus, Slidegeeks has made presentation templates for you too. You can easily download these templates from our website easily.
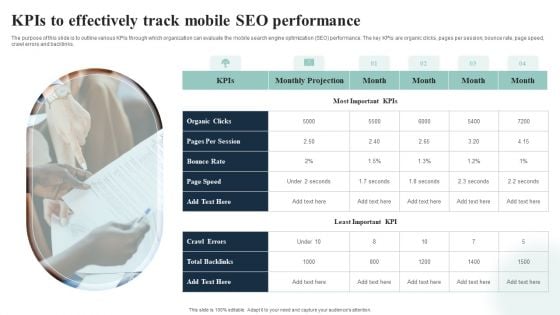
Introduction To Mobile SEM Kpis To Effectively Track Mobile SEO Performance Information PDF
The purpose of this slide is to outline various KPIs through which organization can evaluate the mobile search engine optimization SEO performance. The key KPIs are organic clicks, pages per session, bounce rate, page speed, crawl errors and backlinks. From laying roadmaps to briefing everything in detail, our templates are perfect for you. You can set the stage with your presentation slides. All you have to do is download these easy to edit and customizable templates. Introduction To Mobile SEM Kpis To Effectively Track Mobile SEO Performance Information PDF will help you deliver an outstanding performance that everyone would remember and praise you for. Do download this presentation today.
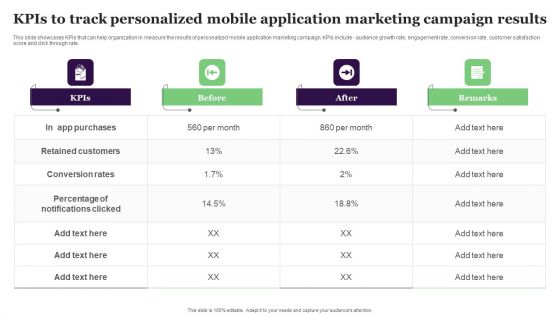
Kpis To Track Personalized Mobile Application Marketing Campaign Results Guidelines PDF
This slide showcases KPIs that can help organization in measure the results of personalized mobile application marketing campaign. KPIs include - audience growth rate, engagement rate, conversion rate, customer satisfaction score and click through rate. From laying roadmaps to briefing everything in detail, our templates are perfect for you. You can set the stage with your presentation slides. All you have to do is download these easy-to-edit and customizable templates. Kpis To Track Personalized Mobile Application Marketing Campaign Results Guidelines PDF will help you deliver an outstanding performance that everyone would remember and praise you for. Do download this presentation today.
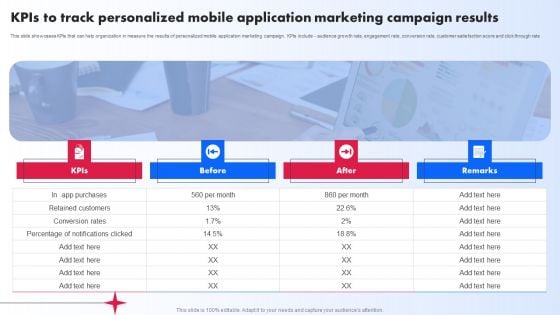
Kpis To Track Personalized Mobile Application Marketing Campaign Results Ppt PowerPoint Presentation File Ideas PDF
This slide showcases KPIs that can help organization in measure the results of personalized mobile application marketing campaign. KPIs include audience growth rate, engagement rate, conversion rate, customer satisfaction score and click through rate. The best PPT templates are a great way to save time, energy, and resources. Slidegeeks have 100 percent editable powerpoint slides making them incredibly versatile. With these quality presentation templates, you can create a captivating and memorable presentation by combining visually appealing slides and effectively communicating your message. Download Kpis To Track Personalized Mobile Application Marketing Campaign Results Ppt PowerPoint Presentation File Ideas PDF from Slidegeeks and deliver a wonderful presentation.
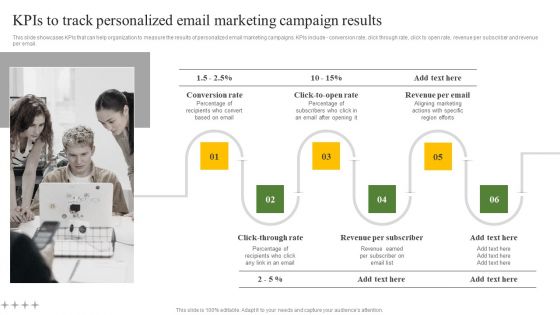
Kpis To Track Personalized Email Marketing Campaign Results Ppt Outline Influencers PDF
This slide showcases KPIs that can help organization to measure the results of personalized email marketing campaigns. KPIs include conversion rate, click through rate, click to open rate, revenue per subscriber and revenue per email. From laying roadmaps to briefing everything in detail, our templates are perfect for you. You can set the stage with your presentation slides. All you have to do is download these easy to edit and customizable templates. Kpis To Track Personalized Email Marketing Campaign Results Ppt Outline Influencers PDF will help you deliver an outstanding performance that everyone would remember and praise you for. Do download this presentation today.
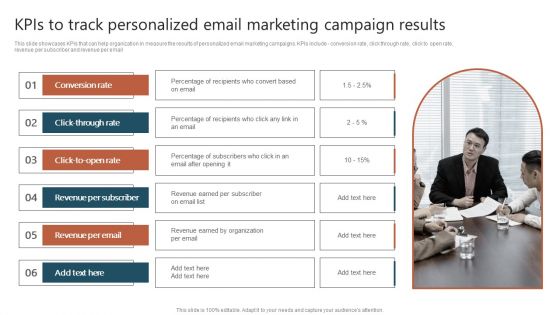
Kpis To Track Personalized Email Marketing Campaign Results Ppt Outline Backgrounds PDF
This slide showcases KPIs that can help organization to measure the results of personalized email marketing campaigns. KPIs include conversion rate, click through rate, click to open rate, revenue per subscriber and revenue per email. From laying roadmaps to briefing everything in detail, our templates are perfect for you. You can set the stage with your presentation slides. All you have to do is download these easy to edit and customizable templates. Kpis To Track Personalized Email Marketing Campaign Results Ppt Outline Backgrounds PDF will help you deliver an outstanding performance that everyone would remember and praise you for. Do download this presentation today.
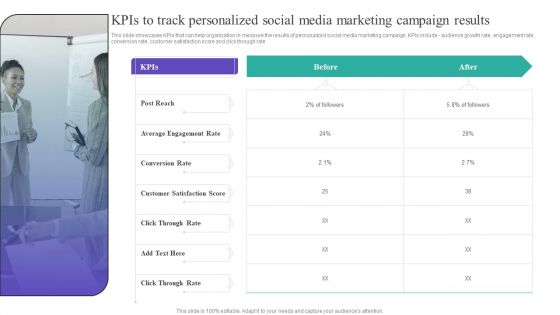
Kpis To Track Personalized Social Media Marketing Campaign Results Clipart PDF
This slide showcases KPIs that can help organization in measure the results of personalized social media marketing campaign. KPIs include - audience growth rate, engagement rate, conversion rate, customer satisfaction score and click through rate From laying roadmaps to briefing everything in detail, our templates are perfect for you. You can set the stage with your presentation slides. All you have to do is download these easy-to-edit and customizable templates. Kpis To Track Personalized Social Media Marketing Campaign Results Clipart PDF will help you deliver an outstanding performance that everyone would remember and praise you for. Do download this presentation today.
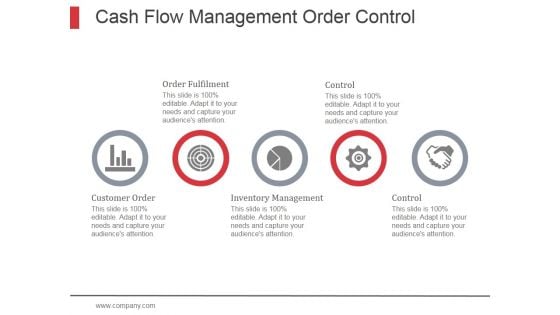
Cash Flow Management Order Control Ppt PowerPoint Presentation Design Ideas
This is a cash flow management order control ppt powerpoint presentation design ideas. This is a five stage process. The stages in this process are management, cash flow management, budget, financial analysis.

Donut Pie Chart Ppt PowerPoint Presentation File Slideshow
This is a donut pie chart ppt powerpoint presentation file slideshow. This is a four stage process. The stages in this process are business, strategy, analysis, planning, donut pie chart.

Data Interpretation Implementation Review And Evaluation Ppt PowerPoint Presentation Pictures Vector
Presenting this set of slides with name data interpretation implementation review and evaluation ppt powerpoint presentation pictures vector. This is a four stage process. The stages in this process are Data analysis, Data Review, Data Evaluation. This is a completely editable PowerPoint presentation and is available for immediate download. Download now and impress your audience.
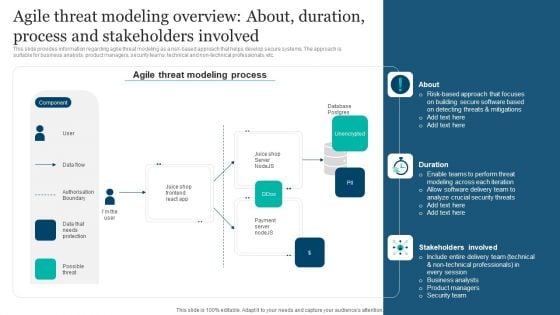
Responsible Technology Playbook Agile Threat Modeling Overview About Duration Process Elements PDF
This slide provides information regarding agile threat modeling as a risk-based approach that helps develop secure systems. The approach is suitable for business analysts, product managers, security teams, technical and non-technical professionals, etc. This modern and well-arranged Responsible Technology Playbook Agile Threat Modeling Overview About Duration Process Elements PDF provides lots of creative possibilities. It is very simple to customize and edit with the Powerpoint Software. Just drag and drop your pictures into the shapes. All facets of this template can be edited with Powerpoint, no extra software is necessary. Add your own material, put your images in the places assigned for them, adjust the colors, and then you can show your slides to the world, with an animated slide included.
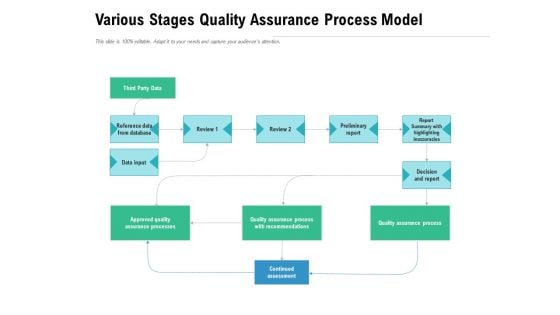
Various Stages Quality Assurance Process Model Ppt PowerPoint Presentation Outline Ideas PDF
Presenting this set of slides with name various stages quality assurance process model ppt powerpoint presentation outline ideas pdf. This is a one stage process. The stages in this process are third party data, reference data from database, review, data input, decision and report, report summary with highlighting inaccuracies, preliminary report, approved quality assurance processes, quality assurance process with recommendations, quality assurance process, continued assessment. This is a completely editable PowerPoint presentation and is available for immediate download. Download now and impress your audience.
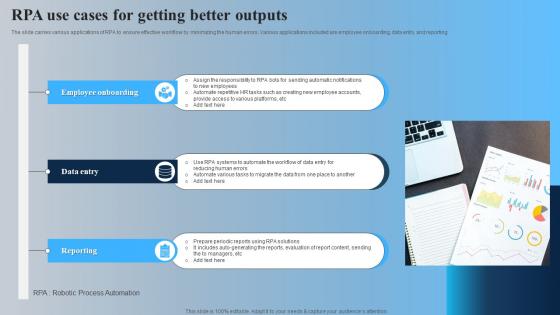
RPA Use Cases For Getting Better Outputs Rules Pdf
The slide carries various applications of RPA to ensure effective workflow by minimizing the human errors. Various applications included are employee onboarding, data entry and reporting Pitch your topic with ease and precision using this RPA Use Cases For Getting Better Outputs Rules Pdf This layout presents information on Employee Onboarding, Data Entry, Reporting It is also available for immediate download and adjustment. So, changes can be made in the color, design, graphics or any other component to create a unique layout. The slide carries various applications of RPA to ensure effective workflow by minimizing the human errors. Various applications included are employee onboarding, data entry and reporting
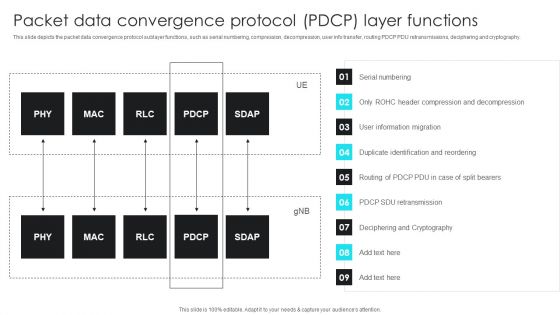
5G Network Operations Packet Data Convergence Protocol PDCP Layer Functions Themes PDF
This slide depicts the packet data convergence protocol sublayer functions, such as serial numbering, compression, decompression, user info transfer, routing PDCP PDU retransmissions, deciphering and cryptography. The 5G Network Operations Packet Data Convergence Protocol PDCP Layer Functions Themes PDF is a compilation of the most recent design trends as a series of slides. It is suitable for any subject or industry presentation, containing attractive visuals and photo spots for businesses to clearly express their messages. This template contains a variety of slides for the user to input data, such as structures to contrast two elements, bullet points, and slides for written information. Slidegeeks is prepared to create an impression.
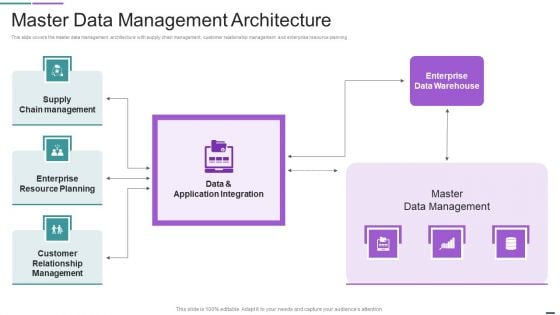
Master Data Management Architecture Mockup PDF
Deliver and pitch your topic in the best possible manner with this Master Data Management Architecture Mockup PDF. Use them to share invaluable insights on Supply Chain Management, Enterprise Resource Planning, Customer Relationship Management and impress your audience. This template can be altered and modified as per your expectations. So, grab it now.
Data Processing Cloud Services Icon Infographics PDF
Pitch your topic with ease and precision using this Data Processing Cloud Services Icon Infographics PDF. This layout presents information on Security Compliance, Monitor Visibility, Authentication. It is also available for immediate download and adjustment. So, changes can be made in the color, design, graphics or any other component to create a unique layout.
Icons Slide For Data Structure Mockup PDF
Introducing our well designed Icons Slide For Data Structure Mockup PDF set of slides. The slide displays editable icons to enhance your visual presentation. The icons can be edited easily. So customize according to your business to achieve a creative edge. Download and share it with your audience.
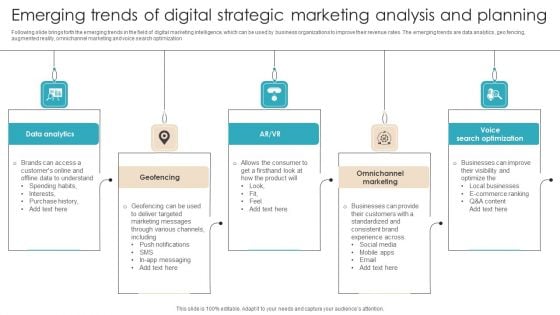
Emerging Trends Of Digital Strategic Marketing Analysis And Planning Guidelines PDF
Following slide brings forth the emerging trends in the field of digital marketing intelligence, which can be used by business organizations to improve their revenue rates. The emerging trends are data analytics, geo fencing, augmented reality, omnichannel marketing and voice search optimization. Presenting Emerging Trends Of Digital Strategic Marketing Analysis And Planning Guidelines PDF to dispense important information. This template comprises five stages. It also presents valuable insights into the topics including Data Analytics, Geofencing, Omnichannel Marketing. This is a completely customizable PowerPoint theme that can be put to use immediately. So, download it and address the topic impactfully.
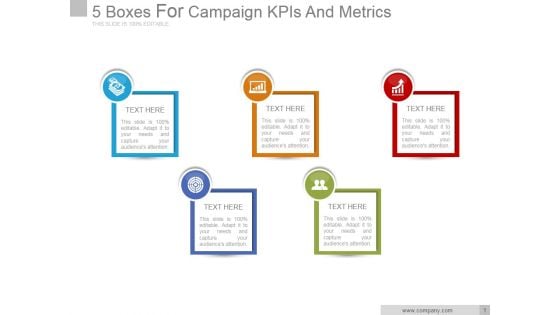
5 Boxes For Campaign Kpis And Metrics Good Ppt PowerPoint Presentation Designs
This is a 5 boxes for campaign kpis and metrics good ppt powerpoint presentation designs. This is a five stage process. The stages in this process are business, marketing, icons, metrics, strategy.
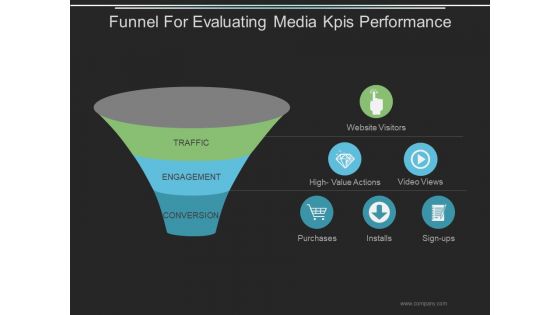
Funnel For Evaluating Media Kpis Performance Ppt PowerPoint Presentation Design Templates
This is a funnel for evaluating media kpis performance ppt powerpoint presentation design templates. This is a three stage process. The stages in this process are business, marketing, funnel, purchase, management.
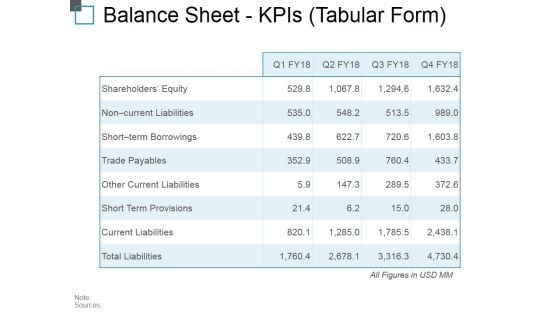
Balance Sheet Kpis Tabular Form Ppt PowerPoint Presentation Outline Background Image
This is a balance sheet kpis tabular form ppt powerpoint presentation outline background image. This is a four stage process. The stages in this process are current assets, current liabilities, total assets, total liabilities.
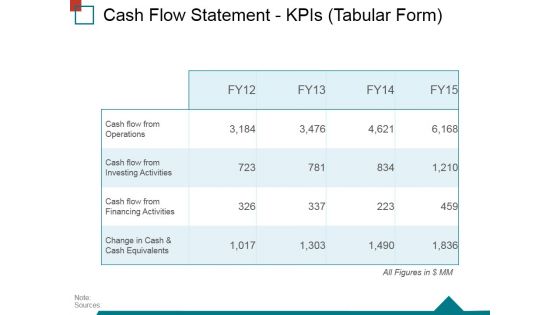
Cash Flow Statement Kpis Tabular Form Ppt PowerPoint Presentation Gallery Good
This is a cash flow statement kpis tabular form ppt powerpoint presentation gallery good. This is a four stage process. The stages in this process are operations, financing activities, investing activities, net increase in cash.

Balance Sheet Kpis Template 1 Ppt PowerPoint Presentation Ideas Master Slide
This is a balance sheet kpis template 1 ppt powerpoint presentation ideas master slide. This is a four stage process. The stages in this process are shareholders equity, non current liabilities, short term borrowings, trade payables, other current liabilities.
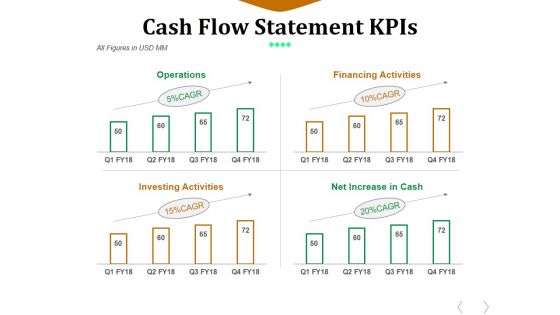
Cash Flow Statement Kpis Template 1 Ppt PowerPoint Presentation Outline Deck
This is a cash flow statement kpis template 1 ppt powerpoint presentation outline deck. This is a four stage process. The stages in this process are operations, financing activities, investing activities, net increase in cash.
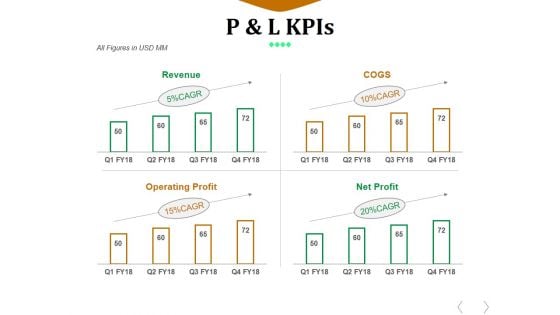
P And L Kpis Template 1 Ppt PowerPoint Presentation Design Ideas
This is a p and l kpis template 1 ppt powerpoint presentation design ideas. This is a four stage process. The stages in this process are revenue, cogs, operating profit, net profit.
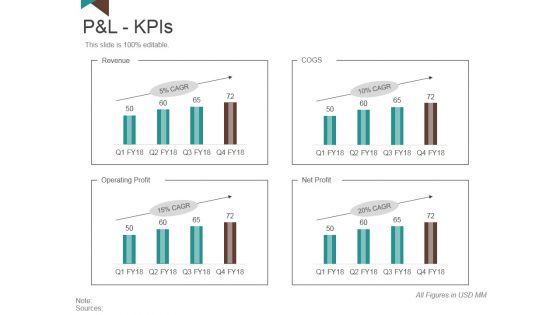
P And L Kpis Template 1 Ppt PowerPoint Presentation Slides Model
This is a p and l kpis template 1 ppt powerpoint presentation slides model. This is a four stage process. The stages in this process are revenue, operating profit, net profit, cogs.
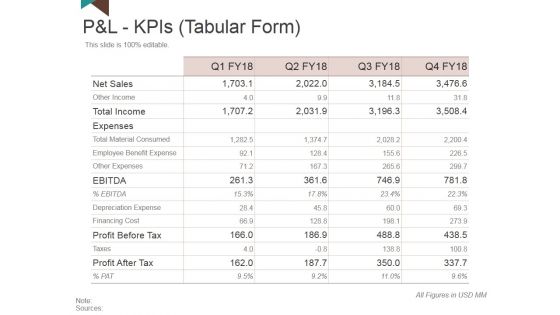
P And L Kpis Template 2 Ppt PowerPoint Presentation Outline Clipart
This is a p and l kpis template 2 ppt powerpoint presentation outline clipart. This is a four stage process. The stages in this process are net sales, total income, expenses, profit before tax, profit after tax.
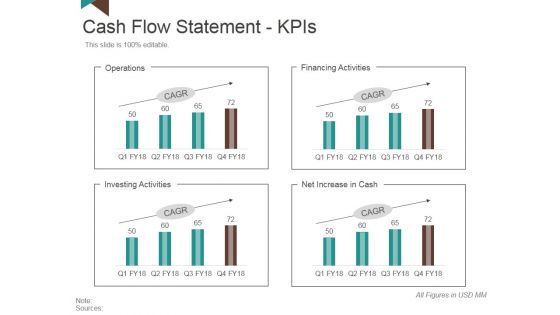
Cash Flow Statement Kpis Template 2 Ppt PowerPoint Presentation Layouts Skills
This is a cash flow statement kpis template 2 ppt powerpoint presentation layouts skills. This is a four stage process. The stages in this process are operations, financing activities, net increase in cash, investing activities.

Cash Flow Statement Kpis Tabular Form Ppt PowerPoint Presentation Infographics File Formats
This is a cash flow statement kpis tabular form ppt powerpoint presentation infographics file formats. This is a four stage process. The stages in this process are operations, investing activities, financing activities, net increase in cash.
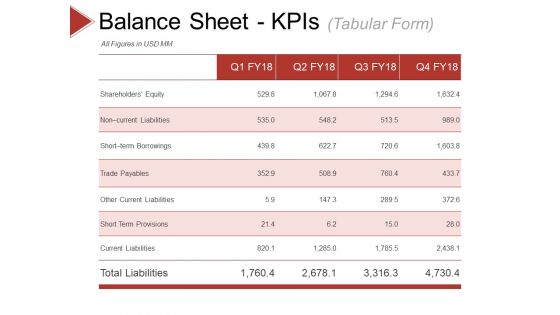
Balance Sheet Kpis Template 2 Ppt PowerPoint Presentation Visual Aids Ideas
This is a balance sheet kpis template 2 ppt powerpoint presentation visual aids ideas. This is a four stage process. The stages in this process are shareholders equity, trade payables, other current liabilities, short term provisions, current liabilities.
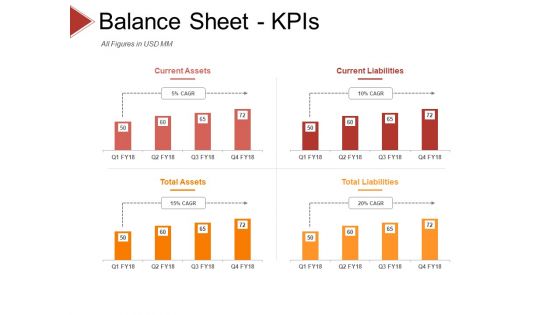
Balance Sheet Kpis Template 3 Ppt PowerPoint Presentation Professional Graphics Design
This is a balance sheet kpis template 3 ppt powerpoint presentation professional graphics design. This is a four stage process. The stages in this process are current assets, current liabilities, total assets, total liabilities.
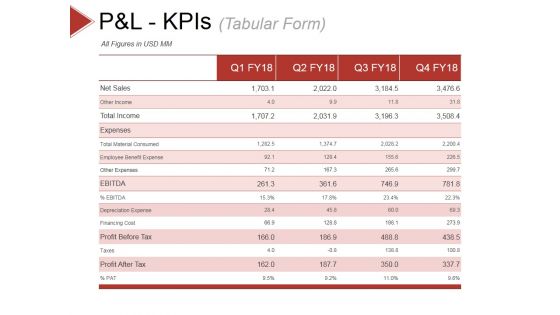
P And L Kpis Template 1 Ppt PowerPoint Presentation Slides Show
This is a p and l kpis template 1 ppt powerpoint presentation slides show. This is a four stage process. The stages in this process are other income, total income, expenses, other expenses, depreciation expense.
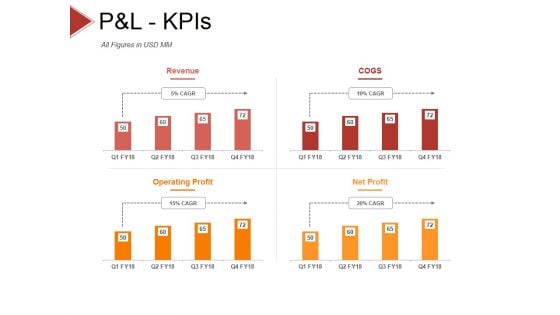
P And L Kpis Template 2 Ppt PowerPoint Presentation Styles Objects
This is a p and l kpis template 2 ppt powerpoint presentation styles objects. This is a four stage process. The stages in this process are revenue, cogs, operating profit, net profit.
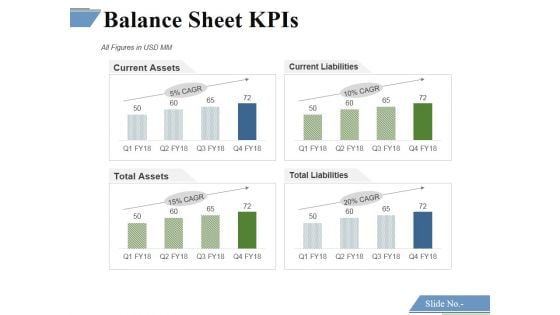
Balance Sheet Kpis Template 1 Ppt PowerPoint Presentation Styles Layout Ideas
This is a balance sheet kpis template 1 ppt powerpoint presentation styles layout ideas. This is a four stage process. The stages in this process are current assets, current liabilities, total assets, total liabilities.
Cash Flow Statement Kpis Template 1 Ppt PowerPoint Presentation Icon Elements
This is a cash flow statement kpis template 1 ppt powerpoint presentation icon elements. This is a four stage process. The stages in this process are operations, financing activities, investing activities, net increase in cash.

P And L Kpis Template 1 Ppt PowerPoint Presentation Model Inspiration
This is a p and l kpis template 1 ppt powerpoint presentation model inspiration. This is a four stage process. The stages in this process are revenue, cogs, operating profit, net profit.
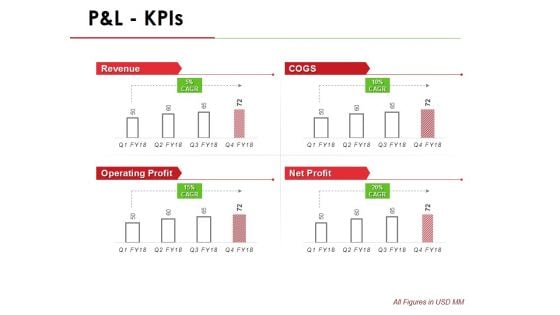
P And L Kpis Template 1 Ppt PowerPoint Presentation Infographic Template Outline
This is a p and l kpis template 1 ppt powerpoint presentation infographic template outline. This is a four stage process. The stages in this process are revenue, operating profit, cogs, net profit.
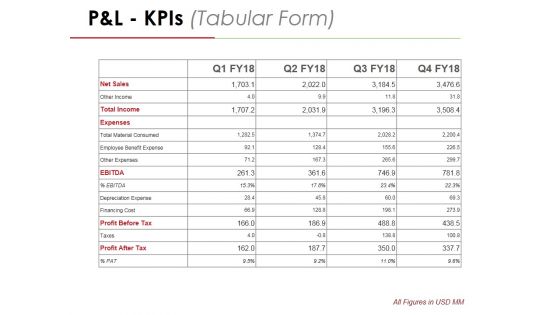
P And L Kpis Template 2 Ppt PowerPoint Presentation Professional Graphics
This is a p and l kpis template 2 ppt powerpoint presentation professional graphics. This is a four stage process. The stages in this process are net sales, other income, total income, expenses, total material consumed.
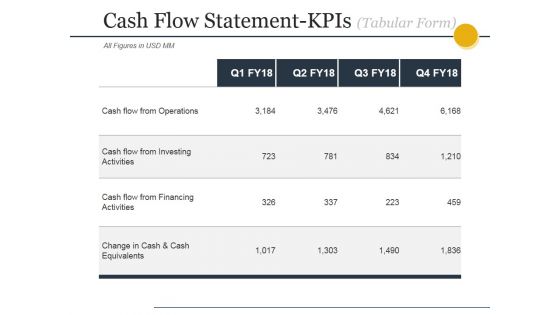
Cash Flow Statement Kpis Tabular Form Ppt PowerPoint Presentation Layouts Grid
This is a cash flow statement kpis tabular form ppt powerpoint presentation layouts grid. This is a four stage process. The stages in this process are operations, financing activities, investing activities, net increase in cash.
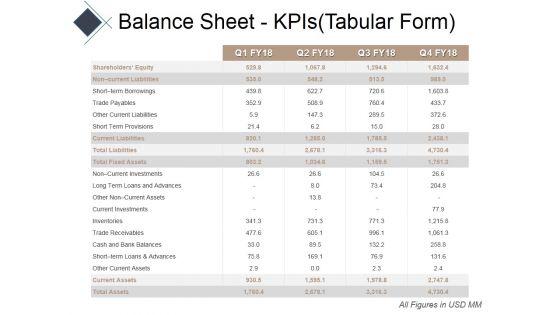
Balance Sheet Kpis Tabular Form Ppt PowerPoint Presentation Show Example Introduction
This is a balance sheet kpis tabular form ppt powerpoint presentation show example introduction. This is a four stage process. The stages in this process are current assets, current liabilities, total assets, total liabilities.
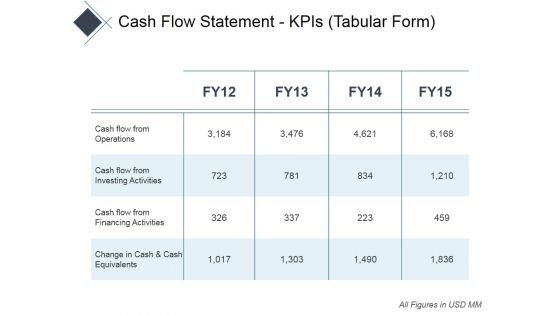
Cash Flow Statement Kpis Tabular Form Ppt PowerPoint Presentation Infographics Professional
This is a cash flow statement kpis tabular form ppt powerpoint presentation infographics professional. This is a four stage process. The stages in this process are operations, financing activities, investing activities, net increase in cash.
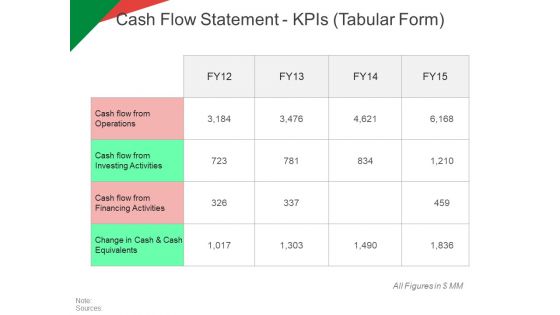
Cash Flow Statement Kpis Tabular Form Ppt PowerPoint Presentation Model Graphic Tips
This is a cash flow statement kpis tabular form ppt powerpoint presentation model graphic tips. This is a four stage process. The stages in this process are operations, investing activities, net increase in cash, financing activities.
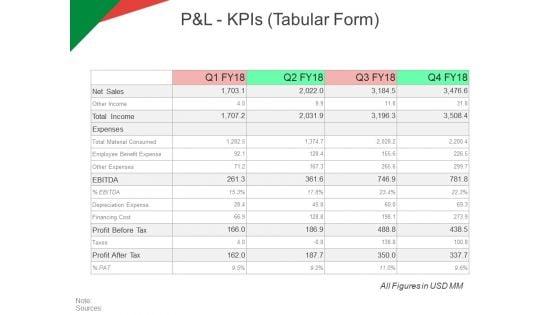
P And L Kpis Tabular Form Ppt PowerPoint Presentation Model Ideas
This is a p and l kpis tabular form ppt powerpoint presentation model ideas. This is a four stage process. The stages in this process are revenue, operating profit, cogs, net profit.
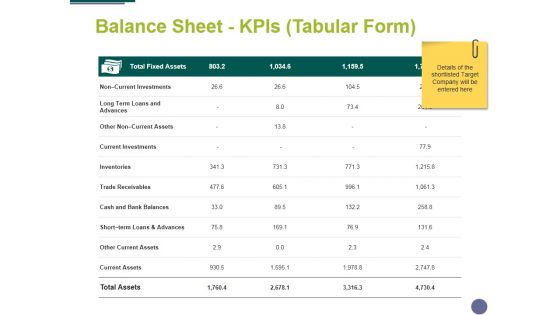
Balance Sheet Kpis Tabular Form Template 2 Ppt PowerPoint Presentation Inspiration Portfolio
This is a balance sheet kpis tabular form template 2 ppt powerpoint presentation inspiration portfolio. This is a four stage process. The stages in this process are business, management, compere, strategy, table.
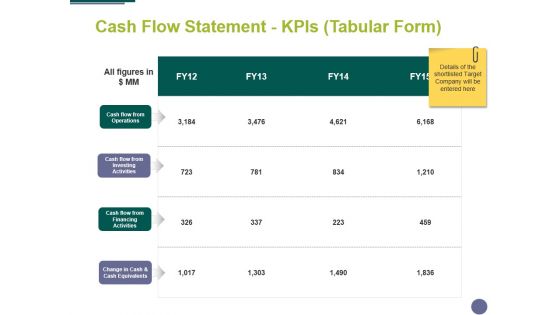
Cash Flow Statement Kpis Tabular Form Ppt PowerPoint Presentation Styles Design Inspiration
This is a cash flow statement kpis tabular form ppt powerpoint presentation styles design inspiration. This is a four stage process. The stages in this process are finance, analysis, management, business, marketing.
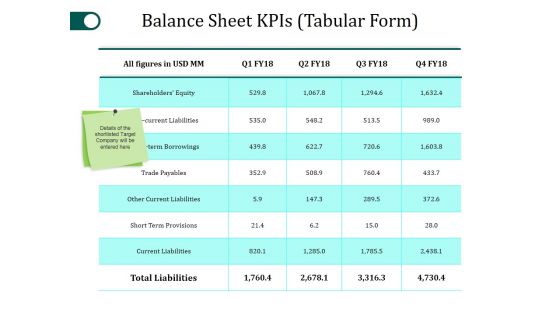
Balance Sheet Kpis Template 2 Ppt PowerPoint Presentation Portfolio Graphics Template
This is a balance sheet kpis template 2 ppt powerpoint presentation portfolio graphics template. This is a four stage process. The stages in this process are shareholders equity, trade payables, other current liabilities, current liabilities, total liabilities.
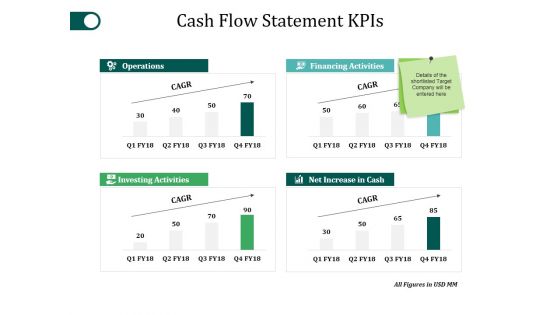
Cash Flow Statement Kpis Template 2 Ppt PowerPoint Presentation Summary Guidelines
This is a cash flow statement kpis template 2 ppt powerpoint presentation summary guidelines. This is a four stage process. The stages in this process are operations, investing activities, net increase in cash, financing activities.
Balance Sheet Kpis Tabular Form Template 2 Ppt PowerPoint Presentation Icon Clipart
This is a balance sheet kpis tabular form template 2 ppt powerpoint presentation icon clipart. This is a four stage process. The stages in this process are business, finance, analysis, investment, strategy.
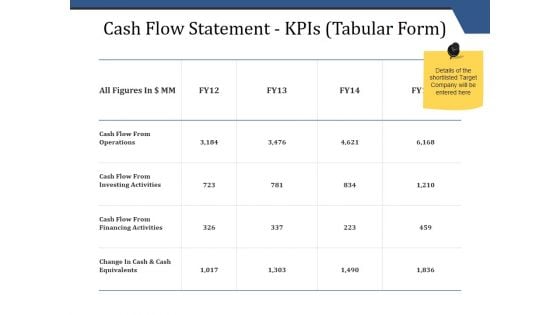
Cash Flow Statement Kpis Tabular Form Ppt PowerPoint Presentation Inspiration Master Slide
This is a cash flow statement kpis tabular form ppt powerpoint presentation inspiration master slide. This is a four stage process. The stages in this process are operations, financing activities, investing activities, net increase in cash.
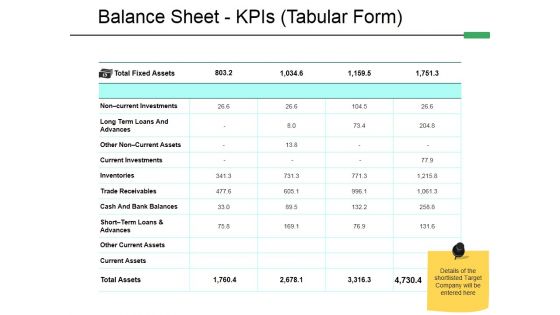
Balance Sheet Kpis Tabular Form Template 2 Ppt PowerPoint Presentation Styles Model
This is a balance sheet kpis tabular form template 2 ppt powerpoint presentation styles model. This is a four stage process. The stages in this process are advances, inventories, trade receivables, current investments, current assets, other current assets.

P And L Kpis Tabular Form Ppt PowerPoint Presentation Ideas Infographics
This is a p and l kpis tabular form ppt powerpoint presentation ideas infographics. This is a four stage process. The stages in this process are other income, expenses, other expenses, depreciation expense, financing cost.
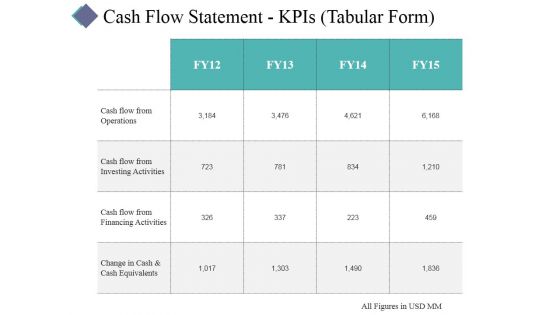
Cash Flow Statement Kpis Template 1 Ppt PowerPoint Presentation Infographic Template Master Slide
This is a cash flow statement kpis template 1 ppt powerpoint presentation infographic template master slide. This is a four stage process. The stages in this process are business, table, management, analysis, success.
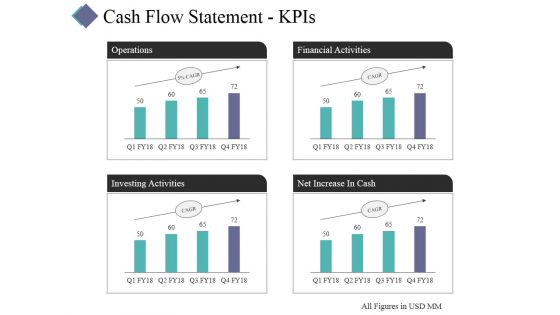
Cash Flow Statement Kpis Template 2 Ppt PowerPoint Presentation Layouts Visuals
This is a cash flow statement kpis template 2 ppt powerpoint presentation layouts visuals. This is a four stage process. The stages in this process are operations, financial activities, investing activities, net increase in cash.
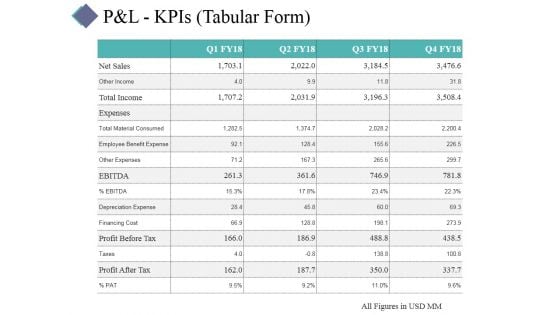
P And L Kpis Template 1 Ppt PowerPoint Presentation Portfolio Visual Aids
This is a p and l kpis template 1 ppt powerpoint presentation portfolio visual aids. This is a four stage process. The stages in this process are business, table, management, analysis, strategy.
P And L Kpis Template 2 Ppt PowerPoint Presentation Summary Icon
This is a p and l kpis template 2 ppt powerpoint presentation summary icon. This is a four stage process. The stages in this process are revenue, cogs, operating profit, net profit.
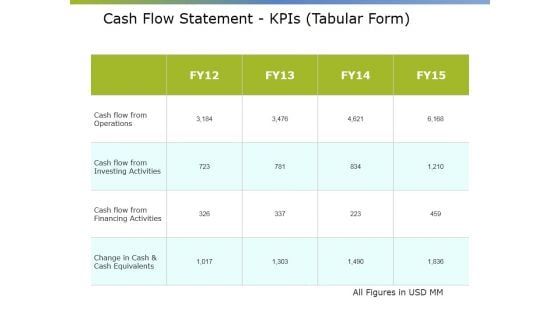
Cash Flow Statement Kpis Tabular Form Ppt PowerPoint Presentation Summary Elements
This is a cash flow statement kpis tabular form ppt powerpoint presentation summary elements. This is a four stage process. The stages in this process are net increase cash, financial activities, operations, investing activities.
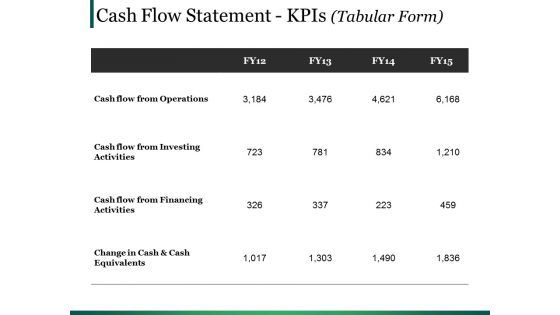
Cash Flow Statement Kpis Template Ppt PowerPoint Presentation Ideas Visual Aids
This is a cash flow statement kpis template ppt powerpoint presentation ideas visual aids. This is a four stage process. The stages in this process are operations, financing activities, investing activities, net increase in cash.
P And L Kpis Template 1 Ppt PowerPoint Presentation Icon Graphics Download
This is a p and l kpis template 1 ppt powerpoint presentation icon graphics download. This is a four stage process. The stages in this process are net sales, total income, expenses, financing cost, profit after tax.


 Continue with Email

 Home
Home


