Snapshot
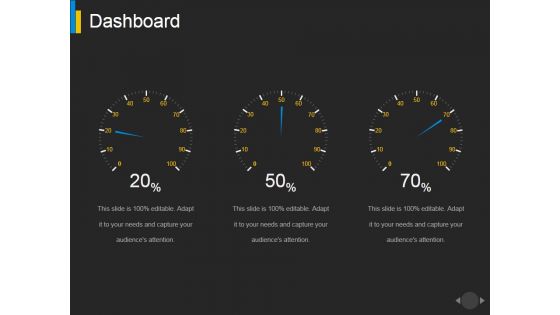
Dashboard Ppt PowerPoint Presentation Portfolio Maker
This is a dashboard ppt powerpoint presentation portfolio maker. This is a three stage process. The stages in this process are dashboard, measurement, finance, business.
Dashboard Ppt PowerPoint Presentation Icon Influencers
This is a dashboard ppt powerpoint presentation icon influencers. This is a three stage process. The stages in this process are dashboard, measurement, business, marketing.
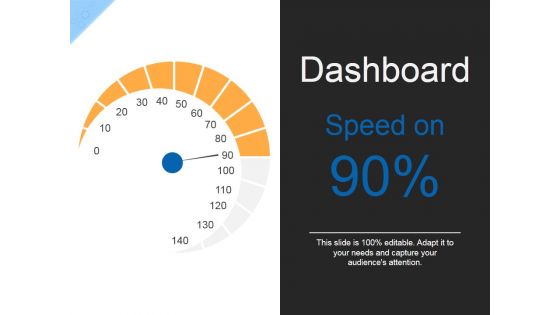
Dashboard Ppt PowerPoint Presentation Infographics Outfit
This is a dashboard ppt powerpoint presentation infographics outfit. This is a one stage process. The stages in this process are dashboard, measurement, finance, business.

Dashboard Ppt PowerPoint Presentation File Background Images
This is a dashboard ppt powerpoint presentation file background images. This is a three stage process. The stages in this process are dashboard, business, marketing, strategy, process.
Social Media In Customer Support Social Media Customer Service Tracking Dashboard Structure Pdf
This slide represents the social dashboard for tracking media customer service by covering the total number of requests and requests answered, total revenue, support costs rate to revenue rate, customer satisfaction, the average time to solve an issue, and so on. This Social Media In Customer Support Social Media Customer Service Tracking Dashboard Structure Pdf from Slidegeeks makes it easy to present information on your topic with precision. It provides customization options, so you can make changes to the colors, design, graphics, or any other component to create a unique layout. It is also available for immediate download, so you can begin using it right away. Slidegeeks has done good research to ensure that you have everything you need to make your presentation stand out. Make a name out there for a brilliant performance. This slide represents the social dashboard for tracking media customer service by covering the total number of requests and requests answered, total revenue, support costs rate to revenue rate, customer satisfaction, the average time to solve an issue, and so on.
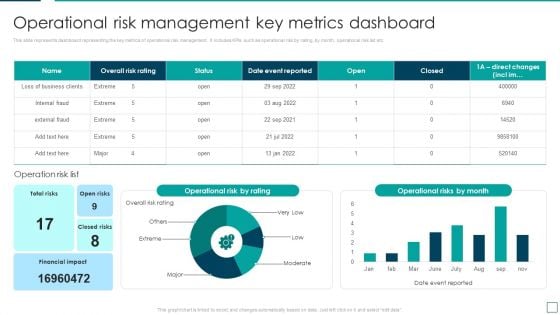
Strategic Risk Management And Mitigation Plan Operational Risk Management Key Metrics Dashboard Sample PDF
This slide represents dashboard representing the key metrics of operational risk management. It includes KPIs such as operational risk by rating, by month, operational risk list etc. Present like a pro with Strategic Risk Management And Mitigation Plan Operational Risk Management Key Metrics Dashboard Sample PDF Create beautiful presentations together with your team, using our easy to use presentation slides. Share your ideas in real time and make changes on the fly by downloading our templates. So whether you are in the office, on the go, or in a remote location, you can stay in sync with your team and present your ideas with confidence. With Slidegeeks presentation got a whole lot easier. Grab these presentations today.
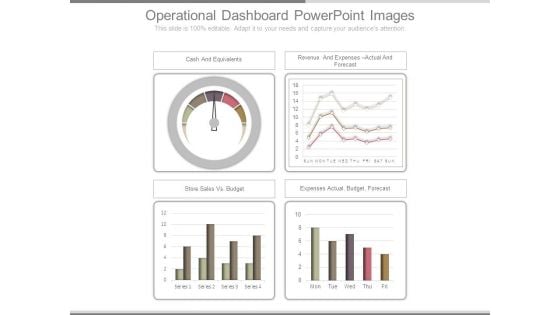
Operational Dashboard Powerpoint Images
This is a operational dashboard powerpoint images. This is a four stage process. The stages in this process are cash and equivalents, revenue and expenses actual and forecast, store sales vs budget, expenses actual budget forecast.
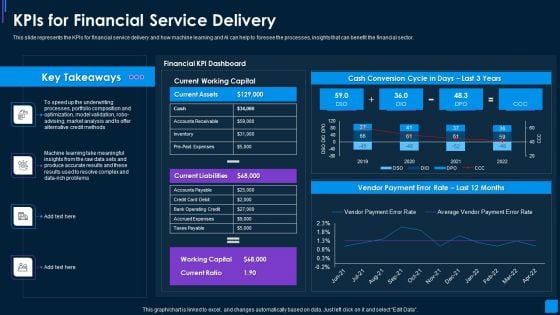
Advance IT Service Delivery Kpis For Financial Service Delivery Ideas PDF
This slide represents the KPIs for financial service delivery and how machine learning and AI can help to foresee the processes, insights that can benefit the financial sector. Deliver an awe inspiring pitch with this creative advance it service delivery kpis for financial service delivery ideas pdf bundle. Topics like financial kpi dashboard, current working capital, cash conversion cycle can be discussed with this completely editable template. It is available for immediate download depending on the needs and requirements of the user.
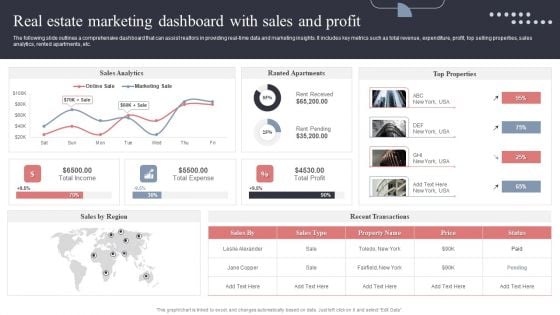
Real Estate Marketing Dashboard With Sales And Profit Formats PDF
The following slide outlines a comprehensive dashboard that can assist realtors in providing real-time data and marketing insights. It includes key metrics such as total revenue, expenditure, profit, top selling properties, sales analytics, rented apartments, etc. This modern and well-arranged Real Estate Marketing Dashboard With Sales And Profit Formats PDF provides lots of creative possibilities. It is very simple to customize and edit with the Powerpoint Software. Just drag and drop your pictures into the shapes. All facets of this template can be edited with Powerpoint, no extra software is necessary. Add your own material, put your images in the places assigned for them, adjust the colors, and then you can show your slides to the world, with an animated slide included.
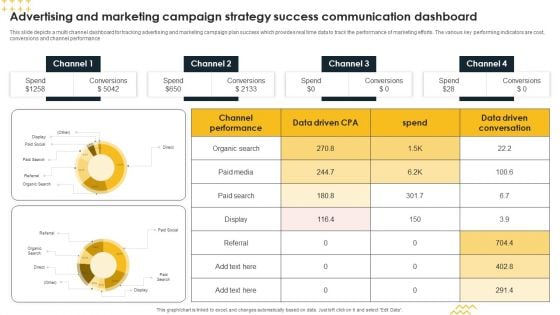
Advertising And Marketing Campaign Strategy Success Communication Dashboard Inspiration PDF
This slide depicts a multi channel dashboard for tracking advertising and marketing campaign plan success which provides real time data to track the performance of marketing efforts. The various key performing indicators are cost, conversions and channel performance Showcasing this set of slides titled Advertising And Marketing Campaign Strategy Success Communication Dashboard Inspiration PDF. The topics addressed in these templates are Conversions, Spend, Channel. All the content presented in this PPT design is completely editable. Download it and make adjustments in color, background, font etc. as per your unique business setting.
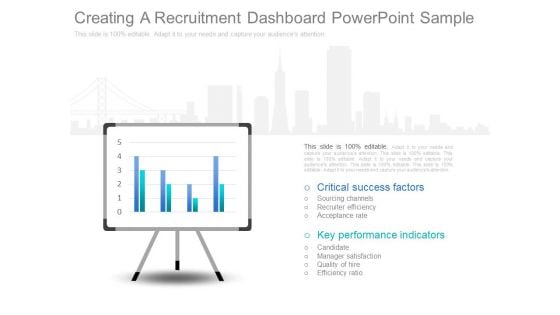
Creating A Recruitment Dashboard Powerpoint Sample
This is a creating a recruitment dashboard powerpoint sample. This is a two stage process. The stages in this process are critical success factors, sourcing channels, recruiter efficiency, acceptance rate, key performance indicators, candidate, manager satisfaction, quality of hire, efficiency ratio.
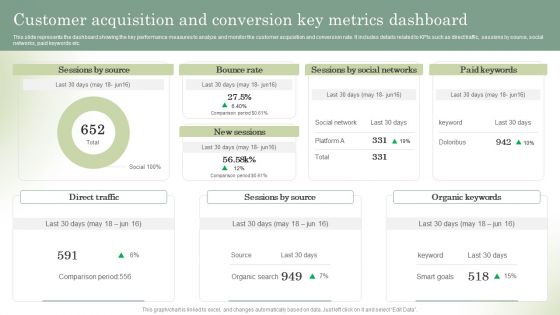
Optimizing Online Stores Customer Acquisition And Conversion Key Metrics Dashboard Formats PDF
This slide represents the dashboard showing the key performance measures to analyze and monitor the customer acquisition and conversion rate. It includes details related to KPIs such as direct traffic, sessions by source, social networks, paid keywords etc. Present like a pro with Optimizing Online Stores Customer Acquisition And Conversion Key Metrics Dashboard Formats PDF Create beautiful presentations together with your team, using our easy-to-use presentation slides. Share your ideas in real-time and make changes on the fly by downloading our templates. So whether youre in the office, on the go, or in a remote location, you can stay in sync with your team and present your ideas with confidence. With Slidegeeks presentation got a whole lot easier. Grab these presentations today.
Regional Sales Growth Dashboard Icon Slides Pdf
Pitch your topic with ease and precision using this Regional Sales Growth Dashboard Icon Slides Pdf. This layout presents information on Regional Sales, Growth Dashboard. It is also available for immediate download and adjustment. So, changes can be made in the color, design, graphics or any other component to create a unique layout. Our Regional Sales Growth Dashboard Icon Slides Pdf are topically designed to provide an attractive backdrop to any subject. Use them to look like a presentation pro.
Consumer Demographics Segmentation Dashboard Icon Clipart Pdf
Pitch your topic with ease and precision using this Consumer Demographics Segmentation Dashboard Icon Clipart Pdf. This layout presents information on Consumer Demographics, Segmentation, Dashboard Icon. It is also available for immediate download and adjustment. So, changes can be made in the color, design, graphics or any other component to create a unique layout. Our Consumer Demographics Segmentation Dashboard Icon Clipart Pdf are topically designed to provide an attractive backdrop to any subject. Use them to look like a presentation pro.
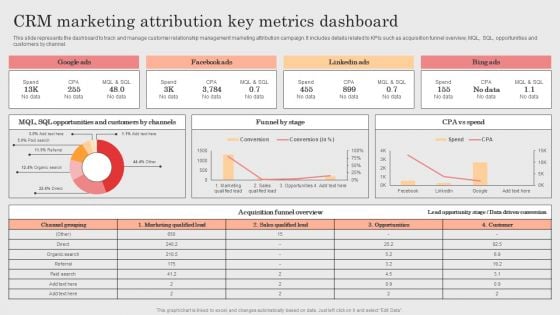
Integrating CRM Solution To Acquire Potential Customers CRM Marketing Attribution Key Metrics Dashboard Template PDF
This slide represents the dashboard to track and manage customer relationship management marketing attribution campaign. It includes details related to KPIs such as acquisition funnel overview, MQL, SQL, opportunities and customers by channel. Are you in need of a template that can accommodate all of your creative concepts This one is crafted professionally and can be altered to fit any style. Use it with Google Slides or PowerPoint. Include striking photographs, symbols, depictions, and other visuals. Fill, move around, or remove text boxes as desired. Test out color palettes and font mixtures. Edit and save your work, or work with colleagues. Download Integrating CRM Solution To Acquire Potential Customers CRM Marketing Attribution Key Metrics Dashboard Template PDF and observe how to make your presentation outstanding. Give an impeccable presentation to your group and make your presentation unforgettable.
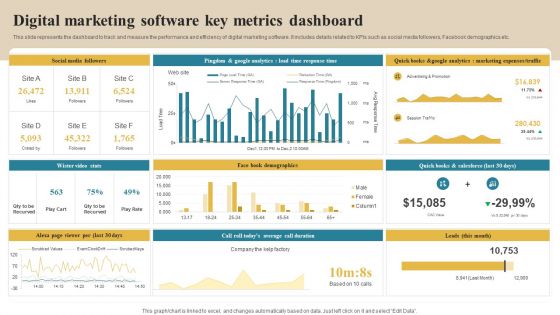
Software Implementation Technique Digital Marketing Software Key Metrics Dashboard Download PDF
This slide represents the dashboard to track and measure the performance and efficiency of digital marketing software. It includes details related to KPIs such as social media followers, Facebook demographics etc. Present like a pro with Software Implementation Technique Digital Marketing Software Key Metrics Dashboard Download PDF Create beautiful presentations together with your team, using our easy to use presentation slides. Share your ideas in real time and make changes on the fly by downloading our templates. So whether you are in the office, on the go, or in a remote location, you can stay in sync with your team and present your ideas with confidence. With Slidegeeks presentation got a whole lot easier. Grab these presentations today.
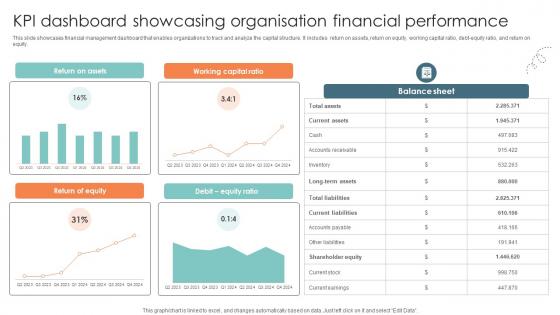
Kpi Dashboard Showcasing Organisation Financial Performance Strategic Approaches To Corporate Financial
This slide showcases financial management dashboard that enables organizations to track and analyze the capital structure. It includes return on assets, return on equity, working capital ratio, debt-equity ratio, and return on equity. This modern and well-arranged Kpi Dashboard Showcasing Organisation Financial Performance Strategic Approaches To Corporate Financial provides lots of creative possibilities. It is very simple to customize and edit with the Powerpoint Software. Just drag and drop your pictures into the shapes. All facets of this template can be edited with Powerpoint, no extra software is necessary. Add your own material, put your images in the places assigned for them, adjust the colors, and then you can show your slides to the world, with an animated slide included. This slide showcases financial management dashboard that enables organizations to track and analyze the capital structure. It includes return on assets, return on equity, working capital ratio, debt-equity ratio, and return on equity.
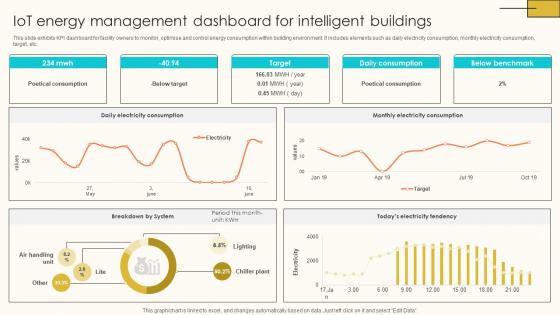
IoT Energy Management Dashboard For Internet Of Things Solutions To Enhance Energy IoT SS V
This slide exhibits KPI dashboard for facility owners to monitor, optimise and control energy consumption within building environment. It includes elements such as daily electricity consumption, monthly electricity consumption, target, etc. This modern and well-arranged IoT Energy Management Dashboard For Internet Of Things Solutions To Enhance Energy IoT SS V provides lots of creative possibilities. It is very simple to customize and edit with the Powerpoint Software. Just drag and drop your pictures into the shapes. All facets of this template can be edited with Powerpoint, no extra software is necessary. Add your own material, put your images in the places assigned for them, adjust the colors, and then you can show your slides to the world, with an animated slide included. This slide exhibits KPI dashboard for facility owners to monitor, optimise and control energy consumption within building environment. It includes elements such as daily electricity consumption, monthly electricity consumption, target, etc.
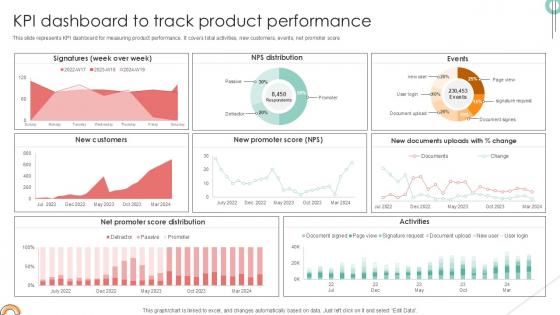
KPI Dashboard To Track Implementing Product Diversification PPT Presentation Strategy SS V
This slide represents KPI dashboard for measuring product performance. It covers total activities, new customers, events, net promoter score. This modern and well-arranged KPI Dashboard To Track Implementing Product Diversification PPT Presentation Strategy SS V provides lots of creative possibilities. It is very simple to customize and edit with the Powerpoint Software. Just drag and drop your pictures into the shapes. All facets of this template can be edited with Powerpoint, no extra software is necessary. Add your own material, put your images in the places assigned for them, adjust the colors, and then you can show your slides to the world, with an animated slide included. This slide represents KPI dashboard for measuring product performance. It covers total activities, new customers, events, net promoter score
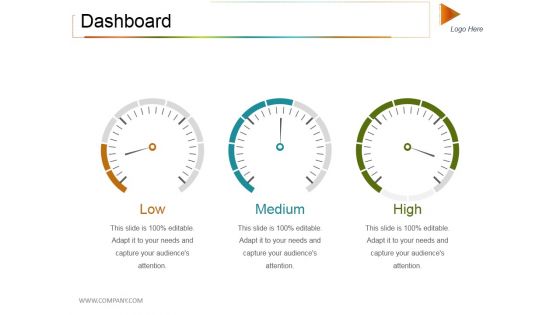
Dashboard Ppt PowerPoint Presentation Inspiration Backgrounds
This is a dashboard ppt powerpoint presentation inspiration backgrounds. This is a three stage process. The stages in this process are low, medium, high, dashboard, measurement.
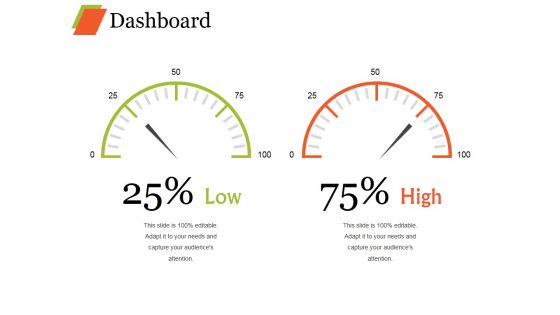
Dashboard Ppt PowerPoint Presentation Styles Templates
This is a dashboard ppt powerpoint presentation styles templates. This is a two stage process. The stages in this process are low, medium, high, dashboard, measurement.
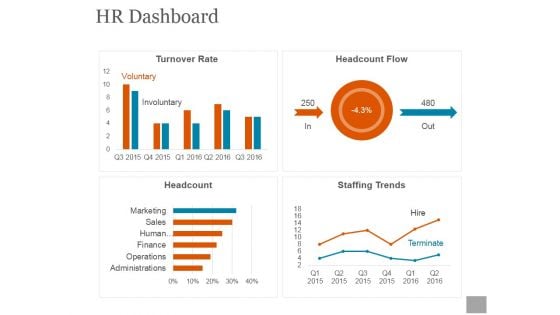
Hr Dashboard Ppt PowerPoint Presentation Shapes
This is a hr dashboard ppt powerpoint presentation shapes. This is a four stage process. The stages in this process are total employees, key metrics, employee churn, open positions by divisions.
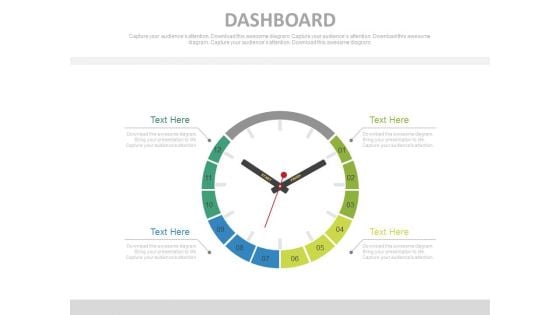
Clock Dashboard Design For Time Management Powerpoint Slides
This innovative, stunningly beautiful template has been designed with graphics of clock dashboard. It helps to portray concepts of time planning and management. This PowerPoint template helps to display your information in a useful, simple and orderly way.
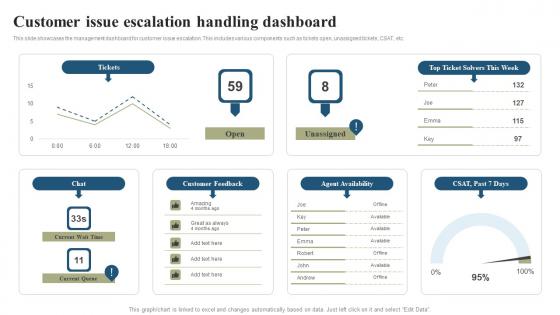
Customer Issue Escalation Handling Dashboard Download Pdf
This slide showcases the management dashboard for customer issue escalation. This includes various components such as tickets open, unassigned tickets, CSAT, etc. Pitch your topic with ease and precision using this Customer Issue Escalation Handling Dashboard Download Pdf This layout presents information on Customer Feedback, Agent Availability, Customer Issue It is also available for immediate download and adjustment. So, changes can be made in the color, design, graphics or any other component to create a unique layout. This slide showcases the management dashboard for customer issue escalation. This includes various components such as tickets open, unassigned tickets, CSAT, etc.
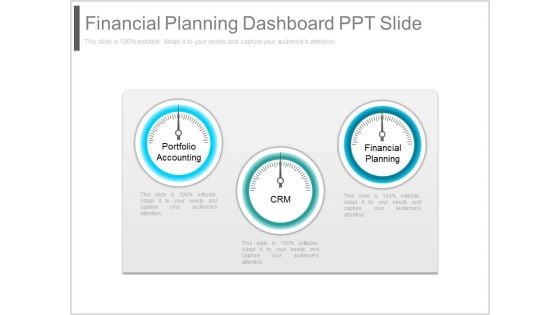
Financial Planning Dashboard Ppt Slide
This is a financial planning dashboard ppt slide. This is a three stage process. The stages in this process are portfolio accounting, crm, financial planning.

Dashboard System Ppt Powerpoint Ideas
This is a dashboard system ppt powerpoint ideas. This is a four stage process. The stages in this process are description.
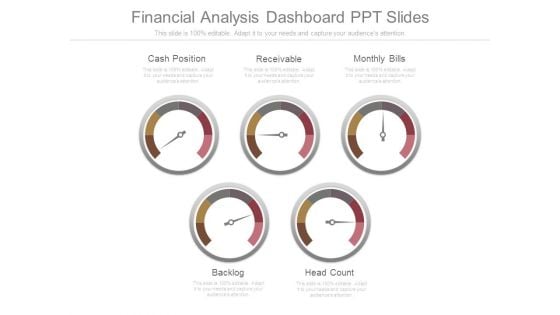
Financial Analysis Dashboard Ppt Slides
This is a financial analysis dashboard ppt slides. This is a five stage process. The stages in this process are cash position, receivable, monthly bills, backlog, head count.
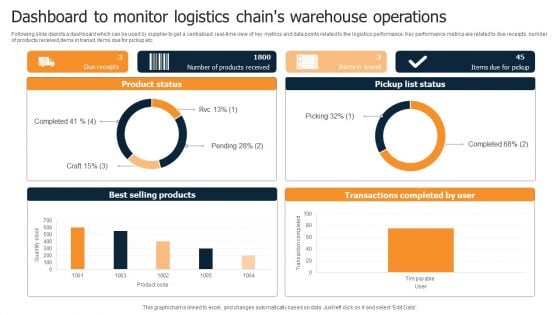
Dashboard To Monitor Logistics Chains Warehouse Operations Diagrams PDF
Following slide depicts a dashboard which can be used by supplier to get a centralized, real-time view of key metrics and data points related to the logistics performance. Key performance metrics are related to due receipts, number of products received,items in transit, items due for pickup etc. Pitch your topic with ease and precision using this Dashboard To Monitor Logistics Chains Warehouse Operations Diagrams PDF. This layout presents information on Product Status, Pickup List Status, Best Selling Products. It is also available for immediate download and adjustment. So, changes can be made in the color, design, graphics or any other component to create a unique layout.
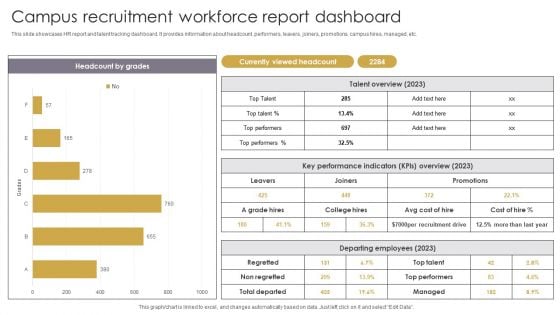
Campus Recruitment Workforce Report Dashboard Guidelines PDF
This slide showcases HR report and talent tracking dashboard. It provides information about headcount, performers, leavers, joiners, promotions, campus hires, managed, etc. Showcasing this set of slides titled Campus Recruitment Workforce Report Dashboard Guidelines PDF. The topics addressed in these templates are Recruitment, Cost, Key Performance Indicators. All the content presented in this PPT design is completely editable. Download it and make adjustments in color, background, font etc. as per your unique business setting.
Marketers Guide To Data Analysis Optimization Website Landing Page KPI Tracking Dashboard Information PDF
This slide covers a dashboard for analyzing the metrics of the website landing page. It includes KPIs such as conversions, conversion rate, sessions, bounce rate, engagement sickness, etc. Present like a pro with Marketers Guide To Data Analysis Optimization Website Landing Page KPI Tracking Dashboard Information PDF Create beautiful presentations together with your team, using our easy to use presentation slides. Share your ideas in real time and make changes on the fly by downloading our templates. So whether you are in the office, on the go, or in a remote location, you can stay in sync with your team and present your ideas with confidence. With Slidegeeks presentation got a whole lot easier. Grab these presentations today.
Sales Analysis Dashboard Ppt PowerPoint Presentation Guidelines
This is a sales analysis dashboard ppt powerpoint presentation guidelines. This is a three stage process. The stages in this process are analysis, dashboard, business, marketing, strategy, success.
Dashboard Ppt PowerPoint Presentation Visual Aids
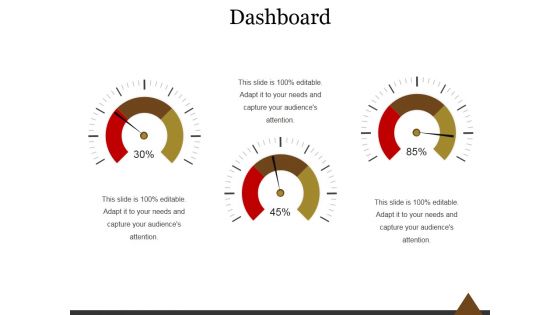
This is a dashboard ppt powerpoint presentation visual aids. This is a three stage process. The stages in this process are dashboard, business, marketing, process, success.
Dashboard Ppt PowerPoint Presentation Summary Styles
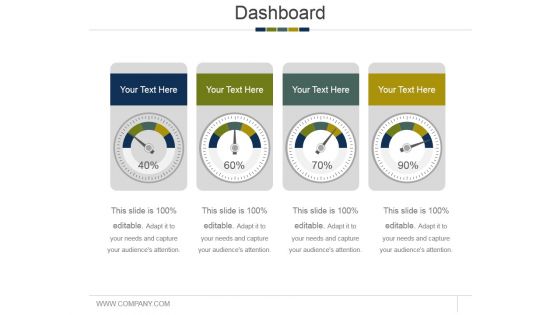
This is a dashboard ppt powerpoint presentation summary styles. This is a four stage process. The stages in this process are dashboard, marketing, business, technology, management.
Dashboard Ppt PowerPoint Presentation Outline Grid
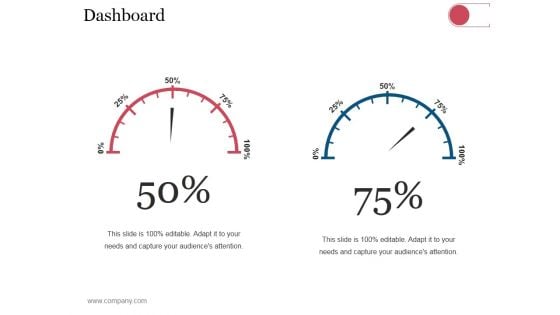
This is a dashboard ppt powerpoint presentation outline grid. This is a two stage process. The stages in this process are business, strategy, analysis, planning, dashboard, finance.

KPI Dashboard To Track Marketing Return On Investment Performance Background PDF
This slide shows key performance indicators dashboard to measure the performs of marketing campaign. It includes metrics such as campaign score, standard customers, growth rate, campaign income, etc. Showcasing this set of slides titled KPI Dashboard To Track Marketing Return On Investment Performance Background PDF. The topics addressed in these templates are Customer Distribution, Standard Customers, Growth Rate. All the content presented in this PPT design is completely editable. Download it and make adjustments in color, background, font etc. as per your unique business setting.
Dashboard Marketing Planning Ppt PowerPoint Presentation Slides Slideshow
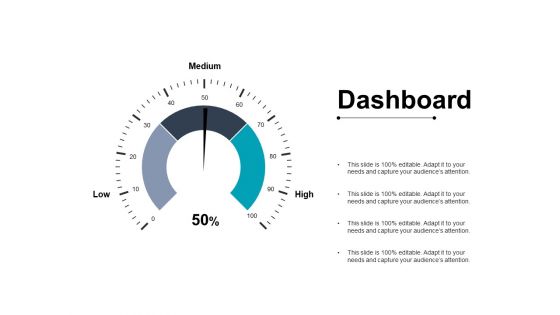
This is a dashboard marketing planning ppt powerpoint presentation slides slideshow. This is a three stage process. The stages in this process are dashboard, finance, analysis, business, investment.
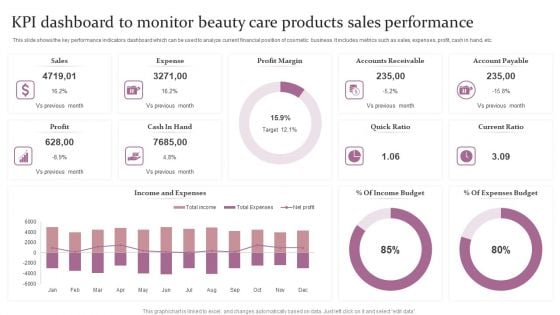
KPI Dashboard To Monitor Beauty Care Products Sales Performance Ppt Outline Example Topics PDF
This slide shows the key performance indicators dashboard which can be used to analyze current financial position of cosmetic business. It includes metrics such as sales, expenses, profit, cash in hand, etc. Showcasing this set of slides titled KPI Dashboard To Monitor Beauty Care Products Sales Performance Ppt Outline Example Topics PDF. The topics addressed in these templates are Accounts Receivable, Profit Margin, Expense. All the content presented in this PPT design is completely editable. Download it and make adjustments in color, background, font etc. as per your unique business setting.
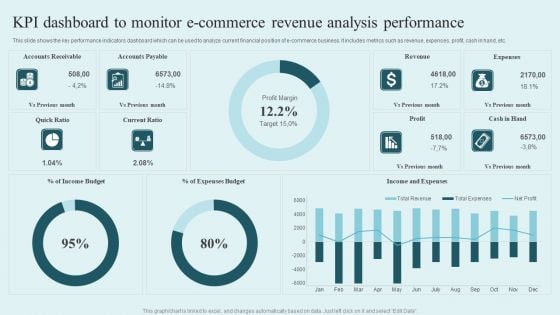
KPI Dashboard To Monitor E Commerce Revenue Analysis Performance Mockup PDF
This slide shows the key performance indicators dashboard which can be used to analyze current financial position of e-commerce business. It includes metrics such as revenue, expenses, profit, cash in hand, etc. Showcasing this set of slides titled KPI Dashboard To Monitor E Commerce Revenue Analysis Performance Mockup PDF. The topics addressed in these templates are Accounts Receivable, Accounts Payable, Revenue, Expenses. All the content presented in this PPT design is completely editable. Download it and make adjustments in color, background, font etc. as per your unique business setting.
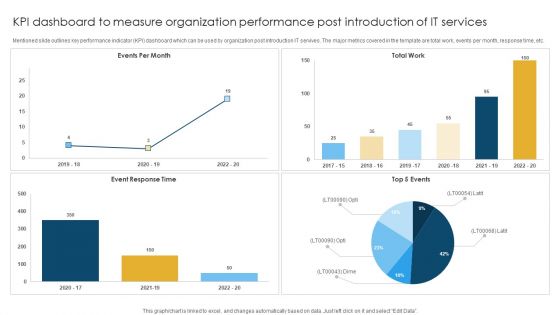
KPI Dashboard To Measure Organization Performance Post Introduction Of IT Services Rules PDF
Mentioned slide outlines key performance indicator KPI dashboard which can be used by organization post introduction IT servives. The major metrics covered in the template are total work, events per month, response time, etc. Showcasing this set of slides titled KPI Dashboard To Measure Organization Performance Post Introduction Of IT Services Rules PDF. The topics addressed in these templates are Event Response, Total Work, Events Per. All the content presented in this PPT design is completely editable. Download it and make adjustments in color, background, font etc. as per your unique business setting.
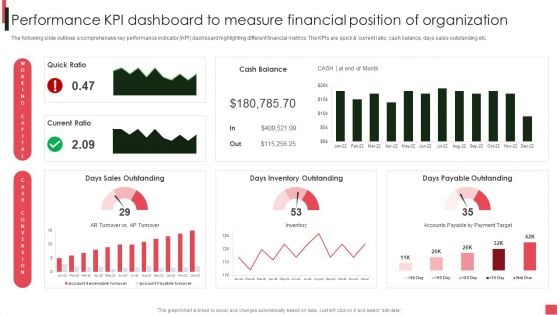
Overview Of Organizational Performance Kpi Dashboard To Measure Financial Position Sample PDF
The following slide outlines a comprehensive key performance indicator KPI dashboard highlighting different financial metrics. The KPIs are quick and current ratio, cash balance, days sales outstanding etc. Welcome to our selection of the Overview Of Organizational Performance Kpi Dashboard To Measure Financial Position Sample PDF. These are designed to help you showcase your creativity and bring your sphere to life. Planning and Innovation are essential for any business that is just starting out. This collection contains the designs that you need for your everyday presentations. All of our PowerPoints are 100 percent editable, so you can customize them to suit your needs. This multi-purpose template can be used in various situations. Grab these presentation templates today.
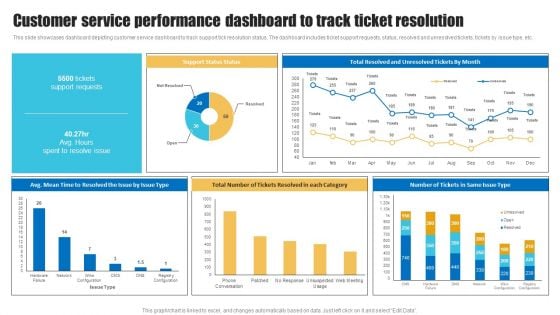
Customer Service Performance Dashboard To Track Ticket Resolution Clipart PDF
This slide showcases dashboard depicting customer service dashboard to track support tick resolution status. The dashboard includes ticket support requests, status, resolved and unresolved tickets, tickets by issue type, etc. Here you can discover an assortment of the finest PowerPoint and Google Slides templates. With these templates, you can create presentations for a variety of purposes while simultaneously providing your audience with an eye catching visual experience. Download Customer Service Performance Dashboard To Track Ticket Resolution Clipart PDF to deliver an impeccable presentation. These templates will make your job of preparing presentations much quicker, yet still, maintain a high level of quality. Slidegeeks has experienced researchers who prepare these templates and write high quality content for you. Later on, you can personalize the content by editing the Customer Service Performance Dashboard To Track Ticket Resolution Clipart PDF.
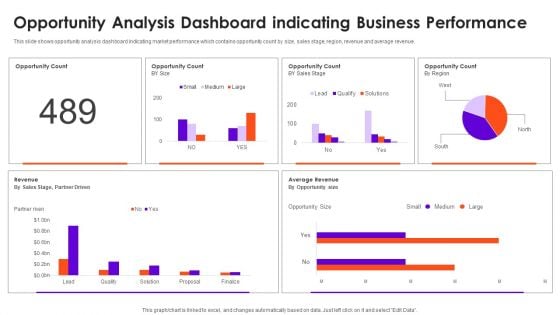
Opportunity Analysis Dashboard Indicating Business Performance Information Rules PDF
This slide shows opportunity analysis dashboard indicating market performance which contains opportunity count by size, sales stage, region, revenue and average revenue. Pitch your topic with ease and precision using this Opportunity Analysis Dashboard Indicating Business Performance Information Rules PDF. This layout presents information on Opportunity Count, Revenue, Sales. It is also available for immediate download and adjustment. So, changes can be made in the color, design, graphics or any other component to create a unique layout.
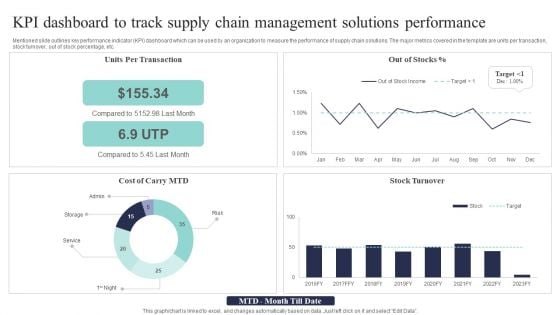
KPI Dashboard To Track Supply Chain Management Solutions Performance Background PDF
Mentioned slide outlines key performance indicator KPI dashboard which can be used by an organization to measure the performance of supply chain solutions. The major metrics covered in the template are units per transaction, stock turnover, out of stock percentage, etc. Pitch your topic with ease and precision using this KPI Dashboard To Track Supply Chain Management Solutions Performance Background PDF. This layout presents information on Per Transaction, Compared Last, Stock Turnover. It is also available for immediate download and adjustment. So, changes can be made in the color, design, graphics or any other component to create a unique layout.
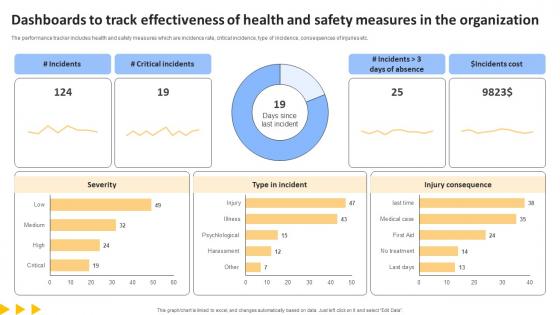
Workforce Productivity Improvement Dashboards To Track Effectiveness Of Health And Safety Topics Pdf
The performance tracker includes health and safety measures which are incidence rate, critical incidence, type of incidence, consequences of injuries etc. This modern and well arranged Workforce Productivity Improvement Dashboards To Track Effectiveness Of Health And Safety Topics Pdf provides lots of creative possibilities. It is very simple to customize and edit with the Powerpoint Software. Just drag and drop your pictures into the shapes. All facets of this template can be edited with Powerpoint, no extra software is necessary. Add your own material, put your images in the places assigned for them, adjust the colors, and then you can show your slides to the world, with an animated slide included. The performance tracker includes health and safety measures which are incidence rate, critical incidence, type of incidence, consequences of injuries etc.
Client Support Satisfaction Dashboard Icons PDF
This slide shows KPI dashboard which can be used to track customer satisfaction level. It includes key performance indicators such as total requests, cases by channel, customer satisfaction by subject, etc. Showcasing this set of slides titled Client Support Satisfaction Dashboard Icons PDF. The topics addressed in these templates are Client Support, Satisfaction Dashboard. All the content presented in this PPT design is completely editable. Download it and make adjustments in color, background, font etc. as per your unique business setting.

Project Capabilities Kpis And Dashboards Ppt Gallery Slide Download PDF
Presenting this set of slides with name project capabilities kpis and dashboards ppt gallery slide download pdf. This is a two stage process. The stages in this process are metrics, dashboard. This is a completely editable PowerPoint presentation and is available for immediate download. Download now and impress your audience.
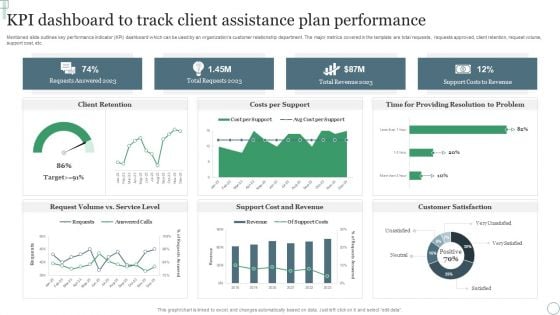
KPI Dashboard To Track Client Assistance Plan Performance Ppt Professional Outfit PDF
Mentioned slide outlines key performance indicator KPI dashboard which can be used by an organizations customer relationship department. The major metrics covered in the template are total requests, requests approved, client retention, request volume, support cost, etc. Pitch your topic with ease and precision using this KPI Dashboard To Track Client Assistance Plan Performance Ppt Professional Outfit PDF. This layout presents information on Requests Answered 2023, Total Requests 2023, Total Revenue 2023. It is also available for immediate download and adjustment. So, changes can be made in the color, design, graphics or any other component to create a unique layout.
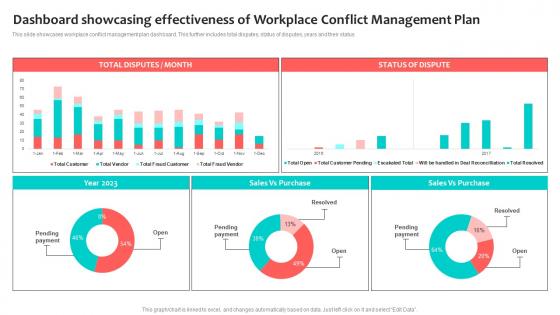
Dashboard Showcasing Effectiveness Of Workplace Conflict Management Plan Formats Pdf
This slide showcases workplace conflict management plan dashboard. This further includes total disputes, status of disputes, years and their status Pitch your topic with ease and precision using this Dashboard Showcasing Effectiveness Of Workplace Conflict Management Plan Formats Pdf. This layout presents information on Dashboard Showcasing Effectiveness, Workplace Conflict Management Plan. It is also available for immediate download and adjustment. So, changes can be made in the color, design, graphics or any other component to create a unique layout. This slide showcases workplace conflict management plan dashboard. This further includes total disputes, status of disputes, years and their status
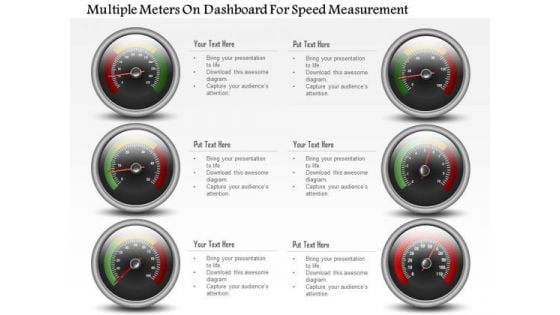
Business Diagram Multiple Meters On Dashboard For Speed Measurement PowerPoint Slide
This business diagram has been designed with multiple meters on dashboard. This slide can be used for business planning and progress. Use this diagram for your business and success milestones related presentations.

Financial Dashboard Examples Ppt Templates
This is a financial dashboard examples ppt templates. This is a four stage process. The stages in this process are income distribution, cogs distributions, expense distributions, profit and loss.
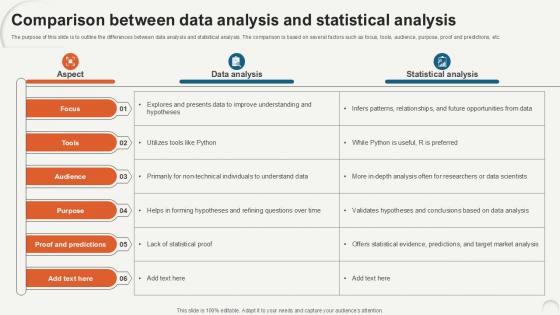
Comparison Between Data Analytics For Informed Decision Ppt Presentation
The purpose of this slide is to outline the differences between data analysis and statistical analysis. The comparison is based on several factors such as focus, tools, audience, purpose, proof and predictions, etc. From laying roadmaps to briefing everything in detail, our templates are perfect for you. You can set the stage with your presentation slides. All you have to do is download these easy-to-edit and customizable templates. Comparison Between Data Analytics For Informed Decision Ppt Presentation will help you deliver an outstanding performance that everyone would remember and praise you for. Do download this presentation today. The purpose of this slide is to outline the differences between data analysis and statistical analysis. The comparison is based on several factors such as focus, tools, audience, purpose, proof and predictions, etc.
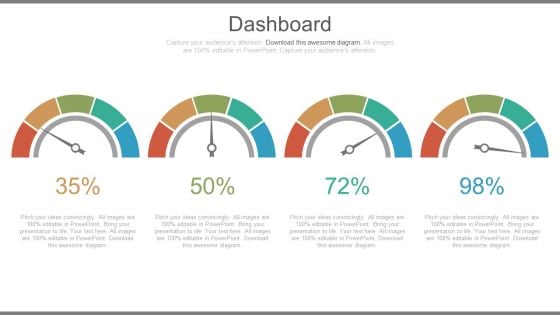
Dashboards For Profit Growth Analysis Powerpoint Slides
This PowerPoint template has been designed with graphics of dashboard. You may use this dashboard slide design to exhibit profit growth analysis. This PPT slide is powerful tool to describe your ideas.
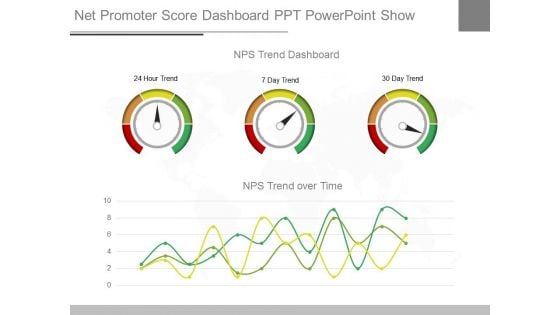
Net Promoter Score Dashboard Ppt Powerpoint Show
This is a net promoter score dashboard ppt powerpoint show. This is a three stage process. The stages in this process are nps trend dashboard, 24 hour trend, 7 day trend, 30 day trend, nps trend over time.
Cybernetics Implant Performance Tracking Dashboard Cybernetic Integration Icons Pdf
This slide shows the Cybernetics implant performance tracking dashboard. The purpose of this slide is to represent the Information related to the status of Cybernetics implant graphically. Presenting this PowerPoint presentation, titled Cybernetics Implant Performance Tracking Dashboard Cybernetic Integration Icons Pdf with topics curated by our researchers after extensive research. This editable presentation is available for immediate download and provides attractive features when used. Download now and captivate your audience. Presenting this Cybernetics Implant Performance Tracking Dashboard Cybernetic Integration Icons Pdf Our researchers have carefully researched and created these slides with all aspects taken into consideration. This is a completely customizable Cybernetics Implant Performance Tracking Dashboard Cybernetic Integration Icons Pdf that is available for immediate downloading. Download now and make an impact on your audience. Highlight the attractive features available with our PPTs. This slide shows the Cybernetics implant performance tracking dashboard. The purpose of this slide is to represent the Information related to the status of Cybernetics implant graphically.
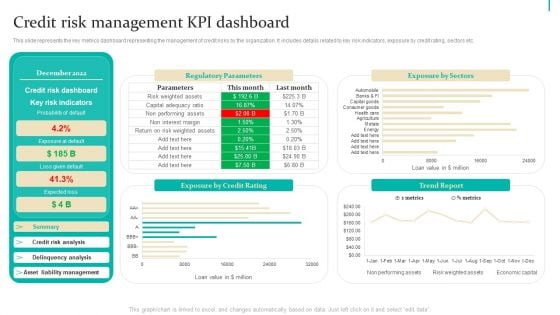
Enterprise Risk Management Credit Risk Management KPI Dashboard Introduction PDF
This slide represents the key metrics dashboard representing the management of credit risks by the organization. It includes details related to key risk indicators, exposure by credit rating, sectors etc. Present like a pro with Enterprise Risk Management Credit Risk Management KPI Dashboard Introduction PDF Create beautiful presentations together with your team, using our easy-to-use presentation slides. Share your ideas in real-time and make changes on the fly by downloading our templates. So whether youre in the office, on the go, or in a remote location, you can stay in sync with your team and present your ideas with confidence. With Slidegeeks presentation got a whole lot easier. Grab these presentations today.
Speed Dashboard With Arrows Percent Values And Icons Ppt PowerPoint Presentation Infographic Template Model
This is a speed dashboard with arrows percent values and icons ppt powerpoint presentation infographic template model. This is a two stage process. The stages in this process are fuel gauge, gas gauge, fuel containers.
Fuel Tank Dashboard With Arrow Ppt PowerPoint Presentation File Graphics Download PDF
Persuade your audience using this fuel tank dashboard with arrow ppt powerpoint presentation file graphics download pdf. This PPT design covers three stages, thus making it a great tool to use. It also caters to a variety of topics including fuel tank dashboard with arrow. Download this PPT design now to present a convincing pitch that not only emphasizes the topic but also showcases your presentation skills.
KPI Dashboard With Pen Vector Icon Ppt PowerPoint Presentation Professional Infographics PDF
Persuade your audience using this kpi dashboard with pen vector icon ppt powerpoint presentation professional infographics pdf. This PPT design covers three stages, thus making it a great tool to use. It also caters to a variety of topics including kpi dashboard with pen vector icon. Download this PPT design now to present a convincing pitch that not only emphasizes the topic but also showcases your presentation skills.
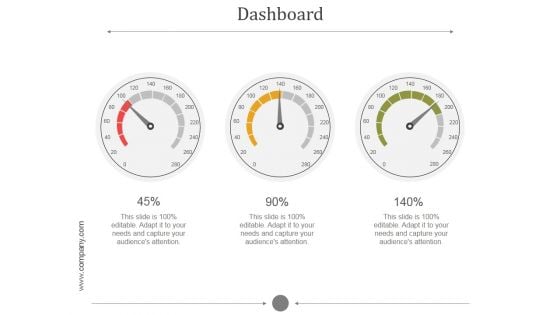
Dashboard Ppt PowerPoint Presentation Show
This is a dashboard ppt powerpoint presentation show. This is a three stage process. The stages in this process are speed, meter, measure, needle, calculate.
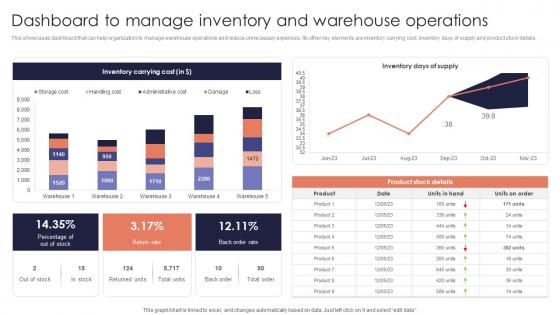
Dashboard Manage Inventory Minimizing Inventory Wastage Through Warehouse Microsoft Pdf
This showcases dashboard that can help organization to manage warehouse operations and reduce unnecessary expenses. Its other key elements are inventory carrying cost, inventory days of supply and product stock details. There are so many reasons you need a Dashboard Manage Inventory Minimizing Inventory Wastage Through Warehouse Microsoft Pdf. The first reason is you can not spend time making everything from scratch, Thus, Slidegeeks has made presentation templates for you too. You can easily download these templates from our website easily. This showcases dashboard that can help organization to manage warehouse operations and reduce unnecessary expenses. Its other key elements are inventory carrying cost, inventory days of supply and product stock details.


 Continue with Email

 Home
Home


