Snapshot
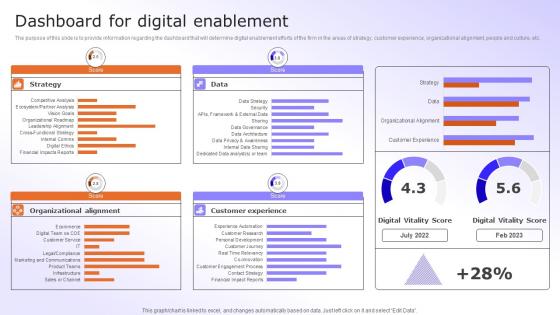
Digital Advancement Checklist Dashboard For Digital Enablement Portrait Pdf
The purpose of this slide is to provide information regarding the dashboard that will determine digital enablement efforts of the firm in the areas of strategy, customer experience, organizational alignment, people and culture, etc. From laying roadmaps to briefing everything in detail, our templates are perfect for you. You can set the stage with your presentation slides. All you have to do is download these easy-to-edit and customizable templates. Digital Advancement Checklist Dashboard For Digital Enablement Portrait Pdf will help you deliver an outstanding performance that everyone would remember and praise you for. Do download this presentation today. The purpose of this slide is to provide information regarding the dashboard that will determine digital enablement efforts of the firm in the areas of strategy, customer experience, organizational alignment, people and culture, etc.
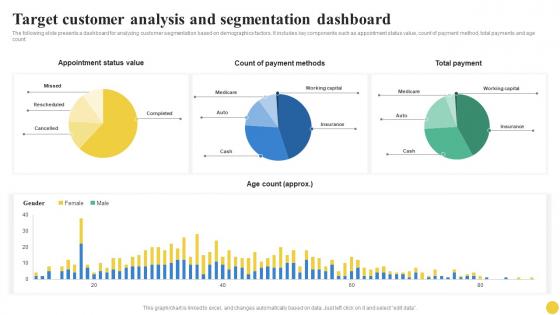
Target Customer Analysis And Segmentation Dashboard User Segmentation Professional Pdf
The following slide presents a dashboard for analyzing customer segmentation based on demographics factors. It includes key components such as appointment status value, count of payment method, total payments and age count. Are you in need of a template that can accommodate all of your creative concepts This one is crafted professionally and can be altered to fit any style. Use it with Google Slides or PowerPoint. Include striking photographs, symbols, depictions, and other visuals. Fill, move around, or remove text boxes as desired. Test out color palettes and font mixtures. Edit and save your work, or work with colleagues. Download Target Customer Analysis And Segmentation Dashboard User Segmentation Professional Pdf and observe how to make your presentation outstanding. Give an impeccable presentation to your group and make your presentation unforgettable. The following slide presents a dashboard for analyzing customer segmentation based on demographics factors. It includes key components such as appointment status value, count of payment method, total payments and age count.
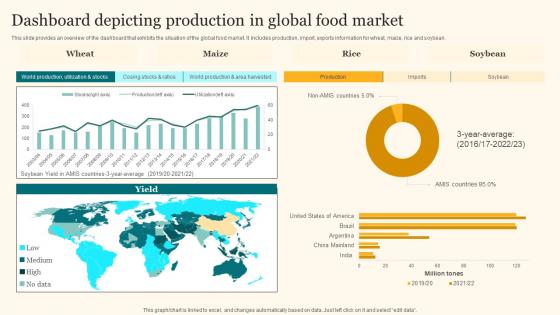
Dashboard Depicting Production In Global Agricultural Product Promotion Template Pdf
This slide provides an overview of the dashboard that exhibits the situation of the global food market. It includes production, import, exports information for wheat, maize, rice and soybean. Are you in need of a template that can accommodate all of your creative concepts This one is crafted professionally and can be altered to fit any style. Use it with Google Slides or PowerPoint. Include striking photographs, symbols, depictions, and other visuals. Fill, move around, or remove text boxes as desired. Test out color palettes and font mixtures. Edit and save your work, or work with colleagues. Download Dashboard Depicting Production In Global Agricultural Product Promotion Template Pdf and observe how to make your presentation outstanding. Give an impeccable presentation to your group and make your presentation unforgettable. This slide provides an overview of the dashboard that exhibits the situation of the global food market. It includes production, import, exports information for wheat, maize, rice and soybean.
Dashboard For Tracking Onboarding Email Campaign Results Designs Pdf
The purpose of this slide is to represent a dashboard for welcome email campaign result to analyse the success rate. It includes component such as click through rate, click to open ratio, soft bounce rate, unsubscribe rate, hard bounce rate etc. Pitch your topic with ease and precision using this Dashboard For Tracking Onboarding Email Campaign Results Designs Pdf. This layout presents information on Monthly Total Subscribers, Monthly Open Rate, Unsubscribe Rate . It is also available for immediate download and adjustment. So, changes can be made in the color, design, graphics or any other component to create a unique layout. The purpose of this slide is to represent a dashboard for welcome email campaign result to analyse the success rate. It includes component such as click through rate, click to open ratio, soft bounce rate, unsubscribe rate, hard bounce rate etc.
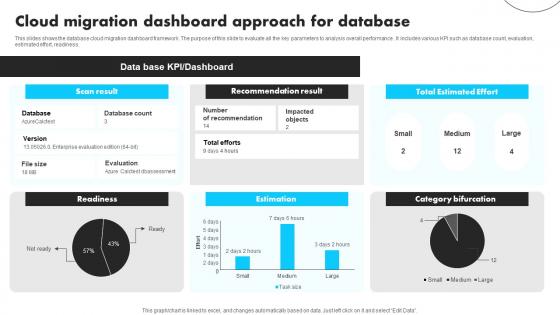
Cloud Migration Dashboard Approach For Database Guidelines Pdf
This slides shows the database cloud migration dashboard framework. The purpose of this slide to evaluate all the key parameters to analysis overall performance . It includes various KPI such as database count, evaluation, estimated effort, readiness. Pitch your topic with ease and precision using this Cloud Migration Dashboard Approach For Database Guidelines Pdf This layout presents information on Recommendation Result, Total Estimated Effort, Estimation It is also available for immediate download and adjustment. So, changes can be made in the color, design, graphics or any other component to create a unique layout. This slides shows the database cloud migration dashboard framework. The purpose of this slide to evaluate all the key parameters to analysis overall performance . It includes various KPI such as database count, evaluation, estimated effort, readiness.
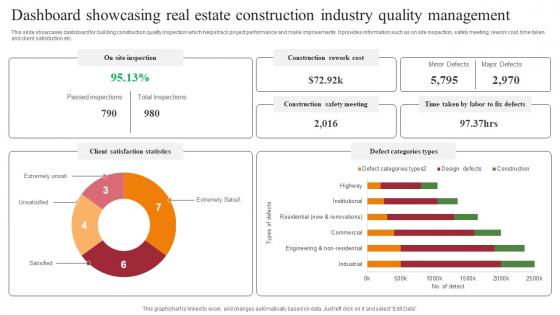
Dashboard Showcasing Real Estate Construction Industry Quality Management Topics Pdf
This slide showcases dashboard for building construction quality inspection which helps track project performance and make improvements. It provides information such as on site inspection, safety meeting, rework cost, time taken and client satisfaction etc. Pitch your topic with ease and precision using this Dashboard Showcasing Real Estate Construction Industry Quality Management Topics Pdf. This layout presents information on Client Satisfaction Statistics, Defect Categories Types. It is also available for immediate download and adjustment. So, changes can be made in the color, design, graphics or any other component to create a unique layout. This slide showcases dashboard for building construction quality inspection which helps track project performance and make improvements. It provides information such as on site inspection, safety meeting, rework cost, time taken and client satisfaction etc.
Devops For Infrastructure Management Dashboard Showcasing Performance Tracking Portrait Pdf
This slide showcases the devops infrastructure dashboard showcasing performance tracking which helps an organization to carefully access the task completed. It include details such as work in progress, viruses, assigned items, etc. Pitch your topic with ease and precision using this Devops For Infrastructure Management Dashboard Showcasing Performance Tracking Portrait Pdf This layout presents information on Work In Progress, Backlog Work, Uncompleted Work It is also available for immediate download and adjustment. So, changes can be made in the color, design, graphics or any other component to create a unique layout. This slide showcases the devops infrastructure dashboard showcasing performance tracking which helps an organization to carefully access the task completed. It include details such as work in progress, viruses, assigned items, etc.
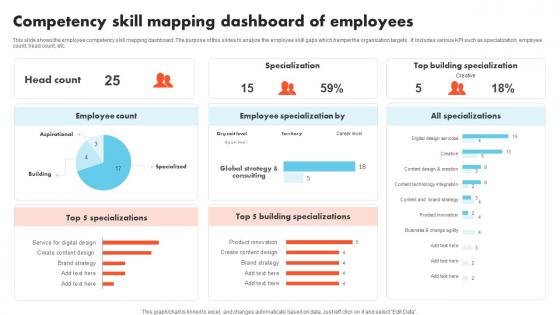
Competency Skill Mapping Dashboard Of Employees Formats Pdf
This slide shows the employee competency skill mapping dashboard .The purpose of this slides to analyze the employee skill gaps which hamper the organization targets .It includes various KPI such as specialization, employee count, head count, etc. Pitch your topic with ease and precision using this Competency Skill Mapping Dashboard Of Employees Formats Pdf This layout presents information on Employee Specialization, Building Specializations, Specialization It is also available for immediate download and adjustment. So, changes can be made in the color, design, graphics or any other component to create a unique layout. This slide shows the employee competency skill mapping dashboard .The purpose of this slides to analyze the employee skill gaps which hamper the organization targets .It includes various KPI such as specialization, employee count, head count, etc.
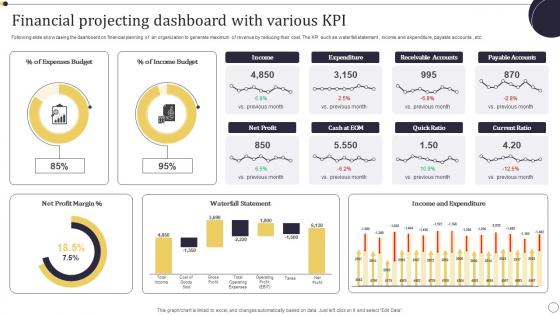
Financial Projecting Dashboard With Various KPI Themes Pdf
Following slide showcasing the dashboard on financial planning of an organization to generate maximum of revenue by reducing their cost. The KPI such as waterfall statement , income and expenditure, payable accounts , etc . Pitch your topic with ease and precision using this Financial Projecting Dashboard With Various KPI Themes Pdf. This layout presents information on Income Budget, Expenses Budget, Net Profit Margin. It is also available for immediate download and adjustment. So, changes can be made in the color, design, graphics or any other component to create a unique layout. Following slide showcasing the dashboard on financial planning of an organization to generate maximum of revenue by reducing their cost. The KPI such as waterfall statement , income and expenditure, payable accounts , etc .
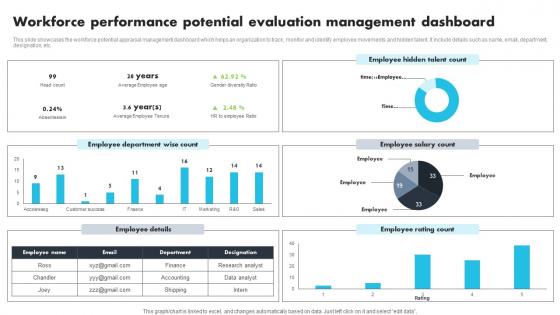
Workforce Performance Potential Evaluation Management Dashboard Clipart Pdf
This slide showcases the workforce potential appraisal management dashboard which helps an organization to track, monitor and identify employee movements and hidden talent. It include details such as name, email, department, designation, etc. Pitch your topic with ease and precision using this Workforce Performance Potential Evaluation Management Dashboard Clipart Pdf. This layout presents information on Employee Department, Employee Salary Count. It is also available for immediate download and adjustment. So, changes can be made in the color, design, graphics or any other component to create a unique layout. This slide showcases the workforce potential appraisal management dashboard which helps an organization to track, monitor and identify employee movements and hidden talent. It include details such as name, email, department, designation, etc.
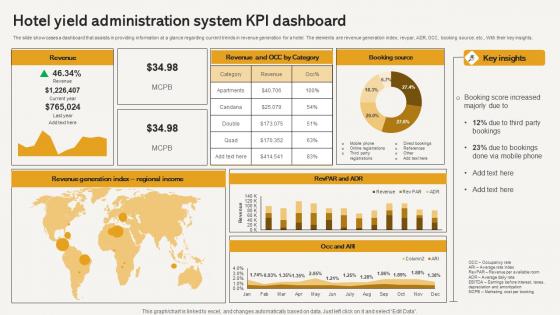
Hotel Yield Administration System Kpi Dashboard Elements Pdf
The slide showcases a dashboard that assists in providing information at a glance regarding current trends in revenue generation for a hotel. The elements are revenue generation index, revpar, ADR, OCC, booking source, etc., With their key insights. Pitch your topic with ease and precision using this Hotel Yield Administration System Kpi Dashboard Elements Pdf This layout presents information on Revenue, Booking Source, Regional Income, Key Insights It is also available for immediate download and adjustment. So, changes can be made in the color, design, graphics or any other component to create a unique layout. The slide showcases a dashboard that assists in providing information at a glance regarding current trends in revenue generation for a hotel. The elements are revenue generation index, revpar, ADR, OCC, booking source, etc., With their key insights.
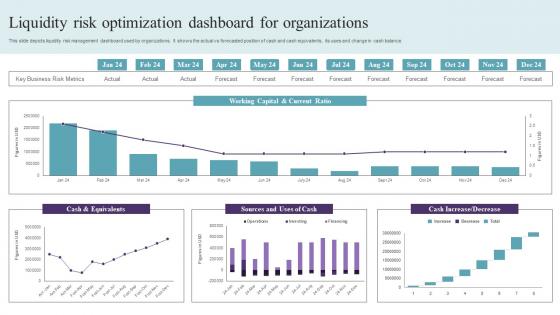
Liquidity Risk Optimization Dashboard For Organizations Graphics Pdf
This slide depicts liquidity risk management dashboard used by organizations. It shows the actual vs forecasted position of cash and cash equivalents, its uses and change in cash balance. Pitch your topic with ease and precision using this Liquidity Risk Optimization Dashboard For Organizations Graphics Pdf. This layout presents information on Cash And Equivalents, Working Capital, Current Ratio. It is also available for immediate download and adjustment. So, changes can be made in the color, design, graphics or any other component to create a unique layout. This slide depicts liquidity risk management dashboard used by organizations. It shows the actual vs forecasted position of cash and cash equivalents, its uses and change in cash balance.
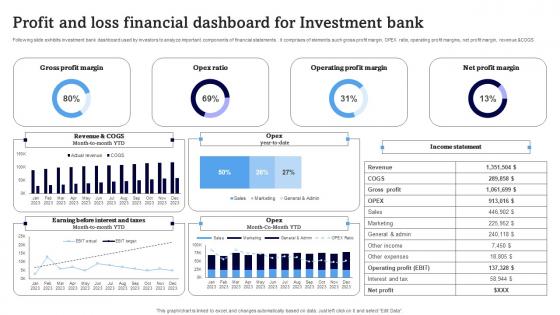
Profit And Loss Financial Dashboard For Investment Bank Download Pdf
Following slide exhibits investment bank dashboard used by investors to analyze important components of financial statements . it comprises of elements such gross profit margin, OPEX ratio, operating profit margins, net profit margin, revenue andCOGS Pitch your topic with ease and precision using this Profit And Loss Financial Dashboard For Investment Bank Download Pdf. This layout presents information on Gross Profit Margin, Opex Ratio, Operating Profit Margin. It is also available for immediate download and adjustment. So, changes can be made in the color, design, graphics or any other component to create a unique layout. Following slide exhibits investment bank dashboard used by investors to analyze important components of financial statements . it comprises of elements such gross profit margin, OPEX ratio, operating profit margins, net profit margin, revenue andCOGS
Cyber Security Risk Dashboard In Powerpoint And Google Slides Cpb
Introducing our well designed Cyber Security Risk Dashboard In Powerpoint And Google Slides Cpb. This PowerPoint design presents information on topics like Cyber Security Risk Dashboard. As it is predesigned it helps boost your confidence level. It also makes you a better presenter because of its high quality content and graphics. This PPT layout can be downloaded and used in different formats like PDF, PNG, and JPG. Not only this, it is available in both Standard Screen and Widescreen aspect ratios for your convenience. Therefore, click on the download button now to persuade and impress your audience. Our Cyber Security Risk Dashboard In Powerpoint And Google Slides Cpb are topically designed to provide an attractive backdrop to any subject. Use them to look like a presentation pro.
Security Monitoring Dashboard In Powerpoint And Google Slides Cpb
Introducing our well designed Security Monitoring Dashboard In Powerpoint And Google Slides Cpb. This PowerPoint design presents information on topics like Security Monitoring Dashboard. As it is predesigned it helps boost your confidence level. It also makes you a better presenter because of its high quality content and graphics. This PPT layout can be downloaded and used in different formats like PDF, PNG, and JPG. Not only this, it is available in both Standard Screen and Widescreen aspect ratios for your convenience. Therefore, click on the download button now to persuade and impress your audience. Our Security Monitoring Dashboard In Powerpoint And Google Slides Cpb are topically designed to provide an attractive backdrop to any subject. Use them to look like a presentation pro.
Reports Dashboards Microservices In Powerpoint And Google Slides Cpb
Presenting our innovatively designed set of slides titled Reports Dashboards Microservices In Powerpoint And Google Slides Cpb. This completely editable PowerPoint graphic exhibits Reports Dashboards Microservices that will help you convey the message impactfully. It can be accessed with Google Slides and is available in both standard screen and widescreen aspect ratios. Apart from this, you can download this well structured PowerPoint template design in different formats like PDF, JPG, and PNG. So, click the download button now to gain full access to this PPT design. Our Reports Dashboards Microservices In Powerpoint And Google Slides Cpb are topically designed to provide an attractive backdrop to any subject. Use them to look like a presentation pro.
Activity Tracking Dashboard In Powerpoint And Google Slides Cpb
Introducing our well designed Activity Tracking Dashboard In Powerpoint And Google Slides Cpb This PowerPoint design presents information on topics like Activity Tracking Dashboard As it is predesigned it helps boost your confidence level. It also makes you a better presenter because of its high quality content and graphics. This PPT layout can be downloaded and used in different formats like PDF, PNG, and JPG. Not only this, it is available in both Standard Screen and Widescreen aspect ratios for your convenience. Therefore, click on the download button now to persuade and impress your audience. Our Activity Tracking Dashboard In Powerpoint And Google Slides Cpb are topically designed to provide an attractive backdrop to any subject. Use them to look like a presentation pro.

Call Quality Dashboard Microsoft In Powerpoint And Google Slides Cpb
Introducing our well-designed Call Quality Dashboard Microsoft In Powerpoint And Google Slides Cpb. This PowerPoint design presents information on topics like Call Quality Dashboard Microsoft. As it is predesigned it helps boost your confidence level. It also makes you a better presenter because of its high-quality content and graphics. This PPT layout can be downloaded and used in different formats like PDF, PNG, and JPG. Not only this, it is available in both Standard Screen and Widescreen aspect ratios for your convenience. Therefore, click on the download button now to persuade and impress your audience. Our Call Quality Dashboard Microsoft In Powerpoint And Google Slides Cpb are topically designed to provide an attractive backdrop to any subject. Use them to look like a presentation pro.

Dashboard For Multiple Projects In Powerpoint And Google Slides Cpb
Presenting our innovatively-designed set of slides titled Dashboard For Multiple Projects In Powerpoint And Google Slides Cpb. This completely editable PowerPoint graphic exhibits Dashboard For Multiple Projects that will help you convey the message impactfully. It can be accessed with Google Slides and is available in both standard screen and widescreen aspect ratios. Apart from this, you can download this well-structured PowerPoint template design in different formats like PDF, JPG, and PNG. So, click the download button now to gain full access to this PPT design. Our Dashboard For Multiple Projects In Powerpoint And Google Slides Cpb are topically designed to provide an attractive backdrop to any subject. Use them to look like a presentation pro.

Studio Tiktok Advertising Dashboard In Powerpoint And Google Slides Cpb
Introducing our well-designed Studio Tiktok Advertising Dashboard In Powerpoint And Google Slides Cpb This PowerPoint design presents information on topics like Studio Tiktok Advertising Dashboard As it is predesigned it helps boost your confidence level. It also makes you a better presenter because of its high-quality content and graphics. This PPT layout can be downloaded and used in different formats like PDF, PNG, and JPG. Not only this, it is available in both Standard Screen and Widescreen aspect ratios for your convenience. Therefore, click on the download button now to persuade and impress your audience. Our Studio Tiktok Advertising Dashboard In Powerpoint And Google Slides Cpb are topically designed to provide an attractive backdrop to any subject. Use them to look like a presentation pro.

Complete Guide To Launch Website Analytics Dashboard To Track Performance
This Complete Guide To Launch Website Analytics Dashboard To Track Performance is perfect for any presentation, be it in front of clients or colleagues. It is a versatile and stylish solution for organizing your meetings. The Complete Guide To Launch Website Analytics Dashboard To Track Performance features a modern design for your presentation meetings. The adjustable and customizable slides provide unlimited possibilities for acing up your presentation. Slidegeeks has done all the homework before launching the product for you. So, do not wait, grab the presentation templates today Our Complete Guide To Launch Website Analytics Dashboard To Track Performance are topically designed to provide an attractive backdrop to any subject. Use them to look like a presentation pro.

Smart Home Dashboard For Appliance Monitoring Smart Grid Working
This slide represents the smart home dashboard for monitoring total electricity consumption by rooms and appliances such as lights, microwave heating, room cooling temperature, home security, television and computers. This Smart Home Dashboard For Appliance Monitoring Smart Grid Working from Slidegeeks makes it easy to present information on your topic with precision. It provides customization options, so you can make changes to the colors, design, graphics, or any other component to create a unique layout. It is also available for immediate download, so you can begin using it right away. Slidegeeks has done good research to ensure that you have everything you need to make your presentation stand out. Make a name out there for a brilliant performance. This slide represents the smart home dashboard for monitoring total electricity consumption by rooms and appliances such as lights, microwave heating, room cooling temperature, home security, television and computers.
CASB 2 0 IT CASB Performance Tracking Dashboard
This slide outlines the performance tracking dashboard for CASB deployment. The purpose of this slide is to showcase the status of various applications, IP addresses, users, machines, and web traffic. It also includes cloud discovery open alerts, risk levels, and top entities. If your project calls for a presentation, then Slidegeeks is your go-to partner because we have professionally designed, easy-to-edit templates that are perfect for any presentation. After downloading, you can easily edit CASB 2 0 IT CASB Performance Tracking Dashboard and make the changes accordingly. You can rearrange slides or fill them with different images. Check out all the handy templates This slide outlines the performance tracking dashboard for CASB deployment. The purpose of this slide is to showcase the status of various applications, IP addresses, users, machines, and web traffic. It also includes cloud discovery open alerts, risk levels, and top entities.
Banking Operations Dashboard Showcasing Deposit Incorporating Banking Operational Growth
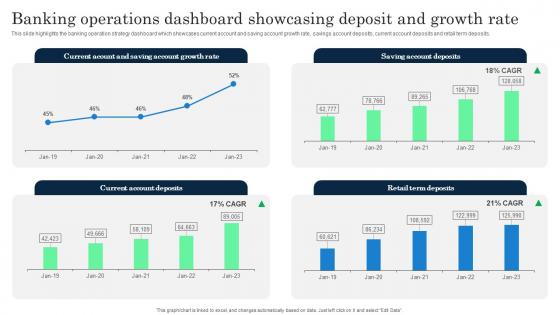
This slide highlights the banking operation strategy dashboard which showcases current account and saving account growth rate, savings account deposits, current account deposits and retail term deposits. Slidegeeks is one of the best resources for PowerPoint templates. You can download easily and regulate Banking Operations Dashboard Showcasing Deposit Incorporating Banking Operational Growth for your personal presentations from our wonderful collection. A few clicks is all it takes to discover and get the most relevant and appropriate templates. Use our Templates to add a unique zing and appeal to your presentation and meetings. All the slides are easy to edit and you can use them even for advertisement purposes. This slide highlights the banking operation strategy dashboard which showcases current account and saving account growth rate, savings account deposits, current account deposits and retail term deposits.
Product Quality Assessment KPI Dashboard Implementing Manufacturing Strategy SS V
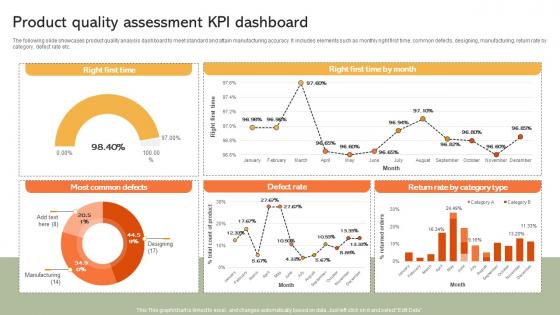
The following slide showcases product quality analysis dashboard to meet standard and attain manufacturing accuracy. It includes elements such as monthly right first time, common defects, designing, manufacturing, return rate by category, defect rate etc. Take your projects to the next level with our ultimate collection of Product Quality Assessment KPI Dashboard Implementing Manufacturing Strategy SS V. Slidegeeks has designed a range of layouts that are perfect for representing task or activity duration, keeping track of all your deadlines at a glance. Tailor these designs to your exact needs and give them a truly corporate look with your own brand colors they will make your projects stand out from the rest The following slide showcases product quality analysis dashboard to meet standard and attain manufacturing accuracy. It includes elements such as monthly right first time, common defects, designing, manufacturing, return rate by category, defect rate etc.
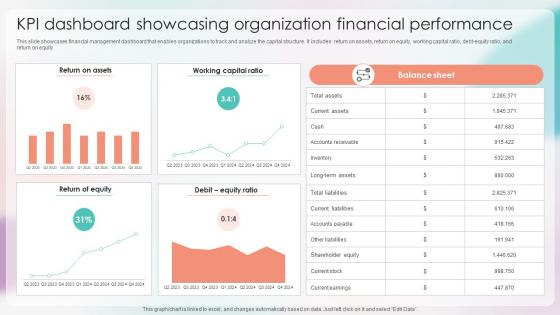
Strategies For Stabilizing Corporate KPI Dashboard Showcasing Organization Financial
This slide showcases financial management dashboard that enables organizations to track and analyze the capital structure. It includes return on assets, return on equity, working capital ratio, debt-equity ratio, and return on equity. Coming up with a presentation necessitates that the majority of the effort goes into the content and the message you intend to convey. The visuals of a PowerPoint presentation can only be effective if it supplements and supports the story that is being told. Keeping this in mind our experts created Strategies For Stabilizing Corporate KPI Dashboard Showcasing Organization Financial to reduce the time that goes into designing the presentation. This way, you can concentrate on the message while our designers take care of providing you with the right template for the situation. This slide showcases financial management dashboard that enables organizations to track and analyze the capital structure. It includes return on assets, return on equity, working capital ratio, debt-equity ratio, and return on equity.
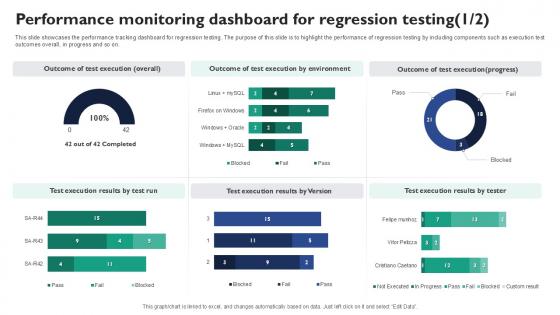
Performance Monitoring Dashboard For Corrective Regression Testing Ppt Example
This slide showcases the performance tracking dashboard for regression testing. The purpose of this slide is to highlight the performance of regression testing by including components such as execution test outcomes overall, in progress and so on. Want to ace your presentation in front of a live audience Our Performance Monitoring Dashboard For Corrective Regression Testing Ppt Example can help you do that by engaging all the users towards you. Slidegeeks experts have put their efforts and expertise into creating these impeccable powerpoint presentations so that you can communicate your ideas clearly. Moreover, all the templates are customizable, and easy-to-edit and downloadable. Use these for both personal and commercial use. This slide showcases the performance tracking dashboard for regression testing. The purpose of this slide is to highlight the performance of regression testing by including components such as execution test outcomes overall, in progress and so on.
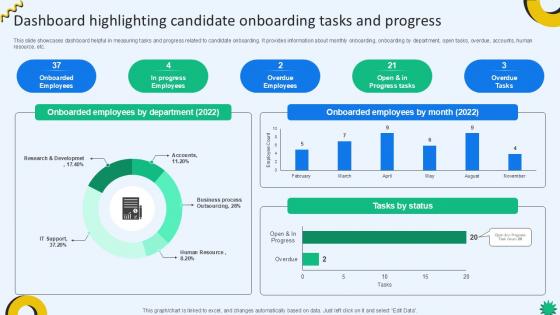
Dashboard Highlighting Candidate Cloud Recruiting Technologies PPT Sample
This slide showcases dashboard helpful in measuring tasks and progress related to candidate onboarding. It provides information about monthly onboarding, onboarding by department, open tasks, overdue, accounts, human resource, etc. Present like a pro with Dashboard Highlighting Candidate Cloud Recruiting Technologies PPT Sample. Create beautiful presentations together with your team, using our easy-to-use presentation slides. Share your ideas in real-time and make changes on the fly by downloading our templates. So whether you are in the office, on the go, or in a remote location, you can stay in sync with your team and present your ideas with confidence. With Slidegeeks presentation got a whole lot easier. Grab these presentations today. This slide showcases dashboard helpful in measuring tasks and progress related to candidate onboarding. It provides information about monthly onboarding, onboarding by department, open tasks, overdue, accounts, human resource, etc.
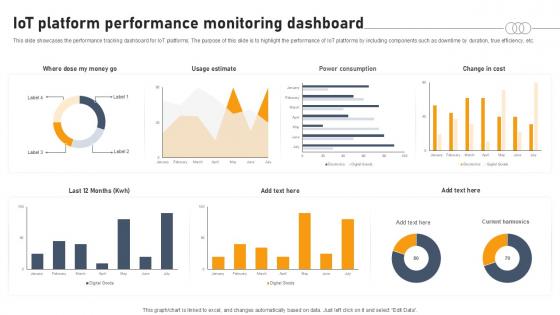
IOT Platform Performance Monitoring Dashboard Aws IOT Platform Ppt Example
This slide showcases the performance tracking dashboard for IoT platforms. The purpose of this slide is to highlight the performance of IoT platforms by including components such as downtime by duration, true efficiency, etc. Present like a pro with IOT Platform Performance Monitoring Dashboard Aws IOT Platform Ppt Example Create beautiful presentations together with your team, using our easy-to-use presentation slides. Share your ideas in real-time and make changes on the fly by downloading our templates. So whether you are in the office, on the go, or in a remote location, you can stay in sync with your team and present your ideas with confidence. With Slidegeeks presentation got a whole lot easier. Grab these presentations today. This slide showcases the performance tracking dashboard for IoT platforms. The purpose of this slide is to highlight the performance of IoT platforms by including components such as downtime by duration, true efficiency, etc.

Customer Segmentation Dashboard With Power BI Ppt Template SS
Do you have an important presentation coming up Are you looking for something that will make your presentation stand out from the rest Look no further than Customer Segmentation Dashboard With Power BI Ppt Template SS With our professional designs, you can trust that your presentation will pop and make delivering it a smooth process. And with Slidegeeks, you can trust that your presentation will be unique and memorable. So why wait Grab Customer Segmentation Dashboard With Power BI Ppt Template SS today and make your presentation stand out from the rest Our Customer Segmentation Dashboard With Power BI Ppt Template SS are topically designed to provide an attractive backdrop to any subject. Use them to look like a presentation pro.
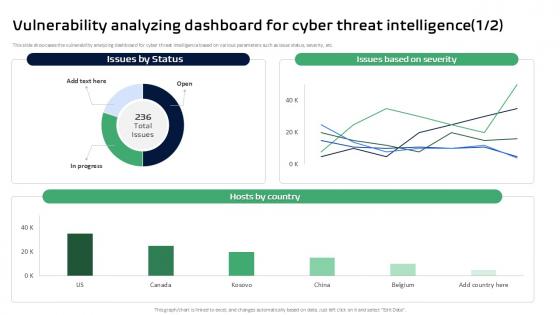
Vulnerability Analyzing Dashboard For Cyber Threat Intelligence Ppt Sample
This slide showcases the vulnerability analyzing dashboard for cyber threat intelligence based on various parameters such as issue status, severity, etc. This Vulnerability Analyzing Dashboard For Cyber Threat Intelligence Ppt Sample from Slidegeeks makes it easy to present information on your topic with precision. It provides customization options, so you can make changes to the colors, design, graphics, or any other component to create a unique layout. It is also available for immediate download, so you can begin using it right away. Slidegeeks has done good research to ensure that you have everything you need to make your presentation stand out. Make a name out there for a brilliant performance. This slide showcases the vulnerability analyzing dashboard for cyber threat intelligence based on various parameters such as issue status, severity, etc.
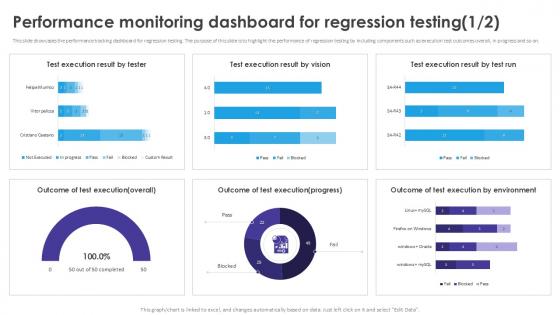
Performance Monitoring Dashboard Automated Regression Testing And Achieving PPT Example
This slide showcases the performance tracking dashboard for regression testing. The purpose of this slide is to highlight the performance of regression testing by including components such as execution test outcomes overall, in progress and so on. If your project calls for a presentation, then Slidegeeks is your go-to partner because we have professionally designed, easy-to-edit templates that are perfect for any presentation. After downloading, you can easily edit Performance Monitoring Dashboard Automated Regression Testing And Achieving PPT Example and make the changes accordingly. You can rearrange slides or fill them with different images. Check out all the handy templates This slide showcases the performance tracking dashboard for regression testing. The purpose of this slide is to highlight the performance of regression testing by including components such as execution test outcomes overall, in progress and so on.
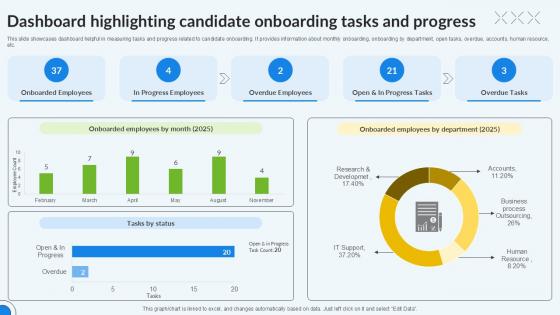
Dashboard Highlighting Candidate Enhancing Recruitment Process PPT Presentation
This slide showcases dashboard helpful in measuring tasks and progress related to candidate onboarding. It provides information about monthly onboarding, onboarding by department, open tasks, overdue, accounts, human resource, etc. Present like a pro with Dashboard Highlighting Candidate Enhancing Recruitment Process PPT Presentation. Create beautiful presentations together with your team, using our easy-to-use presentation slides. Share your ideas in real-time and make changes on the fly by downloading our templates. So whether you are in the office, on the go, or in a remote location, you can stay in sync with your team and present your ideas with confidence. With Slidegeeks presentation got a whole lot easier. Grab these presentations today. This slide showcases dashboard helpful in measuring tasks and progress related to candidate onboarding. It provides information about monthly onboarding, onboarding by department, open tasks, overdue, accounts, human resource, etc.
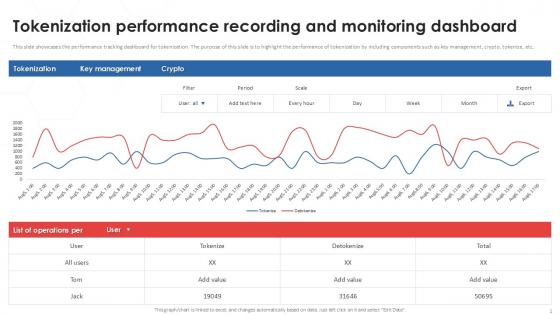
Tokenization Performance Recording And Monitoring Dashboard PPT Example
This slide showcases the performance tracking dashboard for tokenization. The purpose of this slide is to highlight the performance of tokenization by including components such as key management, crypto, tokenize, etc. Find a pre-designed and impeccable Tokenization Performance Recording And Monitoring Dashboard PPT Example. The templates can ace your presentation without additional effort. You can download these easy-to-edit presentation templates to make your presentation stand out from others. So, what are you waiting for Download the template from Slidegeeks today and give a unique touch to your presentation. This slide showcases the performance tracking dashboard for tokenization. The purpose of this slide is to highlight the performance of tokenization by including components such as key management, crypto, tokenize, etc.
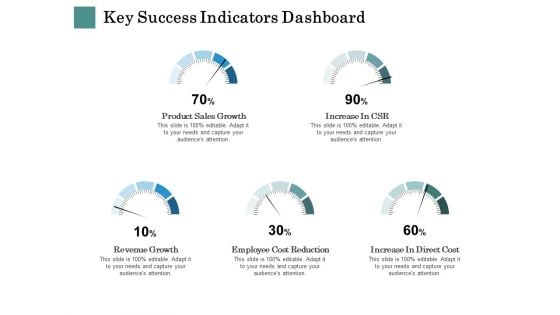
Business Strategies Key Success Indicators Dashboard Ppt Backgrounds PDF
Deliver an awe inspiring pitch with this creative business strategies key success indicators dashboard ppt backgrounds pdf bundle. Topics like revenue, growth, sales, cost, reduction can be discussed with this completely editable template. It is available for immediate download depending on the needs and requirements of the user.
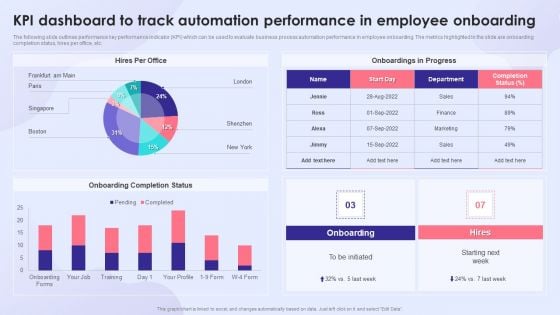
KPI Dashboard To Track Automation Performance In Employee Onboarding Introduction PDF
The following slide outlines performance key performance indicator KPI which can be used to evaluate business process automation performance in employee onboarding. The metrics highlighted in the slide are onboarding completion status, hires per office, etc. Deliver an awe inspiring pitch with this creative KPI Dashboard To Track Automation Performance In Employee Onboarding Introduction PDF bundle. Topics like Onboarding Completion Status, Onboardings In Progress, Employee Onboarding can be discussed with this completely editable template. It is available for immediate download depending on the needs and requirements of the user.
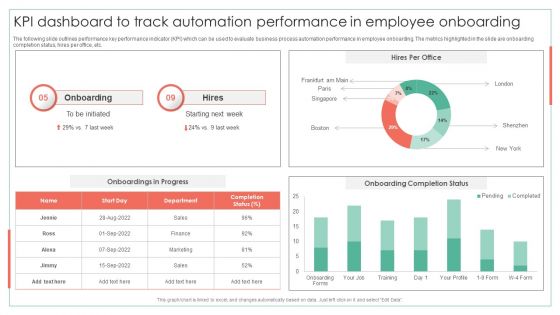
KPI Dashboard To Track Automation Performance In Employee Onboarding Achieving Operational Efficiency Download PDF
The following slide outlines performance key performance indicator KPI which can be used to evaluate business process automation performance in employee onboarding. The metrics highlighted in the slide are onboarding completion status, hires per office, etc.Deliver an awe inspiring pitch with this creative KPI Dashboard To Track Automation Performance In Employee Onboarding Achieving Operational Efficiency Download PDF bundle. Topics like Onboarding Completion, Onboarding, Onboarding Completion can be discussed with this completely editable template. It is available for immediate download depending on the needs and requirements of the user.
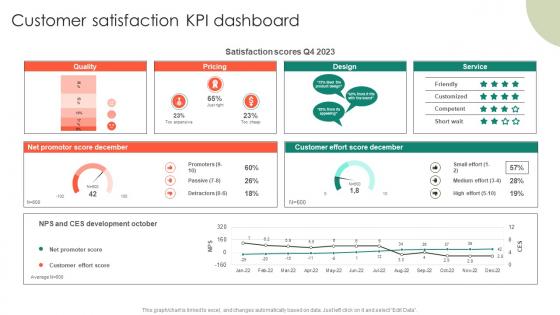
Customer Satisfaction KPI Dashboard Entrepreneurs Roadmap To Effective Demonstration Pdf
If your project calls for a presentation, then Slidegeeks is your go-to partner because we have professionally designed, easy-to-edit templates that are perfect for any presentation. After downloading, you can easily edit Customer Satisfaction KPI Dashboard Entrepreneurs Roadmap To Effective Demonstration Pdf and make the changes accordingly. You can rearrange slides or fill them with different images. Check out all the handy templates Our Customer Satisfaction KPI Dashboard Entrepreneurs Roadmap To Effective Demonstration Pdf are topically designed to provide an attractive backdrop to any subject. Use them to look like a presentation pro.

Learning And Improvement KPI Activities For Workforce Dashboard Formats Pdf
This slide provides glimpse about statistics related to progress status of training activities for employees. It includes activities, current courses status, etc. Pitch your topic with ease and precision using this Learning And Improvement KPI Activities For Workforce Dashboard Formats Pdf. This layout presents information on Learning And Improvement KPI, Workforce Dashboard, Current Courses Status. It is also available for immediate download and adjustment. So, changes can be made in the color, design, graphics or any other component to create a unique layout. This slide provides glimpse about statistics related to progress status of training activities for employees. It includes activities, current courses status, etc.
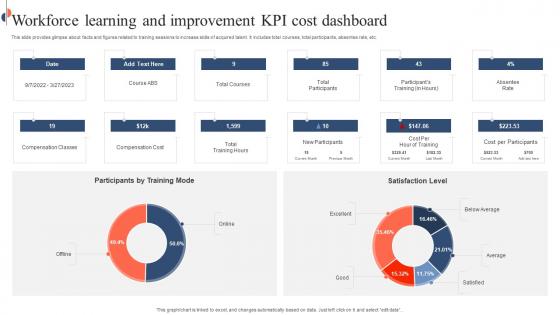
Workforce Learning And Improvement KPI Cost Dashboard Rules Pdf
This slide provides glimpse about facts and figures related to training sessions to increase skills of acquired talent. It includes total courses, total participants, absentee rate, etc. Pitch your topic with ease and precision using this Workforce Learning And Improvement KPI Cost Dashboard Rules Pdf. This layout presents information on Workforce Learning, Improvement KPI, Cost Dashboard. It is also available for immediate download and adjustment. So, changes can be made in the color, design, graphics or any other component to create a unique layout. This slide provides glimpse about facts and figures related to training sessions to increase skills of acquired talent. It includes total courses, total participants, absentee rate, etc.
Secure Web Gateway Performance Tracking Dashboard Web Threat Protection System
Want to ace your presentation in front of a live audience Our Secure Web Gateway Performance Tracking Dashboard Web Threat Protection System can help you do that by engaging all the users towards you. Slidegeeks experts have put their efforts and expertise into creating these impeccable powerpoint presentations so that you can communicate your ideas clearly. Moreover, all the templates are customizable, and easy-to-edit and downloadable. Use these for both personal and commercial use. This slide represents a dashboard to maintain the record of various functions of Secure Web Gateway. The main components are top blocked web malware, web usage trend, top web application categories, risky web
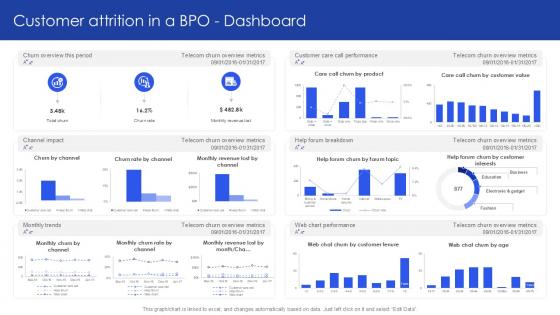
Customer Attrition In A BPO Dashboard PPT Example SS
Want to ace your presentation in front of a live audience Our Customer Attrition In A BPO Dashboard PPT Example SS can help you do that by engaging all the users towards you. Slidegeeks experts have put their efforts and expertise into creating these impeccable powerpoint presentations so that you can communicate your ideas clearly. Moreover, all the templates are customizable, and easy-to-edit and downloadable. Use these for both personal and commercial use. Our Customer Attrition In A BPO Dashboard PPT Example SS are topically designed to provide an attractive backdrop to any subject. Use them to look like a presentation pro.
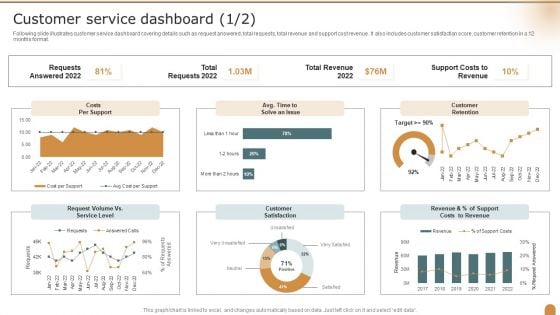
Customer Service Dashboard Company Performance Evaluation Using KPI Themes PDF
Following slide illustrates customer service dashboard covering details such as request answered, total requests, total revenue and support cost revenue. It also includes customer satisfaction score, customer retention in a 12 months format. Deliver and pitch your topic in the best possible manner with this Customer Service Dashboard Company Performance Evaluation Using KPI Themes PDF. Use them to share invaluable insights on Requests Answered, Total Revenue, Customer Retention and impress your audience. This template can be altered and modified as per your expectations. So, grab it now.
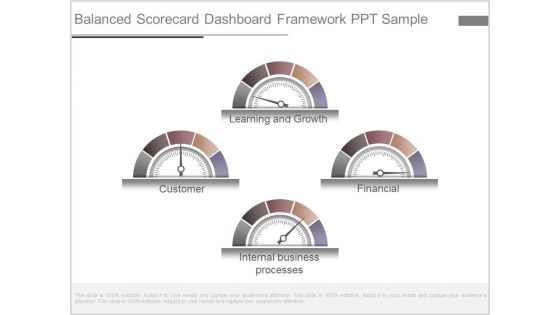
Balanced Scorecard Dashboard Framework Ppt Sample
This is a balanced scorecard dashboard framework ppt sample. This is a four stage process. The stages in this process are learning and growth, financial, internal business processes, customer.

Metrics In Project Management Planning Design Development Ppt PowerPoint Presentation Outline Show
This is a metrics in project management planning design development ppt powerpoint presentation outline show. This is a two stage process. The stages in this process are project dashboard, project kpis, project metrics.
Project Management Metrics And Variances Schedule Variance And Test Defect Ppt PowerPoint Presentation Icon Influencers
This is a project management metrics and variances schedule variance and test defect ppt powerpoint presentation icon influencers. This is a five stage process. The stages in this process are project dashboard, project kpis, project metrics.
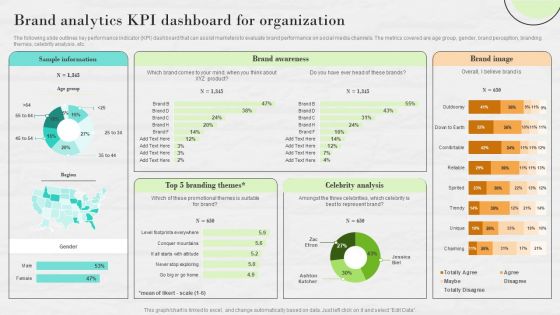
Market Research To Determine Business Opportunities Brand Analytics KPI Dashboard For Organization Inspiration PDF
The following slide outlines key performance indicator KPI dashboard that can assist marketers to evaluate brand performance on social media channels. The metrics covered are age group, gender, brand perception, branding themes, celebrity analysis, etc. There are so many reasons you need a Market Research To Determine Business Opportunities Brand Analytics KPI Dashboard For Organization Inspiration PDF. The first reason is you cannot spend time making everything from scratch, Thus, Slidegeeks has made presentation templates for you too. You can easily download these templates from our website easily.
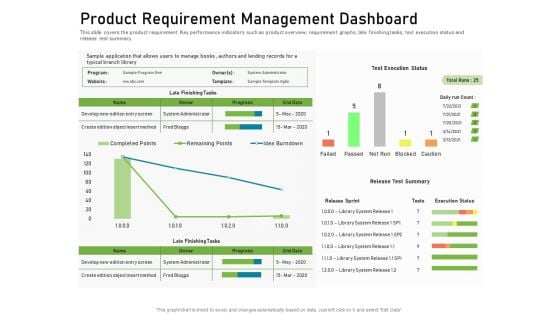
Product Requirement Management Dashboard Graphics PDF
This slide covers the product requirement Key performance indicators such as product overview, requirement graphs, late finishing tasks, text execution status and release test summary. Deliver and pitch your topic in the best possible manner with this product requirement management dashboard graphics pdf. Use them to share invaluable insights on product requirement management dashboard and impress your audience. This template can be altered and modified as per your expectations. So, grab it now.
Factory Waste Management Tracking Dashboard Inspiration PDF
This slide covers the key performance indicators for waste management including waste trucks tracker, green house gasses emissions, energy used and many more Deliver and pitch your topic in the best possible manner with this factory waste management tracking dashboard inspiration pdf. Use them to share invaluable insights on factory waste management tracking dashboard and impress your audience. This template can be altered and modified as per your expectations. So, grab it now.
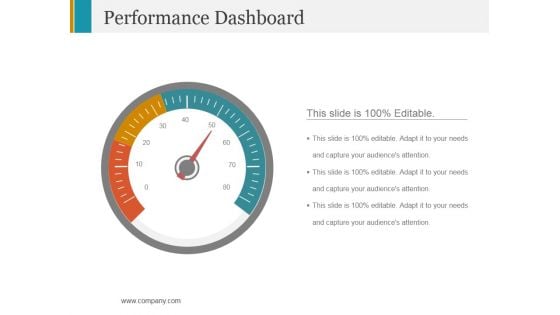
Performance Dashboard Template 1 Ppt PowerPoint Presentation Summary Example Topics
This is a performance dashboard template 1 ppt powerpoint presentation summary example topics. This is a three stage process. The stages in this process are dashboard, measurement, business, marketing.
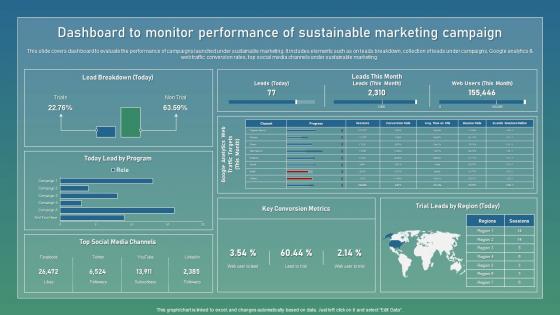
Dashboard To Monitor Performance Strategic Guide For Sustainable Download Pdf
This slide covers dashboard to evaluate the performance of campaigns launched under sustainable marketing. It includes elements such as on leads breakdown, collection of leads under campaigns, Google analytics and web traffic conversion rates, top social media channels under sustainable marketing. Whether you have daily or monthly meetings, a brilliant presentation is necessary. Dashboard To Monitor Performance Strategic Guide For Sustainable Download Pdf can be your best option for delivering a presentation. Represent everything in detail using Dashboard To Monitor Performance Strategic Guide For Sustainable Download Pdf and make yourself stand out in meetings. The template is versatile and follows a structure that will cater to your requirements. All the templates prepared by Slidegeeks are easy to download and edit. Our research experts have taken care of the corporate themes as well. So, give it a try and see the results. This slide covers dashboard to evaluate the performance of campaigns launched under sustainable marketing. It includes elements such as on leads breakdown, collection of leads under campaigns, Google analytics and web traffic conversion rates, top social media channels under sustainable marketing.
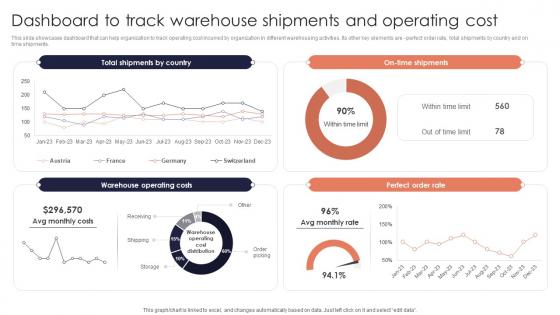
Dashboard Track Warehouse Minimizing Inventory Wastage Through Warehouse Designs Pdf
This slide showcases dashboard that can help organization to track operating cost incurred by organization in different warehousing activities. Its other key elements are perfect order rate, total shipments by country and on time shipments. Do you have to make sure that everyone on your team knows about any specific topic I yes, then you should give Dashboard Track Warehouse Minimizing Inventory Wastage Through Warehouse Designs Pdf a try. Our experts have put a lot of knowledge and effort into creating this impeccable Dashboard Track Warehouse Minimizing Inventory Wastage Through Warehouse Designs Pdf. You can use this template for your upcoming presentations, as the slides are perfect to represent even the tiniest detail. You can download these templates from the Slidegeeks website and these are easy to edit. So grab these today This slide showcases dashboard that can help organization to track operating cost incurred by organization in different warehousing activities. Its other key elements are perfect order rate, total shipments by country and on time shipments.
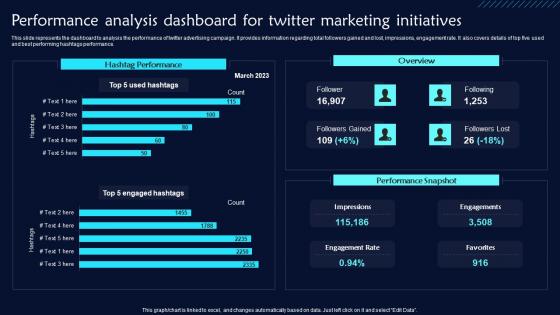
Performance Analysis Dashboard For Twitter Twitter Promotional Techniques Clipart Pdf
This slide represents the dashboard to analysis the performance of twitter advertising campaign. It provides information regarding total followers gained and lost, impressions, engagement rate. It also covers details of top five used and best performing hashtags performance. Crafting an eye-catching presentation has never been more straightforward. Let your presentation shine with this tasteful yet straightforward Performance Analysis Dashboard For Twitter Twitter Promotional Techniques Clipart Pdf template. It offers a minimalistic and classy look that is great for making a statement. The colors have been employed intelligently to add a bit of playfulness while still remaining professional. Construct the ideal Performance Analysis Dashboard For Twitter Twitter Promotional Techniques Clipart Pdf that effortlessly grabs the attention of your audience Begin now and be certain to wow your customers This slide represents the dashboard to analysis the performance of twitter advertising campaign. It provides information regarding total followers gained and lost, impressions, engagement rate. It also covers details of top five used and best performing hashtags performance.
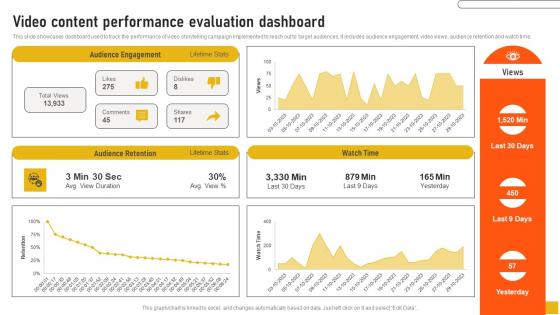
Video Content Performance Evaluation Dashboard Comprehensive Guide Clipart Pdf
This slide showcases dashboard used to track the performance of video storytelling campaign implemented to reach out to target audiences. It includes audience engagement, video views, audience retention and watch time. Here you can discover an assortment of the finest PowerPoint and Google Slides templates. With these templates, you can create presentations for a variety of purposes while simultaneously providing your audience with an eye-catching visual experience. Download Video Content Performance Evaluation Dashboard Comprehensive Guide Clipart Pdf to deliver an impeccable presentation. These templates will make your job of preparing presentations much quicker, yet still, maintain a high level of quality. Slidegeeks has experienced researchers who prepare these templates and write high-quality content for you. Later on, you can personalize the content by editing the Video Content Performance Evaluation Dashboard Comprehensive Guide Clipart Pdf This slide showcases dashboard used to track the performance of video storytelling campaign implemented to reach out to target audiences. It includes audience engagement, video views, audience retention and watch time.
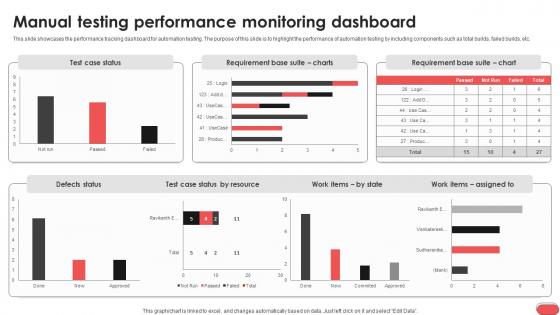
Manual Testing Performance Monitoring Dashboard Gray Box Testing Best Practices
This slide showcases the performance tracking dashboard for automation testing. The purpose of this slide is to highlight the performance of automation testing by including components such as total builds, failed builds, etc. Formulating a presentation can take up a lot of effort and time, so the content and message should always be the primary focus. The visuals of the PowerPoint can enhance the presenters message, so our Manual Testing Performance Monitoring Dashboard Gray Box Testing Best Practices was created to help save time. Instead of worrying about the design, the presenter can concentrate on the message while our designers work on creating the ideal templates for whatever situation is needed. Slidegeeks has experts for everything from amazing designs to valuable content, we have put everything into Manual Testing Performance Monitoring Dashboard Gray Box Testing Best Practices This slide showcases the performance tracking dashboard for automation testing. The purpose of this slide is to highlight the performance of automation testing by including components such as total builds, failed builds, etc.
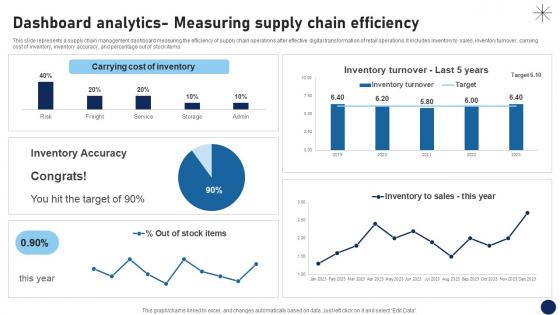
Dashboard Analytics Measuring Supply Chain Efficiency DT SS V
This slide represents a supply chain management dashboard measuring the efficiency of supply chain operations after effective digital transformation of retail operations. It includes inventory to sales, inventory turnover, carrying cost of inventory, inventory accuracy, and percentage out of stock items.If you are looking for a format to display your unique thoughts, then the professionally designed Dashboard Analytics Measuring Supply Chain Efficiency DT SS V is the one for you. You can use it as a Google Slides template or a PowerPoint template. Incorporate impressive visuals, symbols, images, and other charts. Modify or reorganize the text boxes as you desire. Experiment with shade schemes and font pairings. Alter, share or cooperate with other people on your work. Download Dashboard Analytics Measuring Supply Chain Efficiency DT SS V and find out how to give a successful presentation. Present a perfect display to your team and make your presentation unforgettable. This slide represents a supply chain management dashboard measuring the efficiency of supply chain operations after effective digital transformation of retail operations. It includes inventory to sales, inventory turnover, carrying cost of inventory, inventory accuracy, and percentage out of stock items.
Green Cloud Computing Performance Tracking Dashboard Eco Friendly Computing IT
This slide depicts the performance tracking dashboard for green cloud computing. This slide aims to showcase the performance tracking report of green cloud computing by covering parameters such as Power Use Effectiveness PUE, high-density zone, history, consumption, and Average Propensity to Consume APC consumption.If you are looking for a format to display your unique thoughts, then the professionally designed Green Cloud Computing Performance Tracking Dashboard Eco Friendly Computing IT is the one for you. You can use it as a Google Slides template or a PowerPoint template. Incorporate impressive visuals, symbols, images, and other charts. Modify or reorganize the text boxes as you desire. Experiment with shade schemes and font pairings. Alter, share or cooperate with other people on your work. Download Green Cloud Computing Performance Tracking Dashboard Eco Friendly Computing IT and find out how to give a successful presentation. Present a perfect display to your team and make your presentation unforgettable. This slide depicts the performance tracking dashboard for green cloud computing. This slide aims to showcase the performance tracking report of green cloud computing by covering parameters such as Power Use Effectiveness ,PUE, high-density zone, history, consumption, and Average Propensity to Consume ,APC consumption.
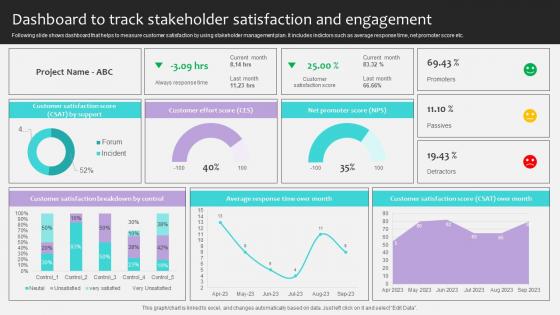
Project Stakeholders Management Dashboard To Track Stakeholder Satisfaction Ppt Powerpoint
Following slide shows dashboard that helps to measure customer satisfaction by using stakeholder management plan. It includes indictors such as average response time, net promoter score etc. If you are looking for a format to display your unique thoughts, then the professionally designed Project Stakeholders Management Dashboard To Track Stakeholder Satisfaction Ppt Powerpoint is the one for you. You can use it as a Google Slides template or a PowerPoint template. Incorporate impressive visuals, symbols, images, and other charts. Modify or reorganize the text boxes as you desire. Experiment with shade schemes and font pairings. Alter, share or cooperate with other people on your work. Download Project Stakeholders Management Dashboard To Track Stakeholder Satisfaction Ppt Powerpoint and find out how to give a successful presentation. Present a perfect display to your team and make your presentation unforgettable. Following slide shows dashboard that helps to measure customer satisfaction by using stakeholder management plan. It includes indictors such as average response time, net promoter score etc.
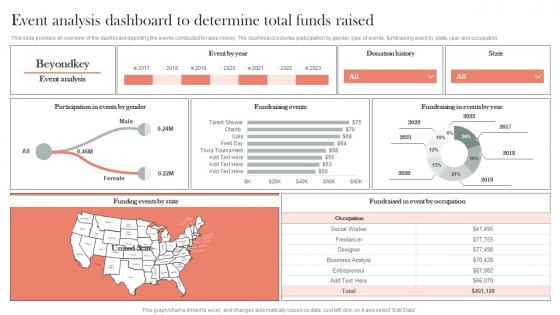
Event Analysis Dashboard To Determine Total Funds Raised Efficient Nonprofit Marketing Clipart Pdf
This slide provides an overview of the dashboard depicting the events conducted to raise money. The dashboard includes participation by gender, type of events, fundraising event by state, year and occupation.This Event Analysis Dashboard To Determine Total Funds Raised Efficient Nonprofit Marketing Clipart Pdf is perfect for any presentation, be it in front of clients or colleagues. It is a versatile and stylish solution for organizing your meetings. The Event Analysis Dashboard To Determine Total Funds Raised Efficient Nonprofit Marketing Clipart Pdf features a modern design for your presentation meetings. The adjustable and customizable slides provide unlimited possibilities for acing up your presentation. Slidegeeks has done all the homework before launching the product for you. So, do not wait, grab the presentation templates today This slide provides an overview of the dashboard depicting the events conducted to raise money. The dashboard includes participation by gender, type of events, fundraising event by state, year and occupation.

Predictive Maintained Dashboard To Determine Engine Details Optimizing Inventory Management IoT SS V
This slide provides an overview of the predictive maintenance dashboard used to track engine status. The dashboard includes normal, warning and critical engines, optimal condition, etc. Explore a selection of the finest Predictive Maintained Dashboard To Determine Engine Details Optimizing Inventory Management IoT SS V here. With a plethora of professionally designed and pre-made slide templates, you can quickly and easily find the right one for your upcoming presentation. You can use our Predictive Maintained Dashboard To Determine Engine Details Optimizing Inventory Management IoT SS V to effectively convey your message to a wider audience. Slidegeeks has done a lot of research before preparing these presentation templates. The content can be personalized and the slides are highly editable. Grab templates today from Slidegeeks. This slide provides an overview of the predictive maintenance dashboard used to track engine status. The dashboard includes normal, warning and critical engines, optimal condition, etc.


 Continue with Email

 Home
Home


