Snapshot
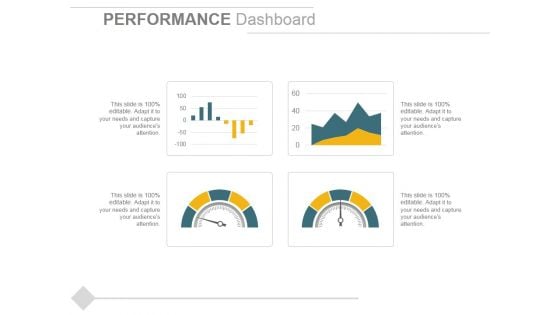
Performance Dashboard Template 2 Ppt PowerPoint Presentation Show Backgrounds
This is a performance dashboard template 2 ppt powerpoint presentation show backgrounds. This is a four stage process. The stages in this process are performance dashboard, business, marketing, management, finance.
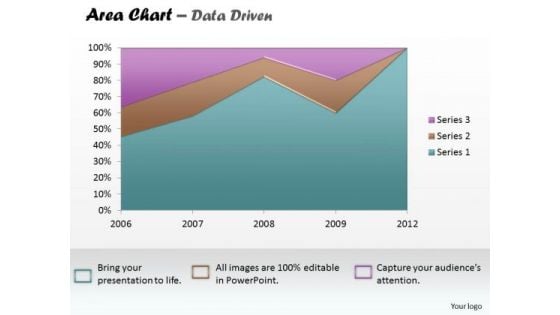
Data Analysis Excel Business Reporting Area Chart PowerPoint Templates
Establish The Dominance Of Your Ideas. Our data analysis excel business reporting area chart Powerpoint Templates Will Put Them On Top.
Key Team Members KPI Metrics And Dashboards Ppt Slides Objects PDF
Presenting this set of slides with name key team members kpi metrics and dashboards ppt slides objects pdf. This is a two stage process. The stages in this process are kpi metrics, dashboard metrics. This is a completely editable PowerPoint presentation and is available for immediate download. Download now and impress your audience.
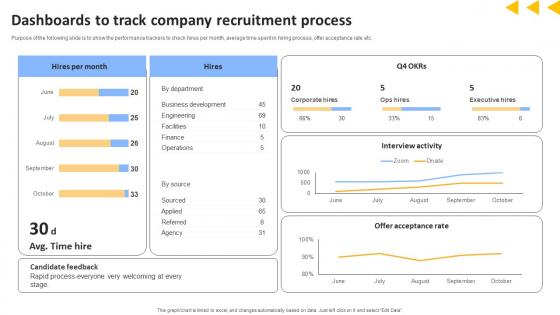
Workforce Productivity Improvement Dashboards To Track Company Recruitment Process Themes Pdf
Purpose of the following slide is to show the performance trackers to check hires per month, average time spent in hiring process, offer acceptance rate etc. Formulating a presentation can take up a lot of effort and time, so the content and message should always be the primary focus. The visuals of the PowerPoint can enhance the presenters message, so our Workforce Productivity Improvement Dashboards To Track Company Recruitment Process Themes Pdf was created to help save time. Instead of worrying about the design, the presenter can concentrate on the message while our designers work on creating the ideal templates for whatever situation is needed. Slidegeeks has experts for everything from amazing designs to valuable content, we have put everything into Workforce Productivity Improvement Dashboards To Track Company Recruitment Process Themes Pdf Purpose of the following slide is to show the performance trackers to check hires per month, average time spent in hiring process, offer acceptance rate etc.
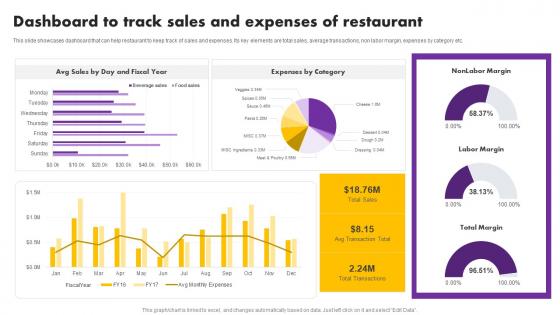
Digital And Traditional Marketing Methods Dashboard To Track Sales And Expenses Background Pdf
This slide showcases email marketing campaign that can help restaurant to promote food and services. These campaigns can help to increase he online and foot traffic of restaurant. Do you have an important presentation coming up Are you looking for something that will make your presentation stand out from the rest Look no further than Digital And Traditional Marketing Methods Dashboard To Track Sales And Expenses Background Pdf. With our professional designs, you can trust that your presentation will pop and make delivering it a smooth process. And with Slidegeeks, you can trust that your presentation will be unique and memorable. So why wait Grab Digital And Traditional Marketing Methods Dashboard To Track Sales And Expenses Background Pdf today and make your presentation stand out from the rest This slide showcases email marketing campaign that can help restaurant to promote food and services. These campaigns can help to increase he online and foot traffic of restaurant
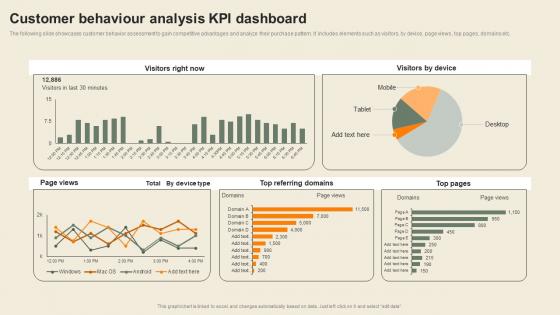
Customer Behaviour Analysis KPI Dashboard Usability Of CDP Software Tool Graphics Pdf
The following slide showcases customer behavior assessment to gain competitive advantages and analyze their purchase pattern. It includes elements such as visitors, by device, page views, top pages, domains etc. Do you have an important presentation coming up Are you looking for something that will make your presentation stand out from the rest Look no further than Customer Behaviour Analysis KPI Dashboard Usability Of CDP Software Tool Graphics Pdf. With our professional designs, you can trust that your presentation will pop and make delivering it a smooth process. And with Slidegeeks, you can trust that your presentation will be unique and memorable. So why wait Grab Customer Behaviour Analysis KPI Dashboard Usability Of CDP Software Tool Graphics Pdf today and make your presentation stand out from the rest The following slide showcases customer behavior assessment to gain competitive advantages and analyze their purchase pattern. It includes elements such as visitors, by device, page views, top pages, domains etc.
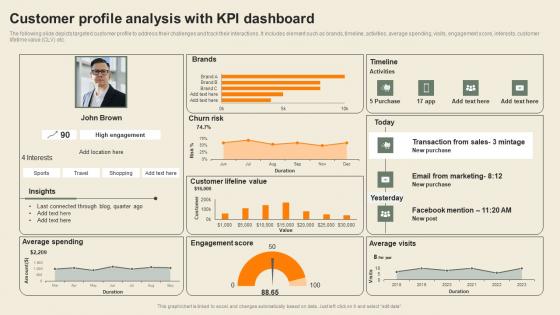
Customer Profile Analysis With KPI Dashboard Usability Of CDP Software Tool Ideas Pdf
The following slide depicts targeted customer profile to address their challenges and track their interactions. It includes element such as brands, timeline, activities, average spending, visits, engagement score, interests, customer lifetime value CLV etc. Crafting an eye-catching presentation has never been more straightforward. Let your presentation shine with this tasteful yet straightforward Customer Profile Analysis With KPI Dashboard Usability Of CDP Software Tool Ideas Pdf template. It offers a minimalistic and classy look that is great for making a statement. The colors have been employed intelligently to add a bit of playfulness while still remaining professional. Construct the ideal Customer Profile Analysis With KPI Dashboard Usability Of CDP Software Tool Ideas Pdf that effortlessly grabs the attention of your audience Begin now and be certain to wow your customers The following slide depicts targeted customer profile to address their challenges and track their interactions. It includes element such as brands, timeline, activities, average spending, visits, engagement score, interests, customer lifetime value CLV etc.
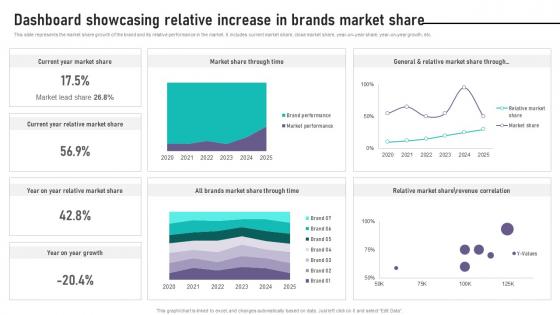
Brand Equity Management To Raise Dashboard Showcasing Relative Increase In Brands
This slide represents the market share growth of the brand and its relative performance in the market. It includes current market share, close market share, year-on-year share, year-on-year growth, etc. Crafting an eye-catching presentation has never been more straightforward. Let your presentation shine with this tasteful yet straightforward Brand Equity Management To Raise Dashboard Showcasing Relative Increase In Brands template. It offers a minimalistic and classy look that is great for making a statement. The colors have been employed intelligently to add a bit of playfulness while still remaining professional. Construct the ideal Brand Equity Management To Raise Dashboard Showcasing Relative Increase In Brands that effortlessly grabs the attention of your audience Begin now and be certain to wow your customers This slide represents the market share growth of the brand and its relative performance in the market. It includes current market share, close market share, year-on-year share, year-on-year growth, etc.
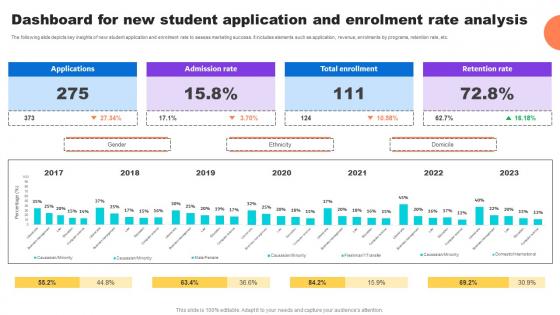
Dashboard For New Student Application And Enrolment Key Step To Implementation University Strategy SS V
The following slide depicts key insights of new student application and enrolment rate to assess marketing success. It includes elements such as application, revenue, enrolments by programs, retention rate, etc.Crafting an eye-catching presentation has never been more straightforward. Let your presentation shine with this tasteful yet straightforward Dashboard For New Student Application And Enrolment Key Step To Implementation University Strategy SS V template. It offers a minimalistic and classy look that is great for making a statement. The colors have been employed intelligently to add a bit of playfulness while still remaining professional. Construct the ideal Dashboard For New Student Application And Enrolment Key Step To Implementation University Strategy SS V that effortlessly grabs the attention of your audience Begin now and be certain to wow your customers The following slide depicts key insights of new student application and enrolment rate to assess marketing success. It includes elements such as application, revenue, enrolments by programs, retention rate, etc.
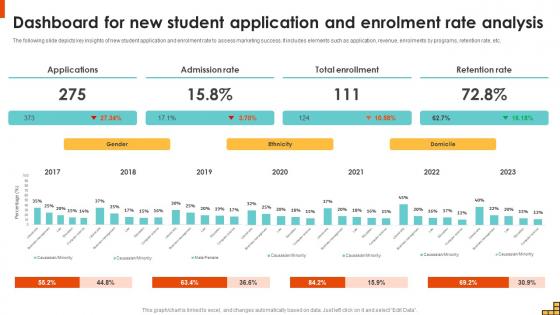
Dashboard For New Student Application And Enrolment Running Marketing Campaigns Strategy SS V
The following slide depicts key insights of new student application and enrolment rate to assess marketing success. It includes elements such as application, revenue, enrolments by programs, retention rate, etc. Crafting an eye-catching presentation has never been more straightforward. Let your presentation shine with this tasteful yet straightforward Dashboard For New Student Application And Enrolment Running Marketing Campaigns Strategy SS V template. It offers a minimalistic and classy look that is great for making a statement. The colors have been employed intelligently to add a bit of playfulness while still remaining professional. Construct the ideal Dashboard For New Student Application And Enrolment Running Marketing Campaigns Strategy SS V that effortlessly grabs the attention of your audience Begin now and be certain to wow your customers The following slide depicts key insights of new student application and enrolment rate to assess marketing success. It includes elements such as application, revenue, enrolments by programs, retention rate, etc.
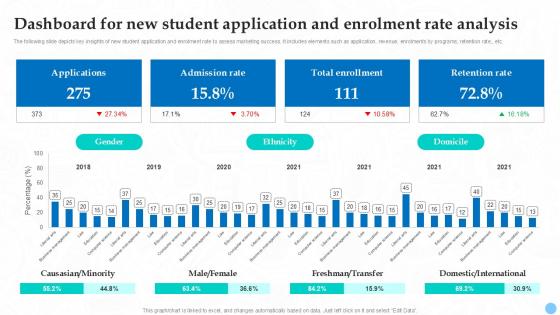
Dashboard For New Student Application Higher Education Ppt Sample Strategy SS V
The following slide depicts key insights of new student application and enrolment rate to assess marketing success. It includes elements such as application, revenue, enrolments by programs, retention rate, etc. Crafting an eye-catching presentation has never been more straightforward. Let your presentation shine with this tasteful yet straightforward Dashboard For New Student Application Higher Education Ppt Sample Strategy SS V template. It offers a minimalistic and classy look that is great for making a statement. The colors have been employed intelligently to add a bit of playfulness while still remaining professional. Construct the ideal Dashboard For New Student Application Higher Education Ppt Sample Strategy SS V that effortlessly grabs the attention of your audience Begin now and be certain to wow your customers The following slide depicts key insights of new student application and enrolment rate to assess marketing success. It includes elements such as application, revenue, enrolments by programs, retention rate, etc.
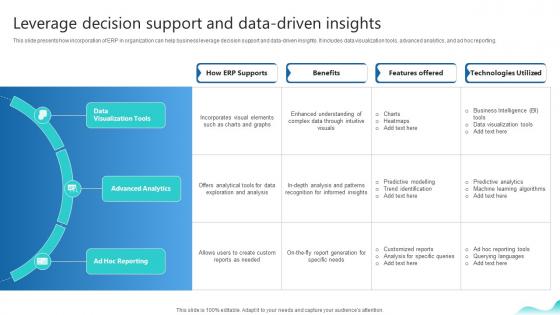
Leverage Decision Support And Data Driven Insights Erp And Digital Transformation For Maximizing DT SS V
This slide presents how incorporation of ERP in organization can help business leverage decision support and data-driven insights. It includes data visualization tools, advanced analytics, and ad hoc reporting.If you are looking for a format to display your unique thoughts, then the professionally designed Leverage Decision Support And Data Driven Insights Erp And Digital Transformation For Maximizing DT SS V is the one for you. You can use it as a Google Slides template or a PowerPoint template. Incorporate impressive visuals, symbols, images, and other charts. Modify or reorganize the text boxes as you desire. Experiment with shade schemes and font pairings. Alter, share or cooperate with other people on your work. Download Leverage Decision Support And Data Driven Insights Erp And Digital Transformation For Maximizing DT SS V and find out how to give a successful presentation. Present a perfect display to your team and make your presentation unforgettable. This slide presents how incorporation of ERP in organization can help business leverage decision support and data-driven insights. It includes data visualization tools, advanced analytics, and ad hoc reporting.
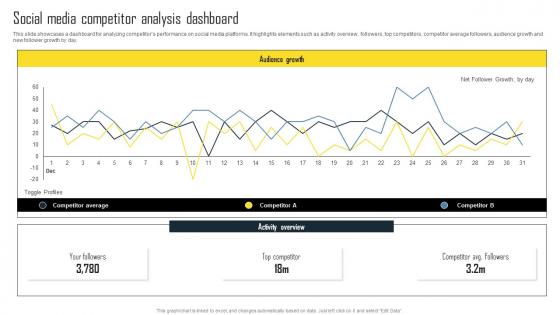
Social Media Competitor Analysis Dashboard Efficient Plan For Conducting Competitor Microsoft Pdf
This slide showcases a dashboard for analyzing competitors performance on social media platforms. It highlights elements such as activity overview, followers, top competitors, competitor average followers, audience growth and new follower growth by day. Are you in need of a template that can accommodate all of your creative concepts This one is crafted professionally and can be altered to fit any style. Use it with Google Slides or PowerPoint. Include striking photographs, symbols, depictions, and other visuals. Fill, move around, or remove text boxes as desired. Test out color palettes and font mixtures. Edit and save your work, or work with colleagues. Download Social Media Competitor Analysis Dashboard Efficient Plan For Conducting Competitor Microsoft Pdf and observe how to make your presentation outstanding. Give an impeccable presentation to your group and make your presentation unforgettable. This slide showcases a dashboard for analyzing competitors performance on social media platforms. It highlights elements such as activity overview, followers, top competitors, competitor average followers, audience growth and new follower growth by day.
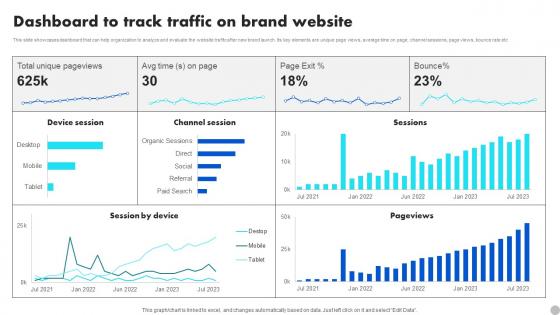
Dashboard To Track Traffic On Brand Website Brand Diversification Approach Rules Pdf
This slide showcases dashboard that can help organization to analyze and evaluate the website traffic after new brand launch. Its key elements are unique page views, average time on page, channel sessions, page views, bounce rate etc. Are you in need of a template that can accommodate all of your creative concepts This one is crafted professionally and can be altered to fit any style. Use it with Google Slides or PowerPoint. Include striking photographs, symbols, depictions, and other visuals. Fill, move around, or remove text boxes as desired. Test out color palettes and font mixtures. Edit and save your work, or work with colleagues. Download Dashboard To Track Traffic On Brand Website Brand Diversification Approach Rules Pdf and observe how to make your presentation outstanding. Give an impeccable presentation to your group and make your presentation unforgettable. This slide showcases dashboard that can help organization to analyze and evaluate the website traffic after new brand launch. Its key elements are unique page views, average time on page, channel sessions, page views, bounce rate etc.
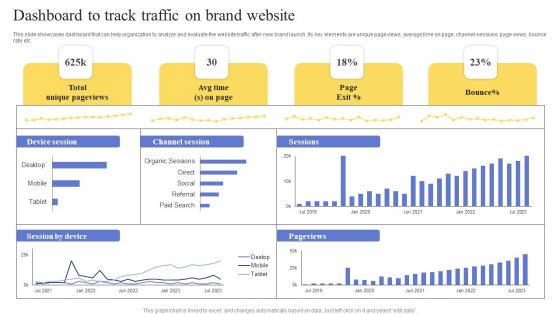
Dashboard To Track Traffic On Brand Website Maximizing Revenue Using Professional Pdf
This slide showcases dashboard that can help organization to analyze and evaluate the website traffic after new brand launch. Its key elements are unique page views, average time on page, channel sessions, page views, bounce rate etc. Are you in need of a template that can accommodate all of your creative concepts This one is crafted professionally and can be altered to fit any style. Use it with Google Slides or PowerPoint. Include striking photographs, symbols, depictions, and other visuals. Fill, move around, or remove text boxes as desired. Test out color palettes and font mixtures. Edit and save your work, or work with colleagues. Download Dashboard To Track Traffic On Brand Website Maximizing Revenue Using Professional Pdf and observe how to make your presentation outstanding. Give an impeccable presentation to your group and make your presentation unforgettable. This slide showcases dashboard that can help organization to analyze and evaluate the website traffic after new brand launch. Its key elements are unique page views, average time on page, channel sessions, page views, bounce rate etc.
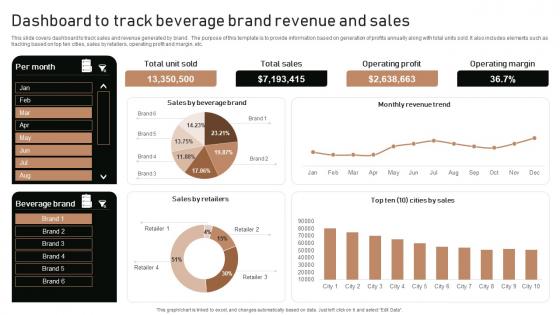
Execution Of Product Lifecycle Dashboard To Track Beverage Brand Revenue And Sales Ideas Pdf
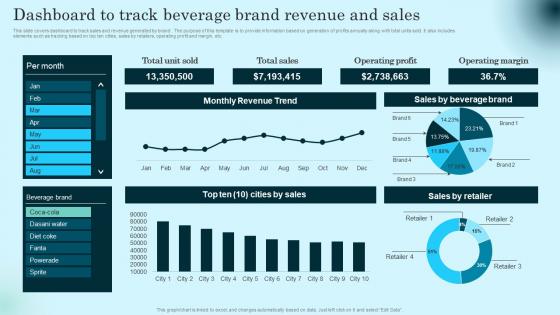
This slide covers dashboard to track sales and revenue generated by brand . The purpose of this template is to provide information based on generation of profits annually along with total units sold. It also includes elements such as tracking based on top ten cities, sales by retailers, operating profit and margin, etc. From laying roadmaps to briefing everything in detail, our templates are perfect for you. You can set the stage with your presentation slides. All you have to do is download these easy-to-edit and customizable templates. Execution Of Product Lifecycle Dashboard To Track Beverage Brand Revenue And Sales Ideas Pdf will help you deliver an outstanding performance that everyone would remember and praise you for. Do download this presentation today. This slide covers dashboard to track sales and revenue generated by brand . The purpose of this template is to provide information based on generation of profits annually along with total units sold. It also includes elements such as tracking based on top ten cities, sales by retailers, operating profit and margin, etc.
Dashboard To Track Beverage Brand Revenue Comprehensive Guide To Product Lifecycle Graphics Pdf
This slide covers dashboard to track sales and revenue generated by brand . The purpose of this template is to provide information based on generation of profits annually along with total units sold. It also includes elements such as tracking based on top ten cities, sales by retailers, operating profit and margin, etc. Present like a pro with Dashboard To Track Beverage Brand Revenue Comprehensive Guide To Product Lifecycle Graphics Pdf Create beautiful presentations together with your team, using our easy to use presentation slides. Share your ideas in real time and make changes on the fly by downloading our templates. So whether you are in the office, on the go, or in a remote location, you can stay in sync with your team and present your ideas with confidence. With Slidegeeks presentation got a whole lot easier. Grab these presentations today. This slide covers dashboard to track sales and revenue generated by brand . The purpose of this template is to provide information based on generation of profits annually along with total units sold. It also includes elements such as tracking based on top ten cities, sales by retailers, operating profit and margin, etc.
Dashboard To Measure Workflow Performance Post Embracing Robotic Process Portrait PDF
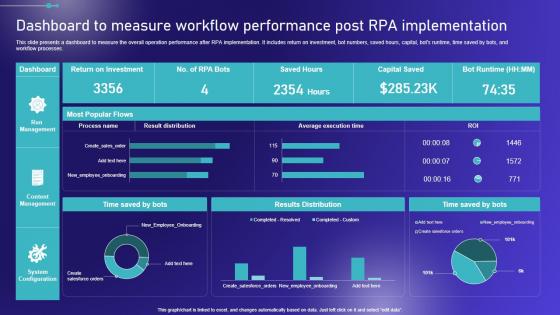
This slide presents a dashboard to measure the overall operation performance after RPA implementation. It includes return on investment, bot numbers, saved hours, capital, bots runtime, time saved by bots, and workflow processes. Are you in need of a template that can accommodate all of your creative concepts This one is crafted professionally and can be altered to fit any style. Use it with Google Slides or PowerPoint. Include striking photographs, symbols, depictions, and other visuals. Fill, move around, or remove text boxes as desired. Test out color palettes and font mixtures. Edit and save your work, or work with colleagues. Download Dashboard To Measure Workflow Performance Post Embracing Robotic Process Portrait PDF and observe how to make your presentation outstanding. Give an impeccable presentation to your group and make your presentation unforgettable. This slide presents a dashboard to measure the overall operation performance after RPA implementation. It includes return on investment, bot numbers, saved hours, capital, bots runtime, time saved by bots, and workflow processes.
Dashboard To Track Traffic On Brand Website Strategic Marketing Plan Structure PDF
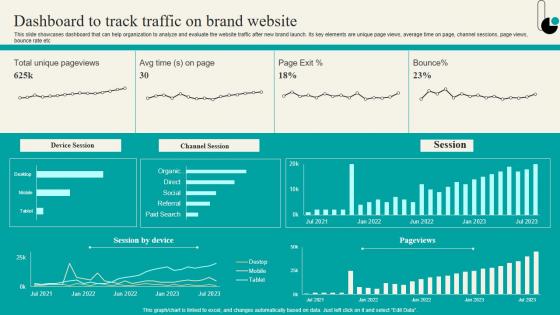
This slide showcases dashboard that can help organization to analyze and evaluate the website traffic after new brand launch. Its key elements are unique page views, average time on page, channel sessions, page views, bounce rate etc. Are you in need of a template that can accommodate all of your creative concepts This one is crafted professionally and can be altered to fit any style. Use it with Google Slides or PowerPoint. Include striking photographs, symbols, depictions, and other visuals. Fill, move around, or remove text boxes as desired. Test out color palettes and font mixtures. Edit and save your work, or work with colleagues. Download Dashboard To Track Traffic On Brand Website Strategic Marketing Plan Structure PDF and observe how to make your presentation outstanding. Give an impeccable presentation to your group and make your presentation unforgettable. This slide showcases dashboard that can help organization to analyze and evaluate the website traffic after new brand launch. Its key elements are unique page views, average time on page, channel sessions, page views, bounce rate etc.
Dashboard To Track Traffic On Brand Website Launching New Product Brand Sample Pdf
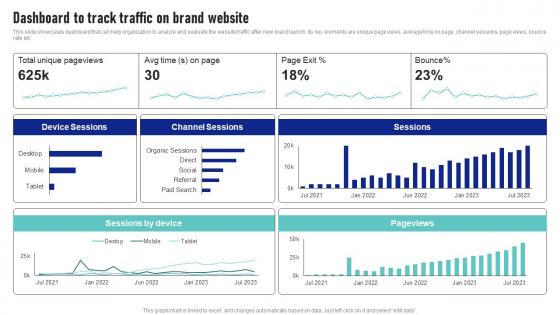
This slide showcases dashboard that can help organization to analyze and evaluate the website traffic after new brand launch. Its key elements are unique page views, average time on page, channel sessions, page views, bounce rate etc Are you in need of a template that can accommodate all of your creative concepts This one is crafted professionally and can be altered to fit any style. Use it with Google Slides or PowerPoint. Include striking photographs, symbols, depictions, and other visuals. Fill, move around, or remove text boxes as desired. Test out color palettes and font mixtures. Edit and save your work, or work with colleagues. Download Dashboard To Track Traffic On Brand Website Launching New Product Brand Sample Pdf and observe how to make your presentation outstanding. Give an impeccable presentation to your group and make your presentation unforgettable. This slide showcases dashboard that can help organization to analyze and evaluate the website traffic after new brand launch. Its key elements are unique page views, average time on page, channel sessions, page views, bounce rate etc
SD Wan Network Performance Tracking Dashboard Wide Area Network Services Portrait Pdf
This slide represents the SD-WAN network performance tracking dashboard. The purpose of this slide is to demonstrate the performance of the SD-WAN network. The main components include control status, site health, transport interface distribution, WAN edge inventory, edge health, and so on. Slidegeeks has constructed SD Wan Network Performance Tracking Dashboard Wide Area Network Services Portrait Pdf after conducting extensive research and examination. These presentation templates are constantly being generated and modified based on user preferences and critiques from editors. Here, you will find the most attractive templates for a range of purposes while taking into account ratings and remarks from users regarding the content. This is an excellent jumping-off point to explore our content and will give new users an insight into our top-notch PowerPoint Templates. This slide represents the SD-WAN network performance tracking dashboard. The purpose of this slide is to demonstrate the performance of the SD-WAN network. The main components include control status, site health, transport interface distribution, WAN edge inventory, edge health, and so on.
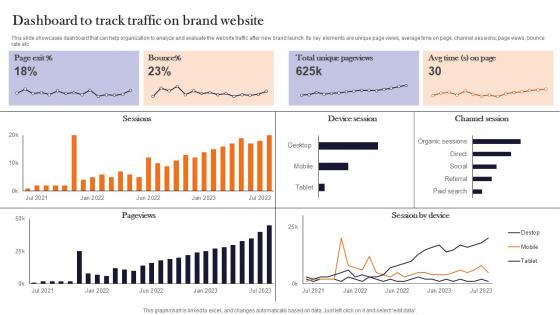
Dashboard To Track Traffic On Brand Website Product Advertising And Positioning Diagrams Pdf
This slide showcases dashboard that can help organization to analyze and evaluate the website traffic after new brand launch. Its key elements are unique page views, average time on page, channel sessions, page views, bounce rate etc. Are you in need of a template that can accommodate all of your creative concepts This one is crafted professionally and can be altered to fit any style. Use it with Google Slides or PowerPoint. Include striking photographs, symbols, depictions, and other visuals. Fill, move around, or remove text boxes as desired. Test out color palettes and font mixtures. Edit and save your work, or work with colleagues. Download Dashboard To Track Traffic On Brand Website Product Advertising And Positioning Diagrams Pdf and observe how to make your presentation outstanding. Give an impeccable presentation to your group and make your presentation unforgettable. This slide showcases dashboard that can help organization to analyze and evaluate the website traffic after new brand launch. Its key elements are unique page views, average time on page, channel sessions, page views, bounce rate etc.
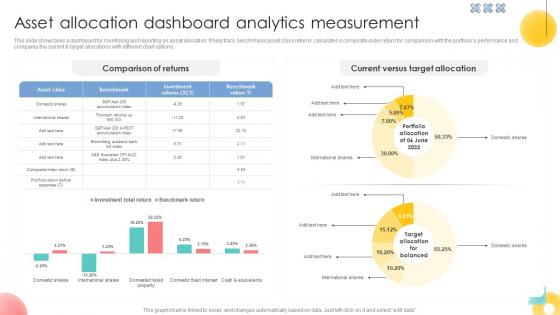
Asset Allocation Dashboard Analytics Measurement Strategic Investment Plan For Optimizing Risk SS V
This slide showcases a dashboard for monitoring and reporting on asset allocation. It help track benchmarks asset class returns, calculates a composite index return for comparison with the portfolios performance and compares the current and target allocations with different chart options.Slidegeeks is one of the best resources for PowerPoint templates. You can download easily and regulate Asset Allocation Dashboard Analytics Measurement Strategic Investment Plan For Optimizing Risk SS V for your personal presentations from our wonderful collection. A few clicks is all it takes to discover and get the most relevant and appropriate templates. Use our Templates to add a unique zing and appeal to your presentation and meetings. All the slides are easy to edit and you can use them even for advertisement purposes. This slide showcases a dashboard for monitoring and reporting on asset allocation. It help track benchmarks asset class returns, calculates a composite index return for comparison with the portfolios performance and compares the current and target allocations with different chart options.
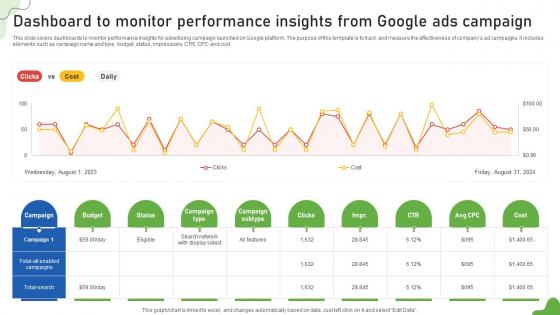
Google Ads Categories Dashboard To Monitor Performance Insights From Google Ads MKT SS V
This slide covers dashboards to monitor performance insights for advertising campaign launched on Google platform. The purpose of this template is to track and measure the effectiveness of companys ad campaigns. It includes elements such as campaign name and type, budget, status, impressions, CTR, CPC and cost. The best PPT templates are a great way to save time, energy, and resources. Slidegeeks have 100 percent editable powerpoint slides making them incredibly versatile. With these quality presentation templates, you can create a captivating and memorable presentation by combining visually appealing slides and effectively communicating your message. Download Google Ads Categories Dashboard To Monitor Performance Insights From Google Ads MKT SS V from Slidegeeks and deliver a wonderful presentation. This slide covers dashboards to monitor performance insights for advertising campaign launched on Google platform. The purpose of this template is to track and measure the effectiveness of companys ad campaigns. It includes elements such as campaign name and type, budget, status, impressions, CTR, CPC and cost.
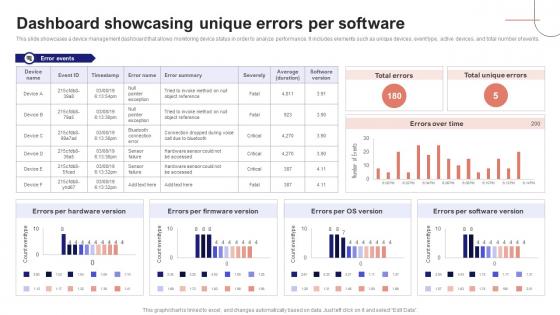
IoT Device Management Fundamentals Dashboard Showcasing Unique Errors Per Software IoT Ss V
This slide showcases a device management dashboard that allows monitoring device status in order to analyze performance. It includes elements such as unique devices, event type, active devices, and total number of events. Are you in need of a template that can accommodate all of your creative concepts This one is crafted professionally and can be altered to fit any style. Use it with Google Slides or PowerPoint. Include striking photographs, symbols, depictions, and other visuals. Fill, move around, or remove text boxes as desired. Test out color palettes and font mixtures. Edit and save your work, or work with colleagues. Download IoT Device Management Fundamentals Dashboard Showcasing Unique Errors Per Software IoT SS V and observe how to make your presentation outstanding. Give an impeccable presentation to your group and make your presentation unforgettable. This slide showcases a device management dashboard that allows monitoring device status in order to analyze performance. It includes elements such as unique devices, event type, active devices, and total number of events.
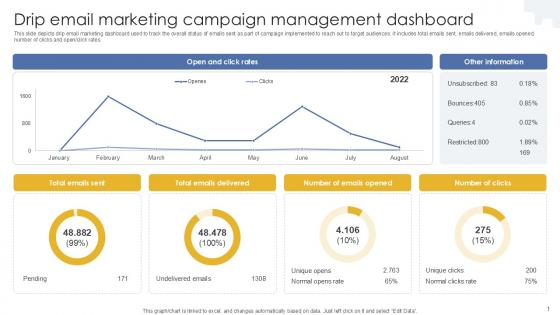
Drip Email Marketing Campaign Management Dashboard PPT Presentation MKT SS V
This slide depicts drip email marketing dashboard used to track the overall status of emails sent as part of campaign implemented to reach out to target audiences. It includes total emails sent, emails delivered, emails opened, number of clicks and open click rates. Present like a pro with Drip Email Marketing Campaign Management Dashboard PPT Presentation MKT SS V. Create beautiful presentations together with your team, using our easy-to-use presentation slides. Share your ideas in real-time and make changes on the fly by downloading our templates. So whether you are in the office, on the go, or in a remote location, you can stay in sync with your team and present your ideas with confidence. With Slidegeeks presentation got a whole lot easier. Grab these presentations today. This slide depicts drip email marketing dashboard used to track the overall status of emails sent as part of campaign implemented to reach out to target audiences. It includes total emails sent, emails delivered, emails opened, number of clicks and open click rates.
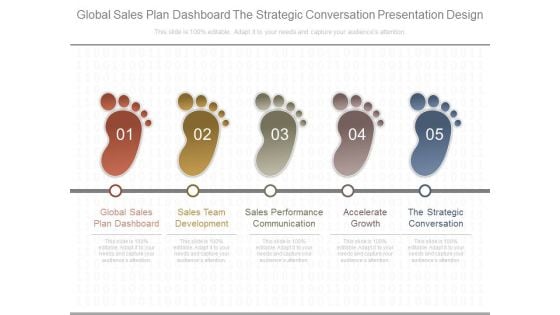
Global Sales Plan Dashboard The Strategic Conversation Presentation Design
This is a global sales plan dashboard the strategic conversation presentation design. This is a five stage process. The stages in this process are business, process and flows, success.
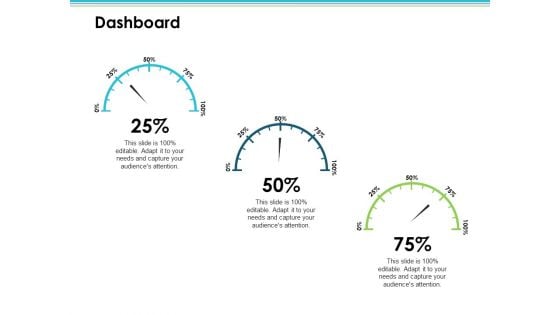
Dashboard Employee Value Proposition Ppt PowerPoint Presentation Inspiration Topics
This is a dashboard employee value proposition ppt powerpoint presentation inspiration topics. This is a three stage process. The stages in this process are business, management, strategy, analysis, marketing.

Healthcare Big Data Assessment Dashboard Slide2 Introduction PDF
This slide covers the records about the patients used to describe massive volumes of information created by the adoption of digital technologies that collect patients records and help in managing hospital performance. Showcasing this set of slides titled Healthcare Big Data Assessment Dashboard Slide2 Introduction PDF. The topics addressed in these templates are Forecasted Patient Turnover, Service Indicators, Occupancy. All the content presented in this PPT design is completely editable. Download it and make adjustments in color, background, font etc. as per your unique business setting.
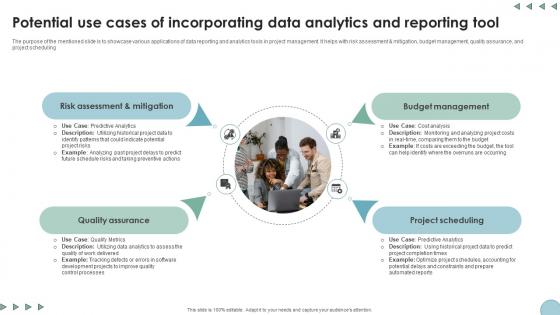
Potential Use Cases Of Incorporating Data Digital Transformation In Project Management
The purpose of the mentioned slide is to showcase various applications of data reporting and analytics tools in project management. It helps with risk assessment and mitigation, budget management, quality assurance, and project scheduling. Are you searching for a Potential Use Cases Of Incorporating Data Digital Transformation In Project Management that is uncluttered, straightforward, and original Its easy to edit, and you can change the colors to suit your personal or business branding. For a presentation that expresses how much effort you have put in, this template is ideal With all of its features, including tables, diagrams, statistics, and lists, its perfect for a business plan presentation. Make your ideas more appealing with these professional slides. Download Potential Use Cases Of Incorporating Data Digital Transformation In Project Management from Slidegeeks today. The purpose of the mentioned slide is to showcase various applications of data reporting and analytics tools in project management. It helps with risk assessment and mitigation, budget management, quality assurance, and project scheduling.
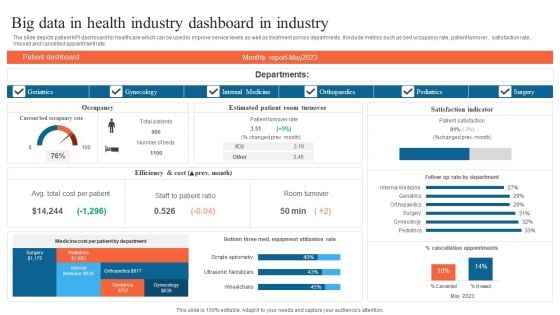
Big Data In Health Industry Dashboard In Industry Summary PDF
The slide depicts patient KPI dashboard for healthcare which can be used to improve service levels as well as treatment across departments. It include metrics such as bed occupancy rate, patient turnover, satisfaction rate, missed and cancelled appointment rate. Showcasing this set of slides titled Big Data In Health Industry Dashboard In Industry Summary PDF. The topics addressed in these templates are Geriatrics, Gynecology, Internal Medicine. All the content presented in this PPT design is completely editable. Download it and make adjustments in color, background, font etc. as per your unique business setting.
Tracking Customer Sales Funnel Dashboard Strategies To Manage Sales Funnel Summary Pdf
This slide covers information regarding the customer sales funnel tracking with sales volume and total market. Boost your pitch with our creative Tracking Customer Sales Funnel Dashboard Strategies To Manage Sales Funnel Summary Pdf. Deliver an awe-inspiring pitch that will mesmerize everyone. Using these presentation templates you will surely catch everyones attention. You can browse the ppts collection on our website. We have researchers who are experts at creating the right content for the templates. So you do not have to invest time in any additional work. Just grab the template now and use them. This slide covers information regarding the customer sales funnel tracking with sales volume and total market.
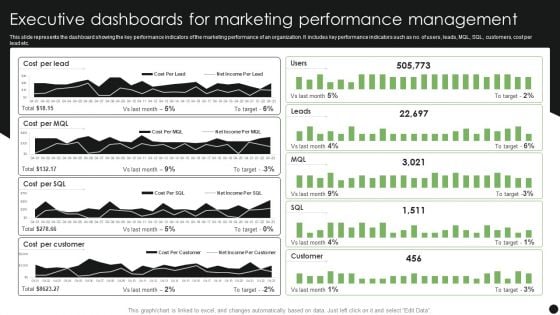
Executive Dashboards For Marketing Performance Management Slides PDF
This slide represents the dashboard showing the key performance indicators of the marketing performance of an organization. It includes key performance indicators such as no. of users, leads, MQL, SQL, customers, cost per lead etc. Pitch your topic with ease and precision using this Executive Dashboards For Marketing Performance Management Slides PDF. This layout presents information on Cost Per Lead, Cost Per Customer. It is also available for immediate download and adjustment. So, changes can be made in the color, design, graphics or any other component to create a unique layout.
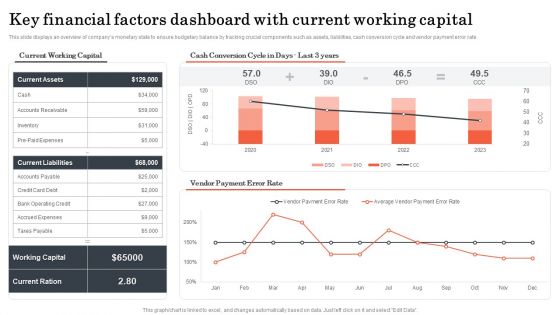
Key Financial Factors Dashboard With Current Working Capital Introduction PDF
This slide displays an overview of companys monetary state to ensure budgetary balance by tracking crucial components such as assets, liabilities, cash conversion cycle and vendor payment error rate. Showcasing this set of slides titled Key Financial Factors Dashboard With Current Working Capital Introduction PDF. The topics addressed in these templates are Key Financial Factors, Dashboard With Current, Working Capital. All the content presented in this PPT design is completely editable. Download it and make adjustments in color, background, font etc. as per your unique business setting.
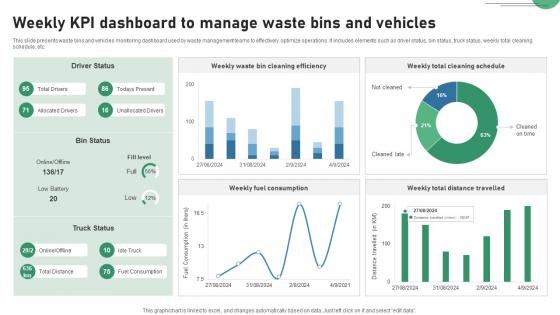
Weekly KPI Dashboard To Manage Waste Bins And Vehicles IOT Applications In Smart Waste IoT SS V
This slide presents waste bins and vehicles monitoring dashboard used by waste management teams to effectively optimize operations. It includes elements such as driver status, bin status, truck status, weekly total cleaning schedule, etc. Find highly impressive Weekly KPI Dashboard To Manage Waste Bins And Vehicles IOT Applications In Smart Waste IoT SS V on Slidegeeks to deliver a meaningful presentation. You can save an ample amount of time using these presentation templates. No need to worry to prepare everything from scratch because Slidegeeks experts have already done a huge research and work for you. You need to download Weekly KPI Dashboard To Manage Waste Bins And Vehicles IOT Applications In Smart Waste IoT SS V for your upcoming presentation. All the presentation templates are 100 percent editable and you can change the color and personalize the content accordingly. Download now. This slide presents waste bins and vehicles monitoring dashboard used by waste management teams to effectively optimize operations. It includes elements such as driver status, bin status, truck status, weekly total cleaning schedule, etc.
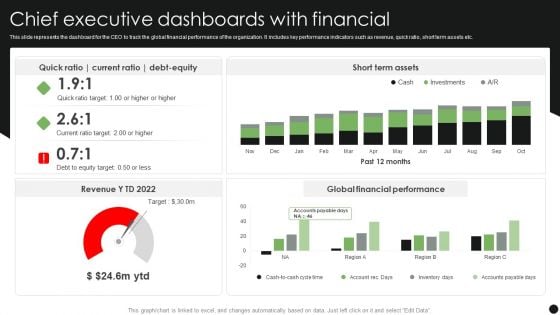
Chief Executive Dashboards With Financial Topics PDF
This slide represents the dashboard for the CEO to track the global financial performance of the organization. It includes key performance indicators such as revenue, quick ratio, short term assets etc. Showcasing this set of slides titled Chief Executive Dashboards With Financial Topics PDF. The topics addressed in these templates are Short Term Assets, Global Financial Performance, Debt Equity. All the content presented in this PPT design is completely editable. Download it and make adjustments in color, background, font etc. as per your unique business setting.
Audio Assistant With Digital Watch Vector Icon Ppt PowerPoint Presentation Pictures Visuals
Presenting this set of slides with name audio assistant with digital watch vector icon ppt powerpoint presentation pictures visuals. This is a three stage process. The stages in this process are audio assistant with digital watch vector icon. This is a completely editable PowerPoint presentation and is available for immediate download. Download now and impress your audience.
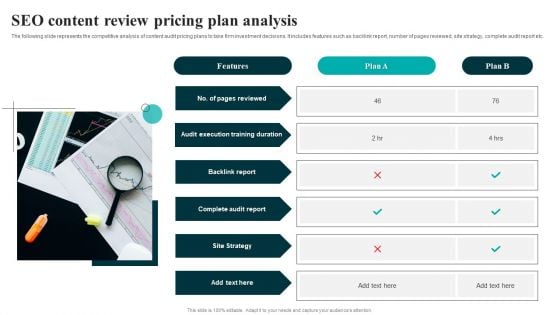
SEO Content Review Pricing Plan Analysis Slides PDF
The following slide represents the competitive analysis of content audit pricing plans to take firm investment decisions. It includes features such as backlink report, number of pages reviewed, site strategy, complete audit report etc. Presenting SEO Content Review Pricing Plan Analysis Slides PDF to dispense important information. This template comprises One stage. It also presents valuable insights into the topics including Backlink Report, Complete Audit Report, Site Strategy. This is a completely customizable PowerPoint theme that can be put to use immediately. So, download it and address the topic impactfully.
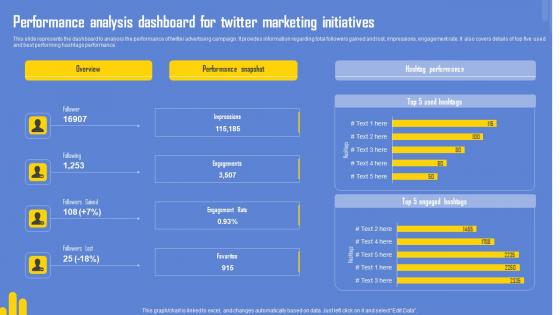
Optimizing Twitter For Online Performance Analysis Dashboard For Twitter Marketing Initiatives Topics Pdf
This slide represents the dashboard to analysis the performance of twitter campaign. It provides information regarding total followers gained and lost, impressions, engagement rate. It also covers details of top five used and best performing hashtags performance. Crafting an eye-catching presentation has never been more straightforward. Let your presentation shine with this tasteful yet straightforward Optimizing Twitter For Online Overview Of Twitter As Social Media Marketing Tool Themes Pdf template. It offers a minimalistic and classy look that is great for making a statement. The colors have been employed intelligently to add a bit of playfulness while still remaining professional. Construct the ideal Optimizing Twitter For Online Overview Of Twitter As Social Media Marketing Tool Themes Pdf that effortlessly grabs the attention of your audience Begin now and be certain to wow your customers This slide represents the dashboard to analysis the performance of twitter advertising campaign. It provides information regarding total followers gained and lost, impressions, engagement rate. It also covers details of top five used and best performing hashtags performance.
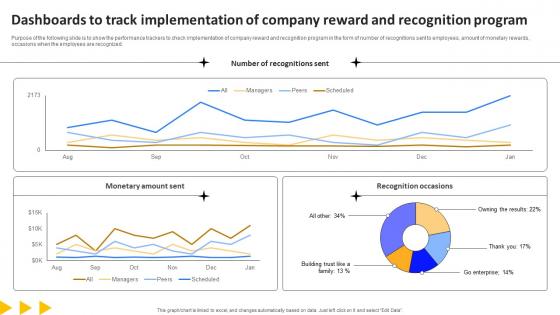
Workforce Productivity Improvement Dashboards To Track Implementation Of Company Elements Pdf
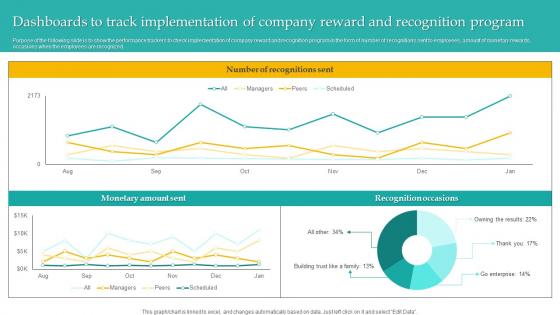
Purpose of the following slide is to show the performance trackers to check implementation of company reward and recognition program in the form of number of recognitions sent to employees, amount of monetary rewards, occasions when the employees are recognized. This Workforce Productivity Improvement Dashboards To Track Implementation Of Company Elements Pdf is perfect for any presentation, be it in front of clients or colleagues. It is a versatile and stylish solution for organizing your meetings. The Workforce Productivity Improvement Dashboards To Track Implementation Of Company Elements Pdf features a modern design for your presentation meetings. The adjustable and customizable slides provide unlimited possibilities for acing up your presentation. Slidegeeks has done all the homework before launching the product for you. So, do not wait, grab the presentation templates today Purpose of the following slide is to show the performance trackers to check implementation of company reward and recognition program in the form of number of recognitions sent to employees, amount of monetary rewards, occasions when the employees are recognized.
Dashboards Track Implementation Administering Diversity And Inclusion At Workplace Designs Pdf
Purpose of the following slide is to show the performance trackers to check implementation of company reward and recognition program in the form of number of recognitions sent to employees, amount of monetary rewards, occasions when the employees are recognized. Do you have an important presentation coming up Are you looking for something that will make your presentation stand out from the rest Look no further than Dashboards Track Implementation Administering Diversity And Inclusion At Workplace Designs Pdf. With our professional designs, you can trust that your presentation will pop and make delivering it a smooth process. And with Slidegeeks, you can trust that your presentation will be unique and memorable. So why wait Grab Dashboards Track Implementation Administering Diversity And Inclusion At Workplace Designs Pdf today and make your presentation stand out from the rest Purpose of the following slide is to show the performance trackers to check implementation of company reward and recognition program in the form of number of recognitions sent to employees, amount of monetary rewards, occasions when the employees are recognized.
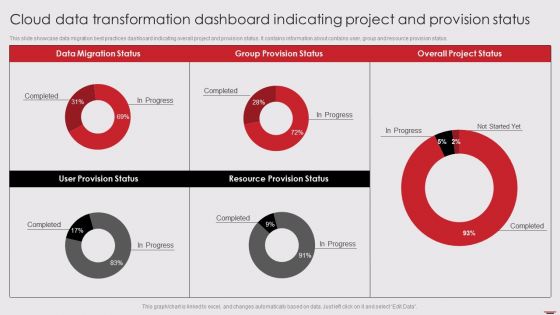
Cloud Data Transformation Dashboard Indicating Project And Provision Status Formats PDF
This slide showcase data migration best practices dashboard indicating overall project and provision status. It contains information about contains user, group and resource provision status. Showcasing this set of slides titled Cloud Data Transformation Dashboard Indicating Project And Provision Status Formats PDF. The topics addressed in these templates are Data Migration Status, Overall Project Status, Group Provision Status. All the content presented in this PPT design is completely editable. Download it and make adjustments in color, background, font etc. as per your unique business setting.
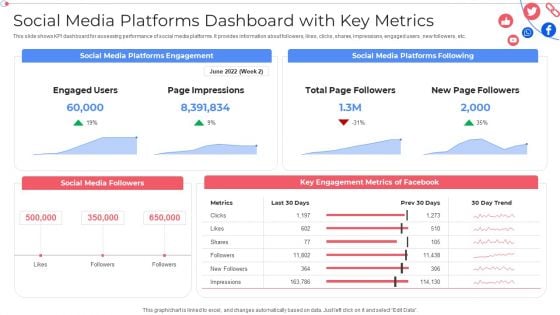
Social Media Platforms Dashboard With Key Metrics Customer Group Engagement Through Social Media Channels Infographics PDF
This slide shows KPI dashboard for assessing performance of social media platforms. It provides information about followers, likes, clicks, shares, impressions, engaged users , new followers, etc. Deliver an awe inspiring pitch with this creative Social Media Platforms Dashboard With Key Metrics Customer Group Engagement Through Social Media Channels Infographics PDF bundle. Topics like Social Media Followers, Key Engagement Metrics can be discussed with this completely editable template. It is available for immediate download depending on the needs and requirements of the user.
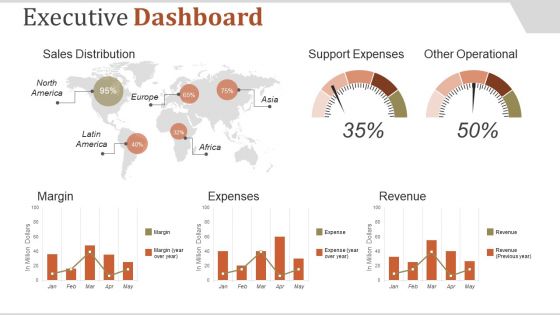
Executive Dashboard Ppt PowerPoint Presentation Introduction
This is a executive dashboard ppt powerpoint presentation introduction. This is a five stage process. The stages in this process are sales distribution, support expenses, other operational, margin, expenses.
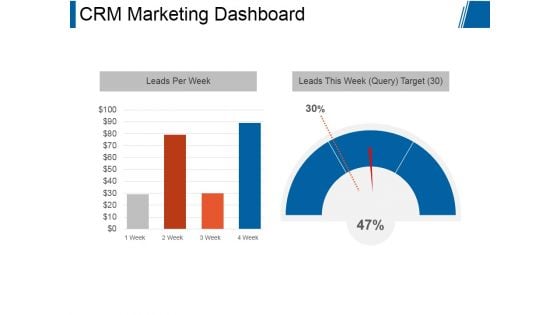
Crm Marketing Dashboard Ppt PowerPoint Presentation Designs
This is a crm marketing dashboard ppt powerpoint presentation designs. This is a two stage process. The stages in this process are leads per week, leads this week target.
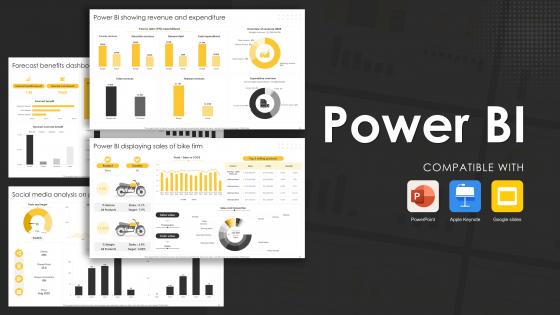
Power BI Powerpoint PPT Template Bundles
This Power BI Powerpoint PPT Template Bundles is a primer on how to capitalize on business opportunities through planning, innovation, and market intelligence. The content-ready format of the complete deck will make your job as a decision-maker a lot easier. Use this ready-made PowerPoint Template to help you outline an extensive and legible plan to capture markets and grow your company on the right path, at an exponential pace. What is even more amazing is that this presentation is completely editable and 100 percent customizable. This Data Visualization,Project Report,Business Intelligence,Data Model,Technology Project-slide complete deck helps you impress a roomful of people with your expertise in business and even presentation. Craft such a professional and appealing presentation for that amazing recall value. Download now. Our Power BI PowerPoint PPT Template Bundles are carefully crafted to provide a visually appealing and professional backdrop for any subject. These templates allow you to convey data insights and statistics with clarity and impact, making you appear professional and confident.
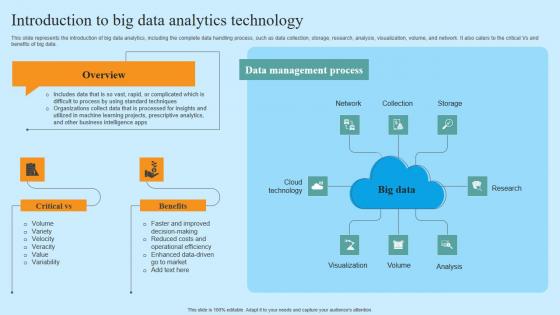
Introduction To Big Data Analytics Technology Hyper Automation Solutions Designs Pdf
This slide represents the introduction of big data analytics, including the complete data handling process, such as data collection, storage, research, analysis, visualization, volume, and network. It also caters to the critical Vs and benefits of big data. Retrieve professionally designed Introduction To Big Data Analytics Technology Hyper Automation Solutions Designs Pdf to effectively convey your message and captivate your listeners. Save time by selecting pre-made slideshows that are appropriate for various topics, from business to educational purposes. These themes come in many different styles, from creative to corporate, and all of them are easily adjustable and can be edited quickly. Access them as PowerPoint templates or as Google Slides themes. You do not have to go on a hunt for the perfect presentation because Slidegeeks got you covered from everywhere. This slide represents the introduction of big data analytics, including the complete data handling process, such as data collection, storage, research, analysis, visualization, volume, and network. It also caters to the critical Vs and benefits of big data.
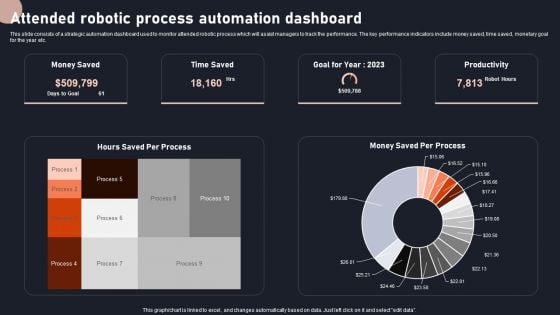
Attended Robotic Process Automation Dashboard Rules PDF
This slide consists of a strategic automation dashboard used to monitor attended robotic process which will assist managers to track the performance. The key performance indicators include money saved, time saved, monetary goal for the year etc. Showcasing this set of slides titled Attended Robotic Process Automation Dashboard Rules PDF. The topics addressed in these templates are Productivity, Goal, Process Automation Dashboard. All the content presented in this PPT design is completely editable. Download it and make adjustments in color, background, font etc. as per your unique business setting.

Automating Key Activities Of HR Manager Dashboard Showing Employee Measurement Metrics Clipart PDF
This slide shows the dashboard that depicts the metrics for measuring employee performance which includes talent satisfaction, talent turnover rate, rating, etc.Deliver and pitch your topic in the best possible manner with this Automating Key Activities Of HR Manager Dashboard Showing Employee Measurement Metrics Clipart PDF Use them to share invaluable insights on Talent Management, Talent Satisfaction, Talent Turnover and impress your audience. This template can be altered and modified as per your expectations. So, grab it now.
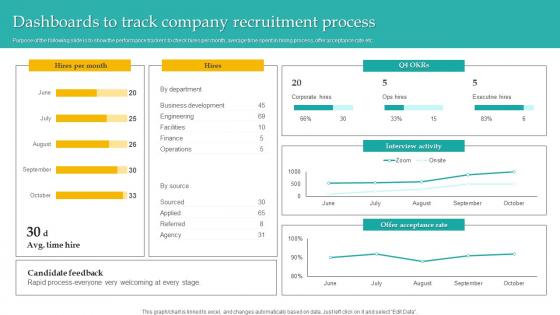
Dashboards To Track Company Administering Diversity And Inclusion At Workplace Mockup Pdf
Purpose of the following slide is to show the performance trackers to check hires per month, average time spent in hiring process, offer acceptance rate etc. From laying roadmaps to briefing everything in detail, our templates are perfect for you. You can set the stage with your presentation slides. All you have to do is download these easy to edit and customizable templates. Dashboards To Track Company Administering Diversity And Inclusion At Workplace Mockup Pdf will help you deliver an outstanding performance that everyone would remember and praise you for. Do download this presentation today. Purpose of the following slide is to show the performance trackers to check hires per month, average time spent in hiring process, offer acceptance rate etc.
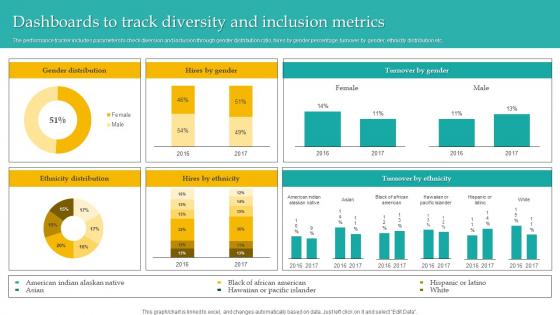
Dashboards Track Diversity Inclusion Administering Diversity And Inclusion At Workplace Template Pdf
The performance tracker includes parameters to check diversion and inclusion through gender distribution ratio, hires by gender percentage, turnover by gender, ethnicity distribution etc. Present like a pro with Dashboards Track Diversity Inclusion Administering Diversity And Inclusion At Workplace Template Pdf Create beautiful presentations together with your team, using our easy to use presentation slides. Share your ideas in real time and make changes on the fly by downloading our templates. So whether you are in the office, on the go, or in a remote location, you can stay in sync with your team and present your ideas with confidence. With Slidegeeks presentation got a whole lot easier. Grab these presentations today. The performance tracker includes parameters to check diversion and inclusion through gender distribution ratio, hires by gender percentage, turnover by gender, ethnicity distribution etc.
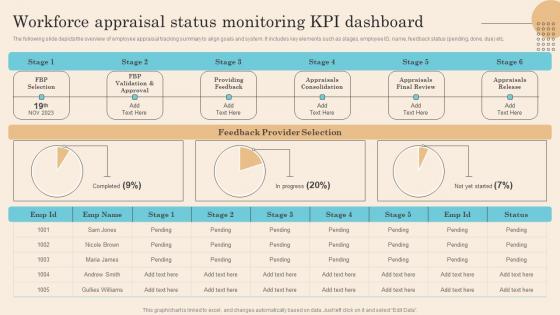
Workforce Appraisal Status Monitoring Kpi Dashboard Executing Successful Staff Performance Graphics Pdf
The following slide depicts the overview of employee appraisal tracking summary to align goals and system. It includes key elements such as stages, employee ID, name, feedback status pending, done, due etc. There are so many reasons you need a Workforce Appraisal Status Monitoring Kpi Dashboard Executing Successful Staff Performance Graphics Pdf. The first reason is you can not spend time making everything from scratch, Thus, Slidegeeks has made presentation templates for you too. You can easily download these templates from our website easily. The following slide depicts the overview of employee appraisal tracking summary to align goals and system. It includes key elements such as stages, employee ID, name, feedback status pending, done, due etc.
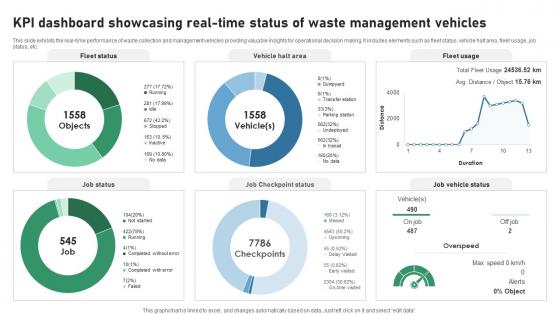
KPI Dashboard Showcasing Real Time Status Of Waste IOT Applications In Smart Waste IoT SS V
This slide exhibits the real-time performance of waste collection and management vehicles providing valuable insights for operational decision making. It includes elements such as fleet status, vehicle halt area, fleet usage, job status, etc. Take your projects to the next level with our ultimate collection of KPI Dashboard Showcasing Real Time Status Of Waste IOT Applications In Smart Waste IoT SS V. Slidegeeks has designed a range of layouts that are perfect for representing task or activity duration, keeping track of all your deadlines at a glance. Tailor these designs to your exact needs and give them a truly corporate look with your own brand colors they will make your projects stand out from the rest This slide exhibits the real-time performance of waste collection and management vehicles providing valuable insights for operational decision making. It includes elements such as fleet status, vehicle halt area, fleet usage, job status, etc.
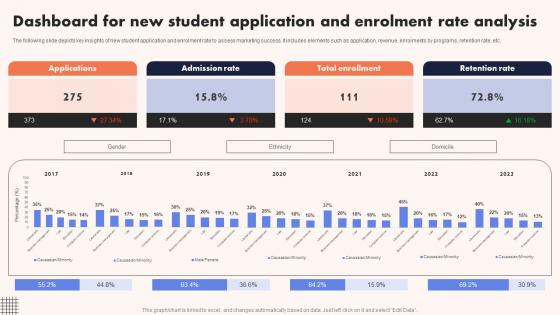
University Marketing Guide Dashboard For New Student Application And Enrolment Strategy SS V
The following slide depicts key insights of new student application and enrolment rate to assess marketing success. It includes elements such as application, revenue, enrolments by programs, retention rate, etc. Coming up with a presentation necessitates that the majority of the effort goes into the content and the message you intend to convey. The visuals of a PowerPoint presentation can only be effective if it supplements and supports the story that is being told. Keeping this in mind our experts created University Marketing Guide Dashboard For New Student Application And Enrolment Strategy SS V to reduce the time that goes into designing the presentation. This way, you can concentrate on the message while our designers take care of providing you with the right template for the situation. The following slide depicts key insights of new student application and enrolment rate to assess marketing success. It includes elements such as application, revenue, enrolments by programs, retention rate, etc.
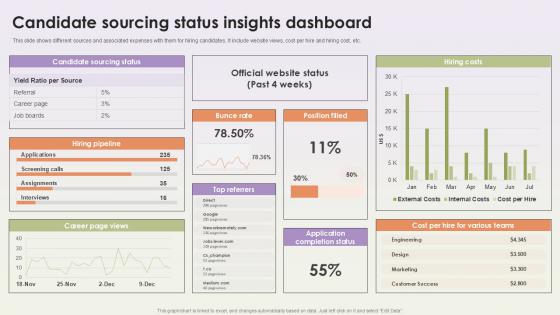
Candidate Sourcing Status Insights Dashboard Workforce Procurement And Aptitude Evaluation Ppt Sample
This slide shows different sources and associated expenses with them for hiring candidates. It include website views, cost per hire and hiring cost, etc. Slidegeeks is one of the best resources for PowerPoint templates. You can download easily and regulate Candidate Sourcing Status Insights Dashboard Workforce Procurement And Aptitude Evaluation Ppt Sample for your personal presentations from our wonderful collection. A few clicks is all it takes to discover and get the most relevant and appropriate templates. Use our Templates to add a unique zing and appeal to your presentation and meetings. All the slides are easy to edit and you can use them even for advertisement purposes. This slide shows different sources and associated expenses with them for hiring candidates. It include website views, cost per hire and hiring cost, etc.
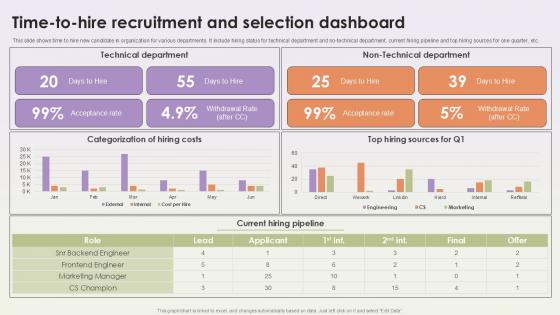
Time To Hire Recruitment And Selection Dashboard Workforce Procurement And Aptitude Evaluation Ppt Template
This slide shows time to hire new candidate in organization for various departments. It include hiring status for technical department and no-technical department, current hiring pipeline and top hiring sources for one quarter, etc. From laying roadmaps to briefing everything in detail, our templates are perfect for you. You can set the stage with your presentation slides. All you have to do is download these easy-to-edit and customizable templates. Time To Hire Recruitment And Selection Dashboard Workforce Procurement And Aptitude Evaluation Ppt Template will help you deliver an outstanding performance that everyone would remember and praise you for. Do download this presentation today. This slide shows time to hire new candidate in organization for various departments. It include hiring status for technical department and no-technical department, current hiring pipeline and top hiring sources for one quarter, etc.
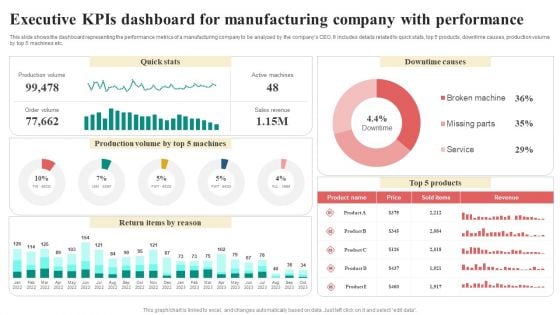
Executive Kpis Dashboard For Manufacturing Company With Performance Infographics PDF
This slide shows the dashboard representing the performance metrics of a manufacturing company to be analyzed by the companys CEO. It includes details related to quick stats, top 5 products, downtime causes, production volume by top 5 machines etc. Showcasing this set of slides titled Executive Kpis Dashboard For Manufacturing Company With Performance Infographics PDF. The topics addressed in these templates are Return Items By Reason, Quick Stats, Downtime Causes, Revenue. All the content presented in this PPT design is completely editable. Download it and make adjustments in color, background, font etc. as per your unique business setting.
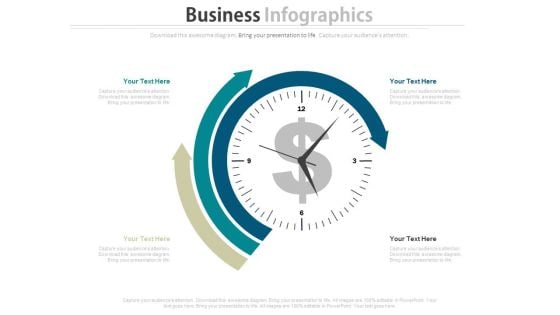
Dashboard Diagram For Finance And Strategic Analysis Powerpoint Slides
This PowerPoint template display graphics of clock with arrows around it and dollar symbol in center. You may use this PPT slide for financial and strategic analysis. This dashboard slide may useful for multilevel status report creation and approval process.
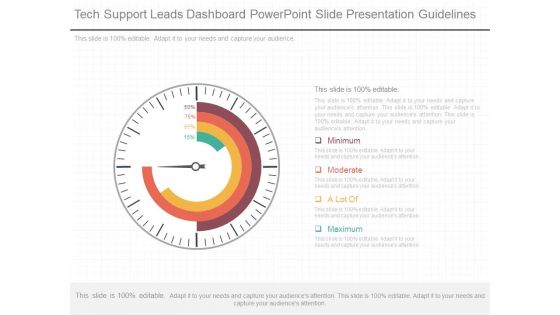
Tech Support Leads Dashboard Powerpoint Slide Presentation Guidelines
This is a tech support leads dashboard powerpoint slide presentation guidelines. This is a four stage process. The stages in this process are minimum, moderate, a lot of, maximum.
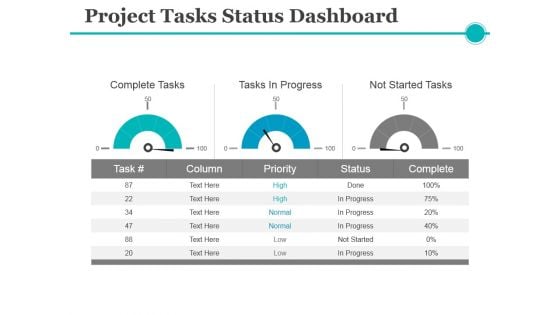
Project Tasks Status Dashboard Ppt PowerPoint Presentation File Graphics Download
This is a project tasks status dashboard ppt powerpoint presentation file graphics download. This is a three stage process. The stages in this process are complete tasks, tasks in progress, not started tasks.


 Continue with Email

 Home
Home


