Snapshot
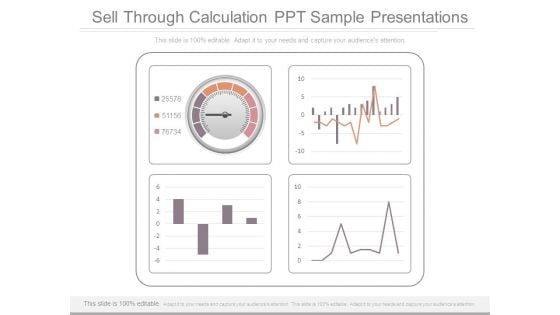
Sell Through Calculation Ppt Sample Presentations
This is a sell through calculation ppt sample presentations. This is a four stage process. The stages in this process are dashboard, business, graph.
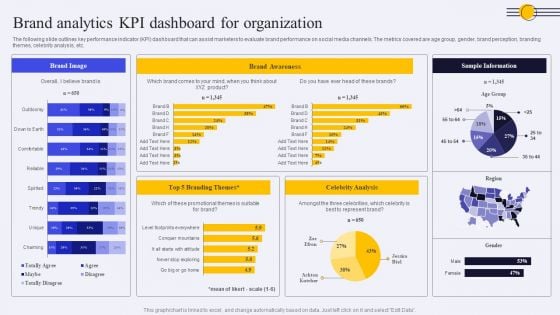
Brand Analytics KPI Dashboard For Organization Ppt PowerPoint Presentation Diagram PDF
The following slide outlines key performance indicator KPI dashboard that can assist marketers to evaluate brand performance on social media channels. The metrics covered are age group, gender, brand perception, branding themes, celebrity analysis, etc. Take your projects to the next level with our ultimate collection of Brand Analytics KPI Dashboard For Organization Ppt PowerPoint Presentation Diagram PDF. Slidegeeks has designed a range of layouts that are perfect for representing task or activity duration, keeping track of all your deadlines at a glance. Tailor these designs to your exact needs and give them a truly corporate look with your own brand colors they will make your projects stand out from the rest.
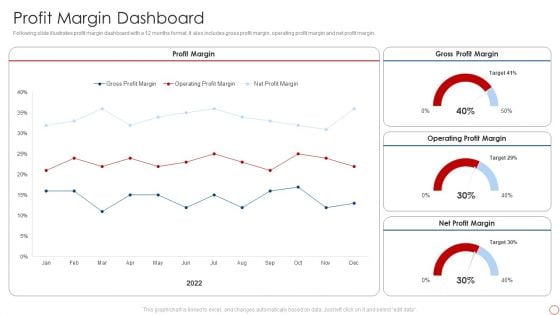
Kpis For Evaluating Business Sustainability Profit Margin Dashboard Pictures PDF
Following slide illustrates profit margin dashboard with a 12 months format. It also includes gross profit margin, operating profit margin and net profit margin. Deliver and pitch your topic in the best possible manner with this Kpis For Evaluating Business Sustainability Profit Margin Dashboard Pictures PDF. Use them to share invaluable insights on Profit Margin, Gross Profit Margin, Operating Profit Margin and impress your audience. This template can be altered and modified as per your expectations. So, grab it now.
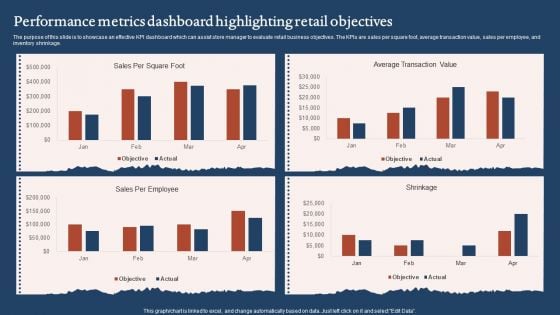
Performance Metrics Dashboard Highlighting Retail Objectives Sample PDF
The purpose of this slide is to showcase an effective KPI dashboard which can assist store manager to evaluate retail business objectives. The KPIs are sales per square foot, average transaction value, sales per employee, and inventory shrinkage. Pitch your topic with ease and precision using this Performance Metrics Dashboard Highlighting Retail Objectives Sample PDF. This layout presents information on Average Transaction Value, Sales Per Employee. It is also available for immediate download and adjustment. So, changes can be made in the color, design, graphics or any other component to create a unique layout.
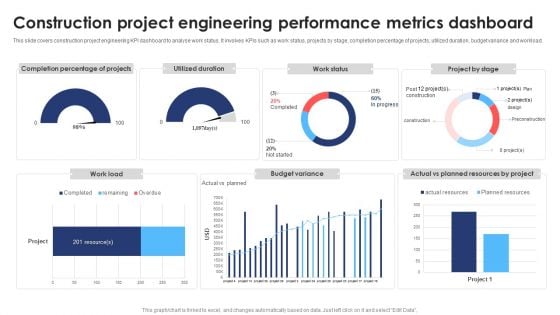
Construction Project Engineering Performance Metrics Dashboard Ideas PDF
This slide covers construction project engineering KPI dashboard to analyse work status. It involves KPIs such as work status, projects by stage, completion percentage of projects, utilized duration, budget variance and workload. Showcasing this set of slides titled Construction Project Engineering Performance Metrics Dashboard Ideas PDF. The topics addressed in these templates are Budget Variance, Resource, Project. All the content presented in this PPT design is completely editable. Download it and make adjustments in color, background, font etc. as per your unique business setting.

KPI Analytics Dashboard With Sourcing Raw Material Cycle Time Inspiration PDF
Following slide shows the key performance indicator KPI dashboard which will assist corporates to effectively monitor procurement process. The metrics are number of suppliers, contract compliance, average procurement cycle time, etc. Showcasing this set of slides titled KPI Analytics Dashboard With Sourcing Raw Material Cycle Time Inspiration PDF. The topics addressed in these templates are Kpi Analytics Dashboard, Sourcing Raw Material, Cycle Time. All the content presented in this PPT design is completely editable. Download it and make adjustments in color, background, font etc. as per your unique business setting.
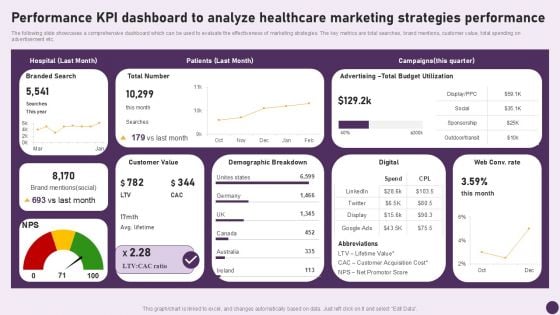
Guide To Healthcare Services Administration Performance KPI Dashboard To Analyze Healthcare Marketing Clipart PDF
Shipping Delivery Tracking Metrics Analysis Dashboard Structure PDF
This template illustrates the KPI dashboard for tracking shipment orders. It also includes shipment analysis based on different KPIs such as ongoing delivery, completed delivery, on-time delivery, actual delivery duration, and variance between expected and actual delivery time. Pitch your topic with ease and precision using this Shipping Delivery Tracking Metrics Analysis Dashboard Structure PDF. This layout presents information on Recipient Country, Completed Deliveries, Delivery Duration. It is also available for immediate download and adjustment. So, changes can be made in the color, design, graphics or any other component to create a unique layout.
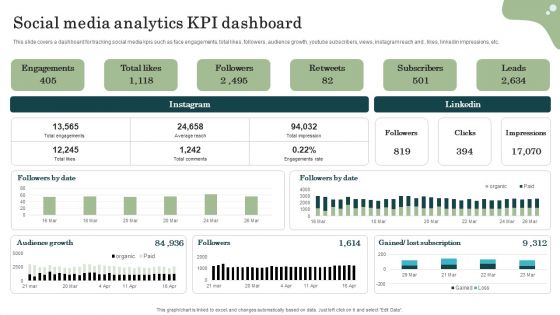
Marketing Success Metrics Social Media Analytics KPI Dashboard Elements PDF
This slide covers a dashboard for tracking social media kpis such as face engagements, total likes, followers, audience growth, youtube subscribers, views, instagram reach and , likes, linkedin impressions, etc. Find a pre-designed and impeccable Marketing Success Metrics Social Media Analytics KPI Dashboard Elements PDF. The templates can ace your presentation without additional effort. You can download these easy-to-edit presentation templates to make your presentation stand out from others. So, what are you waiting for Download the template from Slidegeeks today and give a unique touch to your presentation.
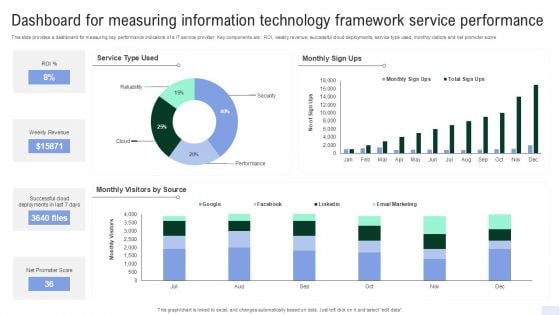
Dashboard For Measuring Information Technology Framework Service Performance Ideas PDF
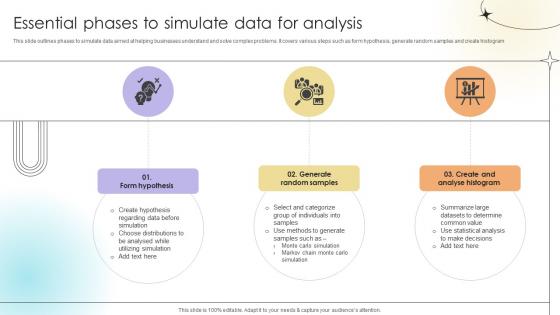
Essential Phases To Simulate Data For Analysis Data Analytics SS V
This slide outlines phases to simulate data aimed at helping businesses understand and solve complex problems. It covers various steps such as form hypothesis, generate random samples and create histogram.Here you can discover an assortment of the finest PowerPoint and Google Slides templates. With these templates, you can create presentations for a variety of purposes while simultaneously providing your audience with an eye-catching visual experience. Download Essential Phases To Simulate Data For Analysis Data Analytics SS V to deliver an impeccable presentation. These templates will make your job of preparing presentations much quicker, yet still, maintain a high level of quality. Slidegeeks has experienced researchers who prepare these templates and write high-quality content for you. Later on, you can personalize the content by editing the Essential Phases To Simulate Data For Analysis Data Analytics SS V. This slide outlines phases to simulate data aimed at helping businesses understand and solve complex problems. It covers various steps such as form hypothesis, generate random samples and create histogram.
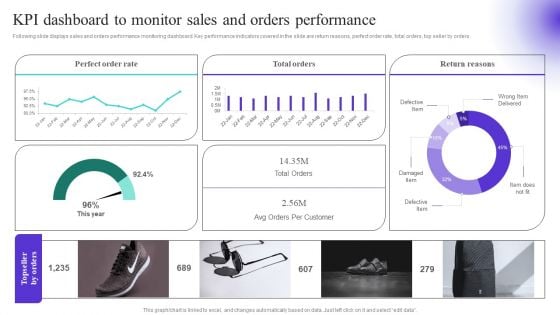
KPI Dashboard To Monitor Sales And Orders Performance Diagrams PDF
Following slide displays sales and orders performance monitoring dashboard. Key performance indicators covered in the slide are return reasons, perfect order rate, total orders, top seller by orders. Create an editable KPI Dashboard To Monitor Sales And Orders Performance Diagrams PDF that communicates your idea and engages your audience. Whether you are presenting a business or an educational presentation, pre designed presentation templates help save time. KPI Dashboard To Monitor Sales And Orders Performance Diagrams PDF is highly customizable and very easy to edit, covering many different styles from creative to business presentations. Slidegeeks has creative team members who have crafted amazing templates. So, go and get them without any delay.

Key Benefits Of Leveraging Big Data Analytics Developing Strategic Insights Using Big Data Analytics SS V
This slide showcases impact of deploying big data analytics in organization which helps in identifying strategic opportunities for business and enhance decision making. It provides information regarding 360 degree holistic approach, improving innovation prospects, enhancing visibility and data discovery. Do you have to make sure that everyone on your team knows about any specific topic I yes, then you should give Key Benefits Of Leveraging Big Data Analytics Developing Strategic Insights Using Big Data Analytics SS V a try. Our experts have put a lot of knowledge and effort into creating this impeccable Key Benefits Of Leveraging Big Data Analytics Developing Strategic Insights Using Big Data Analytics SS V. You can use this template for your upcoming presentations, as the slides are perfect to represent even the tiniest detail. You can download these templates from the Slidegeeks website and these are easy to edit. So grab these today This slide showcases impact of deploying big data analytics in organization which helps in identifying strategic opportunities for business and enhance decision making. It provides information regarding 360 degree holistic approach, improving innovation prospects, enhancing visibility and data discovery.
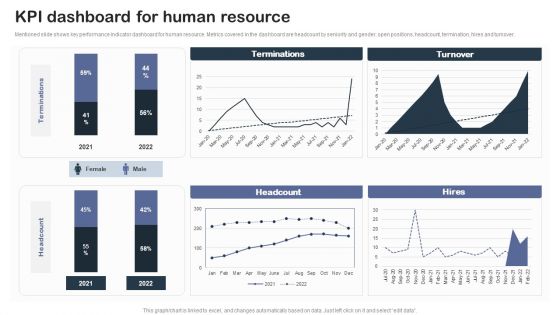
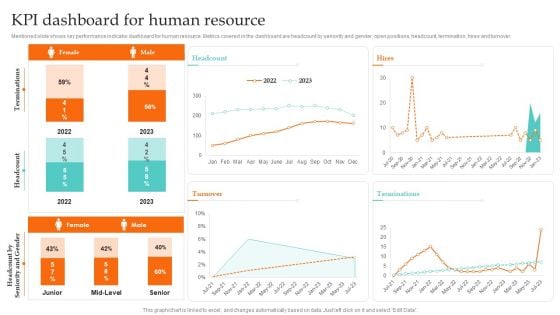
Staff Succession Planning And Development Strategy Kpi Dashboard For Human Clipart PDF
Mentioned slide shows key performance indicator dashboard for human resource. Metrics covered in the dashboard are headcount by seniority and gender, open positions, headcount, termination, hires and turnover.If your project calls for a presentation, then Slidegeeks is your go-to partner because we have professionally designed, easy-to-edit templates that are perfect for any presentation. After downloading, you can easily edit Staff Succession Planning And Development Strategy Kpi Dashboard For Human Clipart PDF and make the changes accordingly. You can rearrange slides or fill them with different images. Check out all the handy templates.
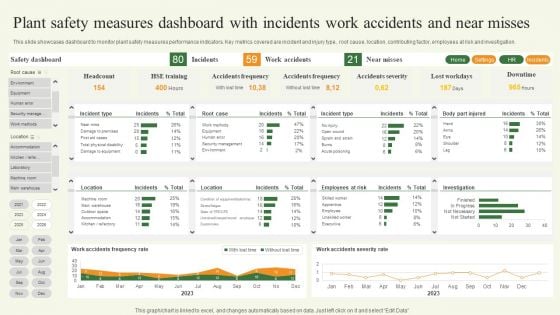
Plant Safety Measures Dashboard With Incidents Work Accidents And Near Misses Template PDF
This slide showcases dashboard to monitor plant safety measures performance indicators. Key metrics covered are incident and injury type, root cause, location, contributing factor, employees at risk and investigation. Pitch your topic with ease and precision using this Plant Safety Measures Dashboard With Incidents Work Accidents And Near Misses Template PDF. This layout presents information on Plant Safety Measures Dashboard, Incidents Work Accidents. It is also available for immediate download and adjustment. So, changes can be made in the color, design, graphics or any other component to create a unique layout.
Kpi Dashboard For Human Resource Ultimate Guide To Employee Succession Planning Topics PDF
Mentioned slide shows key performance indicator dashboard for human resource. Metrics covered in the dashboard are headcount by seniority and gender, open positions, headcount, termination, hires and turnover.Present like a pro with Kpi Dashboard For Human Resource Ultimate Guide To Employee Succession Planning Topics PDF Create beautiful presentations together with your team, using our easy-to-use presentation slides. Share your ideas in real-time and make changes on the fly by downloading our templates. So whether you are in the office, on the go, or in a remote location, you can stay in sync with your team and present your ideas with confidence. With Slidegeeks presentation got a whole lot easier. Grab these presentations today.
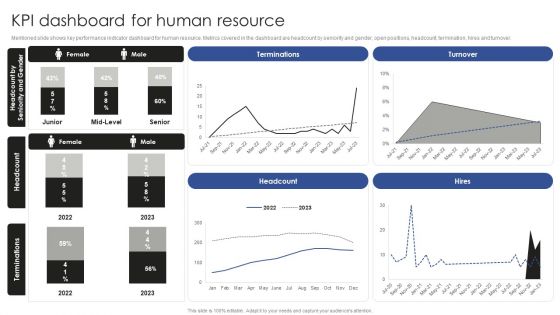
Talent Administration And Succession KPI Dashboard For Human Resource Rules PDF
Mentioned slide shows key performance indicator dashboard for human resource. Metrics covered in the dashboard are headcount by seniority and gender, open positions, headcount, termination, hires and turnover. If your project calls for a presentation, then Slidegeeks is your go-to partner because we have professionally designed, easy-to-edit templates that are perfect for any presentation. After downloading, you can easily edit Talent Administration And Succession KPI Dashboard For Human Resource Rules PDF and make the changes accordingly. You can rearrange slides or fill them with different images. Check out all the handy templates
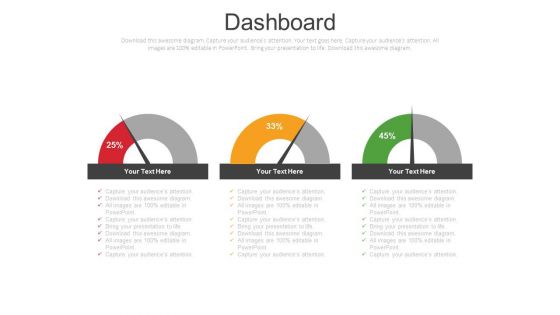
Parameters Of Growth And Development Powerpoint Slides
Dashboard design has been displayed in this business slide. This business diagram helps to exhibit parameters of growth and development. Download this PowerPoint template to build an exclusive presentation.
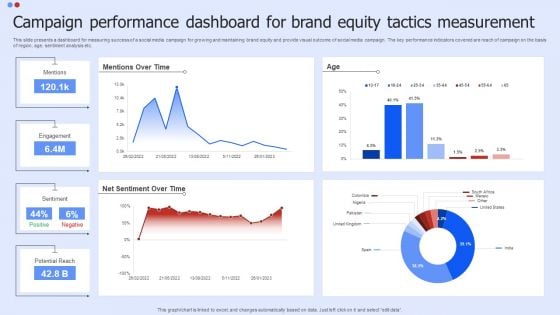
Campaign Performance Dashboard For Brand Equity Tactics Measurement Slides PDF
This slide presents a dashboard for measuring success of a social media campaign for growing and maintaining brand equity and provide visual outcome of social media campaign. The key performance indicators covered are reach of campaign on the basis of region, age, sentiment analysis etc. Showcasing this set of slides titled Campaign Performance Dashboard For Brand Equity Tactics Measurement Slides PDF. The topics addressed in these templates are Campaign Performance Dashboard For Brand Equity Tactics Measurement Slides PDF. All the content presented in this PPT design is completely editable. Download it and make adjustments in color, background, font etc. as per your unique business setting.
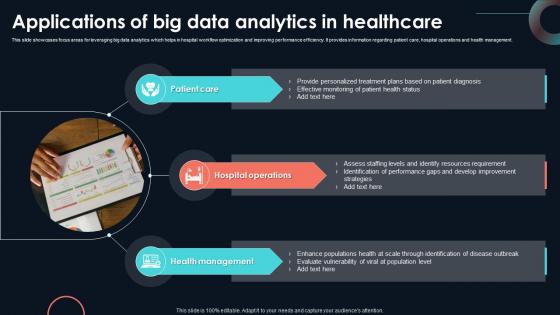
Applications Of Big Data Analytics In Developing Strategic Insights Using Big Data Analytics SS V
This slide showcases focus areas for leveraging big data analytics which helps in hospital workflow optimization and improving performance efficiency. It provides information regarding patient care, hospital operations and health management. Want to ace your presentation in front of a live audience Our Applications Of Big Data Analytics In Developing Strategic Insights Using Big Data Analytics SS V can help you do that by engaging all the users towards you. Slidegeeks experts have put their efforts and expertise into creating these impeccable powerpoint presentations so that you can communicate your ideas clearly. Moreover, all the templates are customizable, and easy-to-edit and downloadable. Use these for both personal and commercial use. This slide showcases focus areas for leveraging big data analytics which helps in hospital workflow optimization and improving performance efficiency. It provides information regarding patient care, hospital operations and health management.
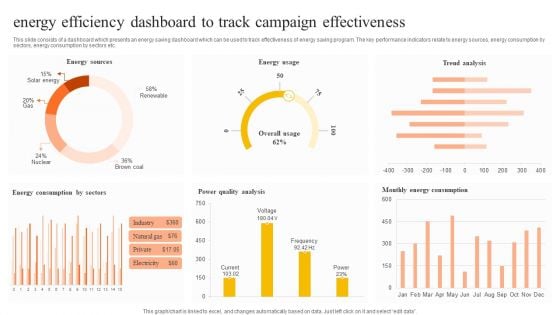
Energy Efficiency Dashboard To Track Campaign Effectiveness Pictures PDF
This slide consists of a dashboard which presents an energy saving dashboard which can be used to track effectiveness of energy saving program. The key performance indicators relate to energy sources, energy consumption by sectors, energy consumption by sectors etc. Pitch your topic with ease and precision using this Energy Efficiency Dashboard To Track Campaign Effectiveness Pictures PDF. This layout presents information on Energy Sources, Energy Usage, Trend Analysis. It is also available for immediate download and adjustment. So, changes can be made in the color, design, graphics or any other component to create a unique layout.
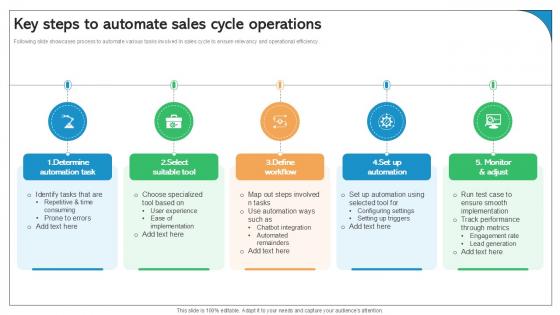
Key Steps To Automate Sales Cycle Operations Best Practices Ppt Slide SA SS V
Following slide showcases process to automate various tasks involved in sales cycle to ensure relevancy and operational efficiency. This Key Steps To Automate Sales Cycle Operations Best Practices Ppt Slide SA SS V from Slidegeeks makes it easy to present information on your topic with precision. It provides customization options, so you can make changes to the colors, design, graphics, or any other component to create a unique layout. It is also available for immediate download, so you can begin using it right away. Slidegeeks has done good research to ensure that you have everything you need to make your presentation stand out. Make a name out there for a brilliant performance. Following slide showcases process to automate various tasks involved in sales cycle to ensure relevancy and operational efficiency.
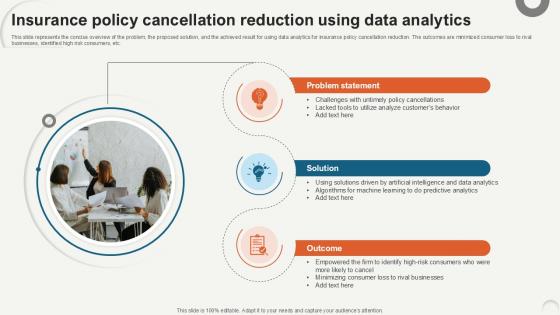
Insurance Policy Cancellation Reduction Data Analytics For Informed Decision Ppt PowerPoint
This slide represents the concise overview of the problem, the proposed solution, and the achieved result for using data analytics for insurance policy cancellation reduction. The outcomes are minimized consumer loss to rival businesses, identified high risk consumers, etc. This modern and well-arranged Insurance Policy Cancellation Reduction Data Analytics For Informed Decision Ppt PowerPoint provides lots of creative possibilities. It is very simple to customize and edit with the Powerpoint Software. Just drag and drop your pictures into the shapes. All facets of this template can be edited with Powerpoint, no extra software is necessary. Add your own material, put your images in the places assigned for them, adjust the colors, and then you can show your slides to the world, with an animated slide included. This slide represents the concise overview of the problem, the proposed solution, and the achieved result for using data analytics for insurance policy cancellation reduction. The outcomes are minimized consumer loss to rival businesses, identified high risk consumers, etc.

Advantages Of Leveraging Heuristics Analytics Data Analytics SS V
This slide outlines key advantages of leveraging heuristic analysis aimed at helping businesses improve decision making. It covers the benefits such as faster decisions, decisions with limited information and identification of errors Find a pre-designed and impeccable Advantages Of Leveraging Heuristics Analytics Data Analytics SS V. The templates can ace your presentation without additional effort. You can download these easy-to-edit presentation templates to make your presentation stand out from others. So, what are you waiting for Download the template from Slidegeeks today and give a unique touch to your presentation. This slide outlines key advantages of leveraging heuristic analysis aimed at helping businesses improve decision making. It covers the benefits such as faster decisions, decisions with limited information and identification of errors
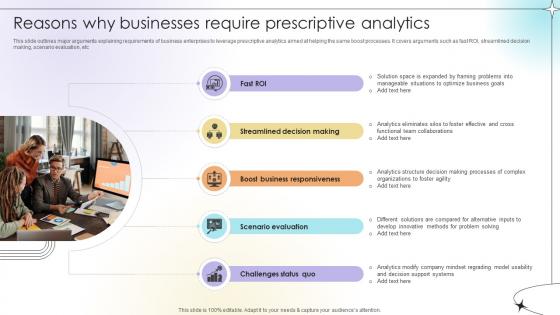
Reasons Why Businesses Require Prescriptive Analytics Data Analytics SS V
This slide outlines major arguments explaining requirements of business enterprises to leverage prescriptive analytics aimed at helping the same boost processes. It covers arguments such as fast ROI, streamlined decision making, scenario evaluation, etc.Here you can discover an assortment of the finest PowerPoint and Google Slides templates. With these templates, you can create presentations for a variety of purposes while simultaneously providing your audience with an eye-catching visual experience. Download Reasons Why Businesses Require Prescriptive Analytics Data Analytics SS V to deliver an impeccable presentation. These templates will make your job of preparing presentations much quicker, yet still, maintain a high level of quality. Slidegeeks has experienced researchers who prepare these templates and write high-quality content for you. Later on, you can personalize the content by editing the Reasons Why Businesses Require Prescriptive Analytics Data Analytics SS V. This slide outlines major arguments explaining requirements of business enterprises to leverage prescriptive analytics aimed at helping the same boost processes. It covers arguments such as fast ROI, streamlined decision making, scenario evaluation, etc.
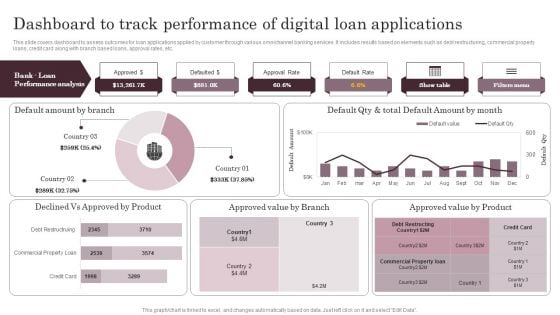
Dashboard To Track Performance Of Digital Loan Applications Pictures PDF
This slide covers dashboard to assess outcomes for loan applications applied by customer through various omnichannel banking services. It includes results based on elements such as debt restructuring, commercial property loans, credit card along with branch based loans, approval rates, etc. Find a pre designed and impeccable Dashboard To Track Performance Of Digital Loan Applications Pictures PDF. The templates can ace your presentation without additional effort. You can download these easy to edit presentation templates to make your presentation stand out from others. So, what are you waiting for Download the template from Slidegeeks today and give a unique touch to your presentation.
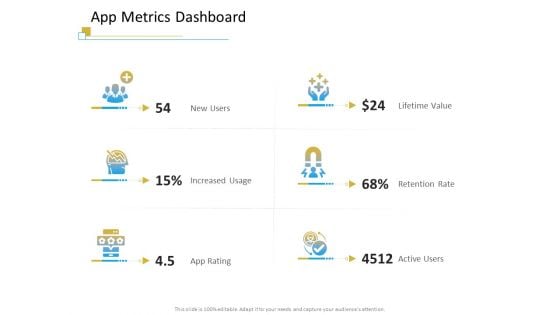
Successful Mobile Strategies For Business App Metrics Dashboard Microsoft PDF
Presenting successful mobile strategies for business app metrics dashboard microsoft pdf to provide visual cues and insights. Share and navigate important information on six stages that need your due attention. This template can be used to pitch topics like app metrics dashboard. In addtion, this PPT design contains high resolution images, graphics, etc, that are easily editable and available for immediate download.
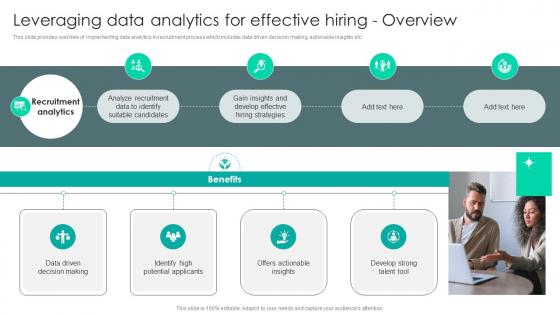
Strategic Staffing Using Data Leveraging Data Analytics For Effective Hiring Overview CRP DK SS V
This slide provides overview of implementing data analytics in recruitment process which includes data driven decision making, actionable insights etc. Here you can discover an assortment of the finest PowerPoint and Google Slides templates. With these templates, you can create presentations for a variety of purposes while simultaneously providing your audience with an eye-catching visual experience. Download Strategic Staffing Using Data Leveraging Data Analytics For Effective Hiring Overview CRP DK SS V to deliver an impeccable presentation. These templates will make your job of preparing presentations much quicker, yet still, maintain a high level of quality. Slidegeeks has experienced researchers who prepare these templates and write high-quality content for you. Later on, you can personalize the content by editing the Strategic Staffing Using Data Leveraging Data Analytics For Effective Hiring Overview CRP DK SS V. This slide provides overview of implementing data analytics in recruitment process which includes data driven decision making, actionable insights etc.

Global Social Media Advertising Industry Report Pdf Word Document
This Global Social Media Advertising Industry Report Pdf Word Document is designed to help you retain your audiences attention. This content-ready PowerPoint Template enables you to take your audience on a journey and share information in a way that is easier to recall. It helps you highlight the crucial parts of your work so that the audience does not get saddled with information download. This sixty slide PPT Deck comes prepared with the graphs and charts you could need to showcase your information through visuals. You only need to enter your own data in them. Download this editable PowerPoint Theme and walk into that meeting with confidence. Our Global Social Media Advertising Industry Report Pdf Word Document are topically designed to provide an attractive backdrop to any subject. Use them to look like a presentation pro.
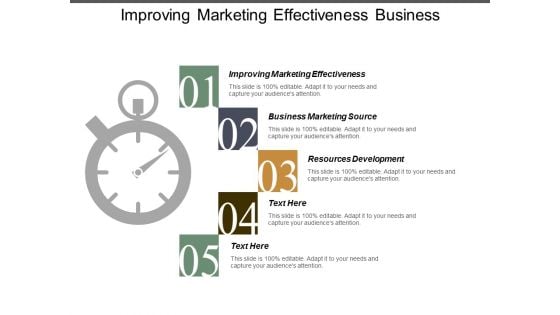
Improving Marketing Effectiveness Business Marketing Source Resources Development Ppt PowerPoint Presentation Gallery Master Slide
This is a improving marketing effectiveness business marketing source resources development ppt powerpoint presentation gallery master slide. This is a five stage process. The stages in this process are improving marketing effectiveness, business marketing source, resources development.

Big Data Management And Analytics Revolutionizing Production IoT Ppt Sample
The following slide is to represent big data management challenges faced in manufacturing facilities. It includes challenges such as data silos, poor data quality, etc. Do you have to make sure that everyone on your team knows about any specific topic I yes, then you should give Big Data Management And Analytics Revolutionizing Production IoT Ppt Sample a try. Our experts have put a lot of knowledge and effort into creating this impeccable Big Data Management And Analytics Revolutionizing Production IoT Ppt Sample. You can use this template for your upcoming presentations, as the slides are perfect to represent even the tiniest detail. You can download these templates from the Slidegeeks website and these are easy to edit. So grab these today The following slide is to represent big data management challenges faced in manufacturing facilities. It includes challenges such as data silos, poor data quality, etc.
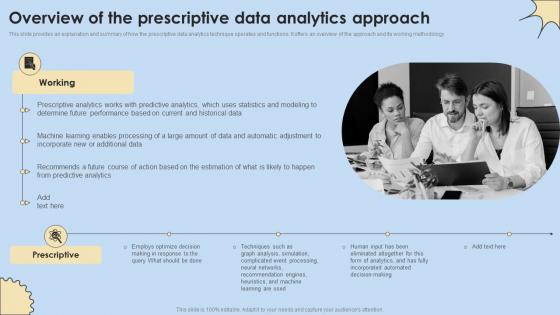
Overview Of The Prescriptive Data Analytics Approach Internet Things Analysis Demonstration Pdf
This slide provides an explanation and summary of how the prescriptive data analytics technique operates and functions. It offers an overview of the approach and its working methodology. Presenting this PowerPoint presentation, titled Overview Of The Prescriptive Data Analytics Approach Internet Things Analysis Demonstration Pdf, with topics curated by our researchers after extensive research. This editable presentation is available for immediate download and provides attractive features when used. Download now and captivate your audience. Presenting this Overview Of The Prescriptive Data Analytics Approach Internet Things Analysis Demonstration Pdf. Our researchers have carefully researched and created these slides with all aspects taken into consideration. This is a completely customizable Overview Of The Prescriptive Data Analytics Approach Internet Things Analysis Demonstration Pdf that is available for immediate downloading. Download now and make an impact on your audience. Highlight the attractive features available with our PPTs. This slide provides an explanation and summary of how the prescriptive data analytics technique operates and functions. It offers an overview of the approach and its working methodology.
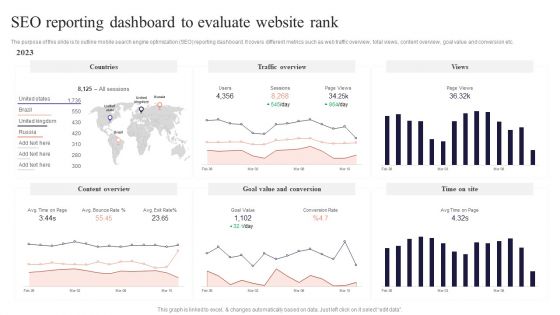
SEO Reporting Dashboard To Evaluate Website Rank Performing Mobile SEO Audit To Analyze Web Traffic Inspiration PDF
The purpose of this slide is to outline mobile search engine optimization SEO reporting dashboard. It covers different metrics such as web traffic overview, total views, content overview, goal value and conversion etc. The SEO Reporting Dashboard To Evaluate Website Rank Performing Mobile SEO Audit To Analyze Web Traffic Inspiration PDF is a compilation of the most recent design trends as a series of slides. It is suitable for any subject or industry presentation, containing attractive visuals and photo spots for businesses to clearly express their messages. This template contains a variety of slides for the user to input data, such as structures to contrast two elements, bullet points, and slides for written information. Slidegeeks is prepared to create an impression.
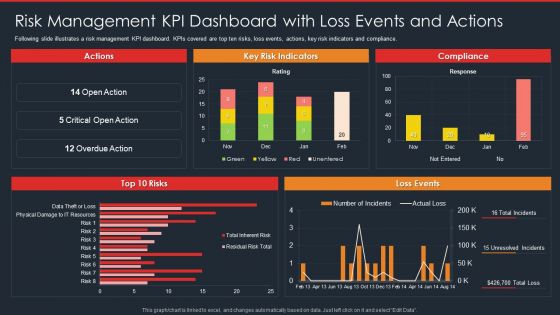
Data Safety Initiatives Risk Management KPI Dashboard With Loss Events And Actions Rules PDF
Following slide illustrates a risk management KPI dashboard. KPIs covered are top ten risks, loss events, actions, key risk indicators and compliance. Deliver an awe inspiring pitch with this creativedata safety initiatives overview of new it policy framework pictures pdf bundle. Topics like actions, key risk indicators, compliance, top 10 risks, loss events can be discussed with this completely editable template. It is available for immediate download depending on the needs and requirements of the user.
Augmented Technologies Data And Analytics Management Icon Template Pdf
Pitch your topic with ease and precision using this Augmented Technologies Data And Analytics Management Icon Template Pdf. This layout presents information on Augmented Technologies Data, Analytics Management Icon. It is also available for immediate download and adjustment. So, changes can be made in the color, design, graphics or any other component to create a unique layout. Our Augmented Technologies Data And Analytics Management Icon Template Pdf are topically designed to provide an attractive backdrop to any subject. Use them to look like a presentation pro.
Dashboard Tracking Warehouse Capacity And Utilization Metrics Icons PDF
This slide represents a dashboard providing an enterprise-level view of warehouse capacity and utilization to enable process improvements. It monitors KPIs such as shelf capacity used by inventory type, storage device, honeycomb percentage, days on hand by inventory type, and by items. Create an editable Dashboard Tracking Warehouse Capacity And Utilization Metrics Icons PDF that communicates your idea and engages your audience. Whether you are presenting a business or an educational presentation, pre-designed presentation templates help save time. Dashboard Tracking Warehouse Capacity And Utilization Metrics Icons PDF is highly customizable and very easy to edit, covering many different styles from creative to business presentations. Slidegeeks has creative team members who have crafted amazing templates. So, go and get them without any delay.
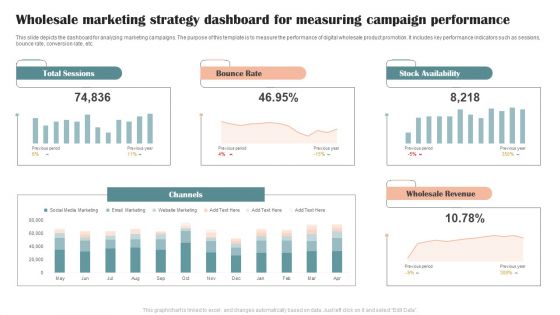
Wholesale Marketing Strategy Dashboard For Measuring Campaign Performance Graphics PDF
This slide depicts the dashboard for analyzing marketing campaigns. The purpose of this template is to measure the performance of digital wholesale product promotion. It includes key performance indicators such as sessions, bounce rate, conversion rate, etc. Showcasing this set of slides titled Wholesale Marketing Strategy Dashboard For Measuring Campaign Performance Graphics PDF. The topics addressed in these templates are Total Sessions, Bounce Rate, Stock Availability. All the content presented in this PPT design is completely editable. Download it and make adjustments in color, background, font etc. as per your unique business setting.
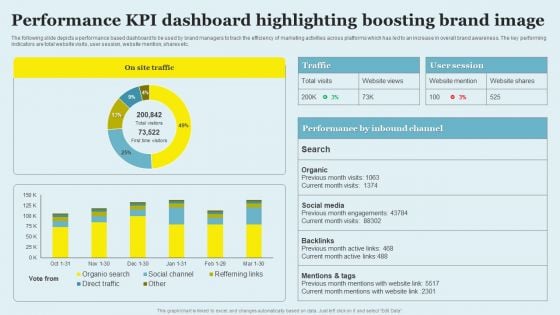
Performance KPI Dashboard Highlighting Boosting Brand Image Sample PDF
The following slide depicts a performance based dashboard to be used by brand managers to track the efficiency of marketing activities across platforms which has led to an increase in overall brand awareness. The key performing indicators are total website visits, user session, website mention, shares etc. Showcasing this set of slides titled Performance KPI Dashboard Highlighting Boosting Brand Image Sample PDF. The topics addressed in these templates are Social Media, Backlinks, Mentions Tags. All the content presented in this PPT design is completely editable. Download it and make adjustments in color, background, font etc. as per your unique business setting.
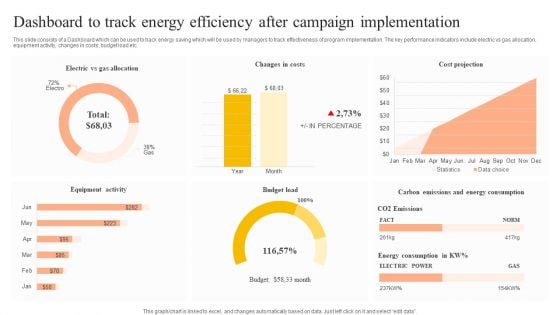
Dashboard To Track Energy Efficiency After Campaign Implementation Pictures PDF
This slide consists of a Dashboard which can be used to track energy saving which will be used by managers to track effectiveness of program implementation. The key performance indicators include electric vs gas allocation, equipment activity, changes in costs, budget load etc. Showcasing this set of slides titled Dashboard To Track Energy Efficiency After Campaign Implementation Pictures PDF. The topics addressed in these templates are Equipment Activity, Budget Load, Cost Projection. All the content presented in this PPT design is completely editable. Download it and make adjustments in color, background, font etc. as per your unique business setting.
Cloud Based Computing Analysis Cloud Performance Tracking Dashboard Structure PDF
This slide covers the key performance indicators for tracking performance of the cloud such as violations break down, sources, rules and severity. Get a simple yet stunning designed Cloud Based Computing Analysis Cloud Performance Tracking Dashboard Structure PDF. It is the best one to establish the tone in your meetings. It is an excellent way to make your presentations highly effective. So, download this PPT today from Slidegeeks and see the positive impacts. Our easy-to-edit Cloud Based Computing Analysis Cloud Performance Tracking Dashboard Structure PDF can be your go-to option for all upcoming conferences and meetings. So, what are you waiting for Grab this template today.

Introduction To Text Analytics Process For Data Analysis PPT Example SS
This slide gives an overview of the text analytics process used to generate meaningful information from unstructured text documents. The best PPT templates are a great way to save time, energy, and resources. Slidegeeks have 100 percent editable powerpoint slides making them incredibly versatile. With these quality presentation templates, you can create a captivating and memorable presentation by combining visually appealing slides and effectively communicating your message. Download Introduction To Text Analytics Process For Data Analysis PPT Example SS from Slidegeeks and deliver a wonderful presentation. This slide gives an overview of the text analytics process used to generate meaningful information from unstructured text documents.
KPIs Metrics In Dashboard Vector Icon Ppt PowerPoint Presentation Portfolio Graphics Download PDF
Presenting kpis metrics in dashboard vector icon ppt powerpoint presentation portfolio graphics download pdf to dispense important information. This template comprises three stages. It also presents valuable insights into the topics including kpis metrics in dashboard vector icon. This is a completely customizable PowerPoint theme that can be put to use immediately. So, download it and address the topic impactfully.

Annual Business Financial Summary Dashboard Themes PDF
This slide shows annual financial report dashboard of company to monitor yearly business performance. It includes various indicators such as revenue, net profits, costs and breakdown of cost. Showcasing this set of slides titled Annual Business Financial Summary Dashboard Themes PDF. The topics addressed in these templates are Revenue, Costs, Net Profit. All the content presented in this PPT design is completely editable. Download it and make adjustments in color, background, font etc. as per your unique business setting.
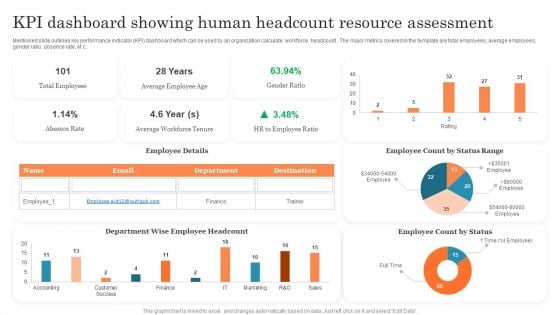
KPI Dashboard Showing Human Headcount Resource Assessment Ppt PowerPoint Presentation Outline PDF
Mentioned slide outlines key performance indicator KPI dashboard which can be used by an organization calculate workforce headcount . The major metrics covered in the template are total employees, average employees, gender ratio, absence rate, etc. Pitch your topic with ease and precision using this KPI Dashboard Showing Human Headcount Resource Assessment Ppt PowerPoint Presentation Outline PDF. This layout presents information on Total Employees, Average Employee, Employee Count. It is also available for immediate download and adjustment. So, changes can be made in the color, design, graphics or any other component to create a unique layout.
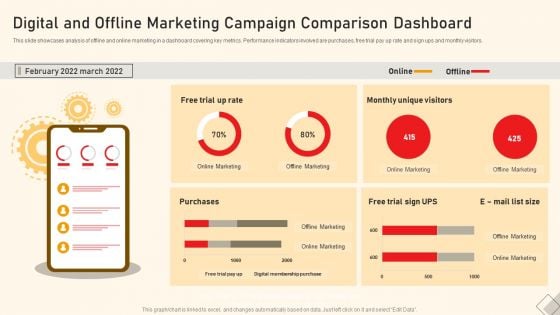
Digital And Offline Marketing Campaign Comparison Dashboard Ppt Inspiration Microsoft PDF
This slide showcases analysis of offline and online marketing in a dashboard covering key metrics. Performance indicators involved are purchases, free trial pay up rate and sign ups and monthly visitors. Pitch your topic with ease and precision using this Digital And Offline Marketing Campaign Comparison Dashboard Ppt Inspiration Microsoft PDF. This layout presents information on Online Marketing, Offline Marketing, Free Trial Sign, UPS. It is also available for immediate download and adjustment. So, changes can be made in the color, design, graphics or any other component to create a unique layout.
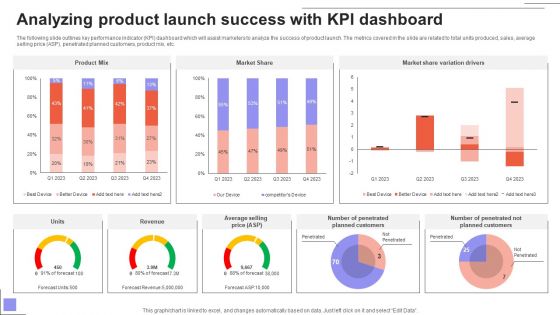
Overview Of The Food Analyzing Product Launch Success With KPI Dashboard Mockup PDF
The following slide outlines key performance indicator KPI dashboard which will assist marketers to analyze the success of product launch. The metrics covered in the slide are related to total units produced, sales, average selling price ASP, penetrated planned customers, product mix, etc. Find a pre-designed and impeccable Overview Of The Food Analyzing Product Launch Success With KPI Dashboard Mockup PDF. The templates can ace your presentation without additional effort. You can download these easy-to-edit presentation templates to make your presentation stand out from others. So, what are you waiting for Download the template from Slidegeeks today and give a unique touch to your presentation.
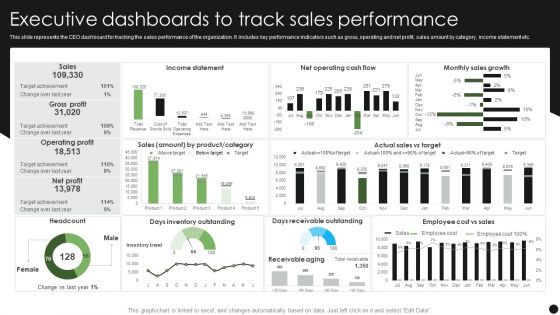
Executive Dashboards To Track Sales Performance Guidelines PDF
This slide represents the CEO dashboard for tracking the sales performance of the organization. It includes key performance indicators such as gross, operating and net profit, sales amount by category, income statement etc. Pitch your topic with ease and precision using this Executive Dashboards To Track Sales Performance Guidelines PDF. This layout presents information on Income Statement, Monthly Sales Growth, Days Receivable Outstanding. It is also available for immediate download and adjustment. So, changes can be made in the color, design, graphics or any other component to create a unique layout.
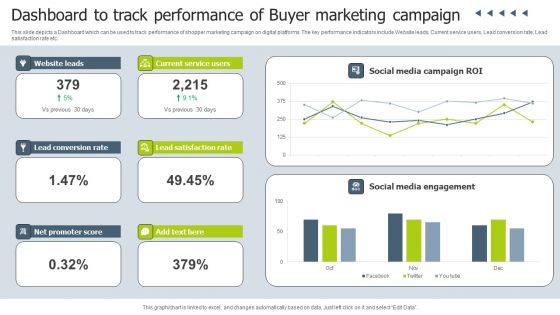
Dashboard To Track Performance Of Buyer Marketing Campaign Infographics PDF
This slide depicts a Dashboard which can be used to track performance of shopper marketing campaign on digital platforms. The key performance indicators include Website leads, Current service users, Lead conversion rate, Lead satisfaction rate etc. Pitch your topic with ease and precision using this Dashboard To Track Performance Of Buyer Marketing Campaign Infographics PDF. This layout presents information on Social Media Campaign, Social Media Engagement, Current Service Users. It is also available for immediate download and adjustment. So, changes can be made in the color, design, graphics or any other component to create a unique layout.
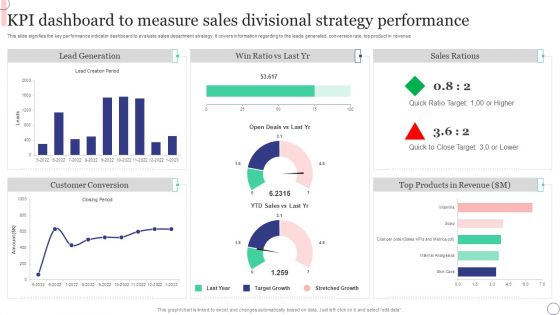
KPI Dashboard To Measure Sales Divisional Strategy Performance Microsoft PDF
This slide signifies the key performance indicator dashboard to evaluate sales department strategy. It covers information regarding to the leads generated, conversion rate, top product in revenue. Pitch your topic with ease and precision using this KPI Dashboard To Measure Sales Divisional Strategy Performance Microsoft PDF. This layout presents information on Sales Rations, Lead Generation, Customer Conversion. It is also available for immediate download and adjustment. So, changes can be made in the color, design, graphics or any other component to create a unique layout.
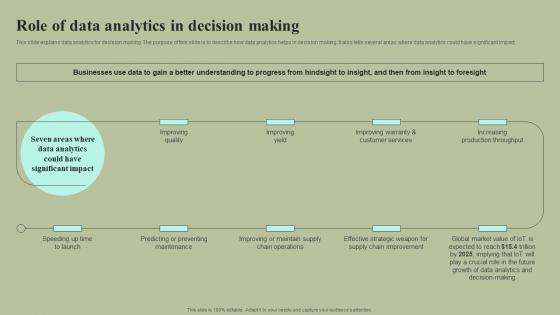
Role Of Data Analytics In Decision Making Cybernetic Integration Designs Pdf
This slide explains data analytics for decision making. The purpose of this slide is to describe how data analytics helps in decision making. It also tells several areas where data analytics could have significant impact. Crafting an eye-catching presentation has never been more straightforward. Let your presentation shine with this tasteful yet straightforward Role Of Data Analytics In Decision Making Cybernetic Integration Designs Pdf template. It offers a minimalistic and classy look that is great for making a statement. The colors have been employed intelligently to add a bit of playfulness while still remaining professional. Construct the ideal Role Of Data Analytics In Decision Making Cybernetic Integration Designs Pdf that effortlessly grabs the attention of your audience. Begin now and be certain to wow your customers. This slide explains data analytics for decision making. The purpose of this slide is to describe how data analytics helps in decision making. It also tells several areas where data analytics could have significant impact.
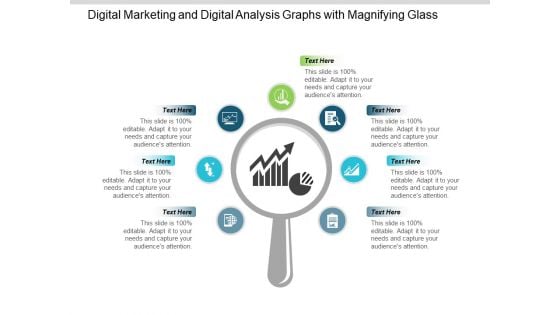
Digital Marketing And Digital Analysis Graphs With Magnifying Glass Ppt PowerPoint Presentation Portfolio Show
This is a digital marketing and digital analysis graphs with magnifying glass ppt powerpoint presentation portfolio show. This is a seven stage process. The stages in this process are digital analytics, digital dashboard, marketing.
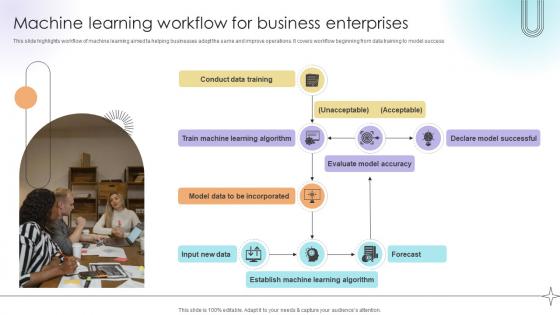
Machine Learning Workflow For Business Enterprises Data Analytics SS V
This slide highlights workflow of machine learning aimed ta helping businesses adopt the same and improve operations. It covers workflow beginning from data training to model success.If you are looking for a format to display your unique thoughts, then the professionally designed Machine Learning Workflow For Business Enterprises Data Analytics SS V is the one for you. You can use it as a Google Slides template or a PowerPoint template. Incorporate impressive visuals, symbols, images, and other charts. Modify or reorganize the text boxes as you desire. Experiment with shade schemes and font pairings. Alter, share or cooperate with other people on your work. Download Machine Learning Workflow For Business Enterprises Data Analytics SS V and find out how to give a successful presentation. Present a perfect display to your team and make your presentation unforgettable. This slide highlights workflow of machine learning aimed ta helping businesses adopt the same and improve operations. It covers workflow beginning from data training to model success.
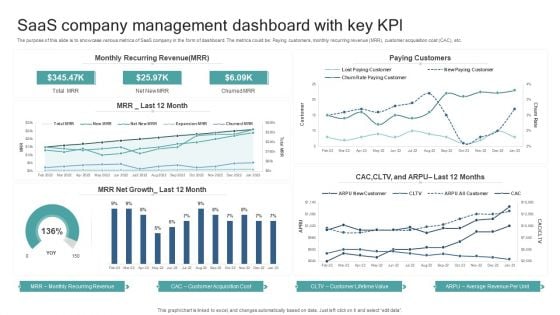
Saas Company Management Dashboard With Key Kpl Template PDF
The purpose of this slide is to showcase various metrics of SaaS company in the form of dashboard. The metrics could be, Paying customers, monthly recurring revenue MRR, customer acquisition cost CAC, etc. Showcasing this set of slides titled Saas Company Management Dashboard With Key Kpl Template PDF. The topics addressed in these templates are Monthly Recurring Revenue, Customer Acquisition Cost, Customer Lifetime Value, Average Revenue Per Unit. All the content presented in this PPT design is completely editable. Download it and make adjustments in color, background, font etc. as per your unique business setting.
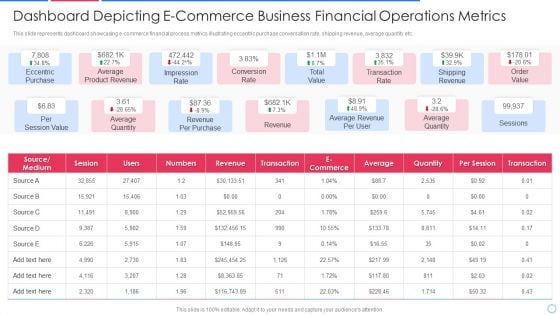
Dashboard Depicting E-Commerce Business Financial Operations Metrics Topics PDF
This slide represents dashboard showcasing e-commerce financial process metrics illustrating eccentric purchase conversation rate, shipping revenue, average quantity etc.Showcasing this set of slides titled dashboard depicting e-commerce business financial operations metrics topics pdf The topics addressed in these templates are eccentric purchase, average product revenue, impression rate All the content presented in this PPT design is completely editable. Download it and make adjustments in color, background, font etc. as per your unique business setting.
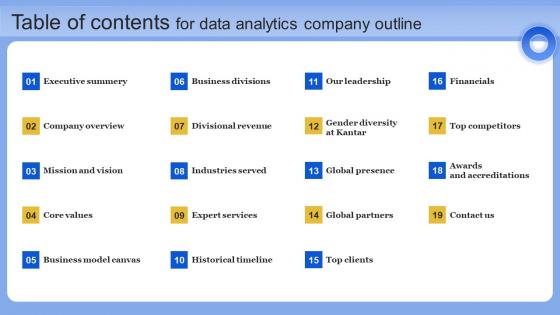
Table Of Contents For Data Analytics Company Outline Formats PDF
Take your projects to the next level with our ultimate collection of Table Of Contents For Data Analytics Company Outline Formats PDF Slidegeeks has designed a range of layouts that are perfect for representing task or activity duration, keeping track of all your deadlines at a glance. Tailor these designs to your exact needs and give them a truly corporate look with your own brand colors they will make your projects stand out from the rest Our Table Of Contents For Data Analytics Company Outline Formats PDF are topically designed to provide an attractive backdrop to any subject. Use them to look like a presentation pro.
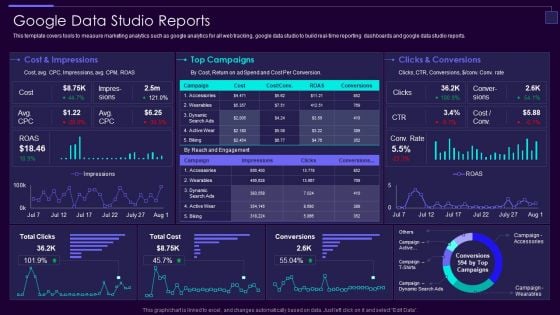
Social Media Brand Promotion Instructions Playbook Google Data Studio Reports Formats PDF
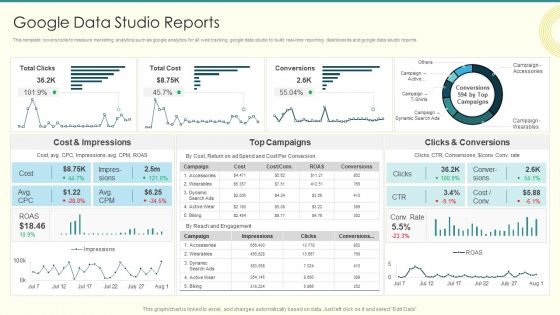
This template covers tools to measure marketing analytics such as google analytics for all web tracking, google data studio to build real-time reporting dashboards and google data studio reports.Deliver an awe inspiring pitch with this creative Social Media Brand Promotion Instructions Playbook Google Data Studio Reports Formats PDF bundle. Topics like Conversions, Cost And Impressions, Top Campaigns can be discussed with this completely editable template. It is available for immediate download depending on the needs and requirements of the user.
Security And Performance Digital Marketing Google Data Studio Reports Brochure PDF
This template covers tools to measure marketing analytics such as google analytics for all web tracking, google data studio to build real-time reporting dashboards and google data studio reports.Deliver an awe inspiring pitch with this creative Security And Performance Digital Marketing Google Data Studio Reports Brochure PDF bundle. Topics like Impressions, Clicks Conversions, Cost Impressions can be discussed with this completely editable template. It is available for immediate download depending on the needs and requirements of the user.
Applications Of Simulation Analysis In Various Areas Data Analytics SS V
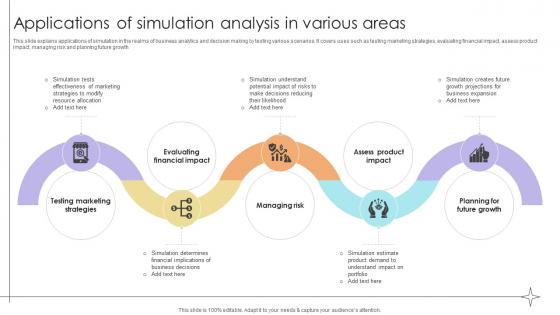
This slide explains applications of simulation in the realms of business analytics and decision making by testing various scenarios. It covers uses such as testing marketing strategies, evaluating financial impact, assess product impact, managing risk and planning future growth.Whether you have daily or monthly meetings, a brilliant presentation is necessary. Applications Of Simulation Analysis In Various Areas Data Analytics SS V can be your best option for delivering a presentation. Represent everything in detail using Applications Of Simulation Analysis In Various Areas Data Analytics SS V and make yourself stand out in meetings. The template is versatile and follows a structure that will cater to your requirements. All the templates prepared by Slidegeeks are easy to download and edit. Our research experts have taken care of the corporate themes as well. So, give it a try and see the results. This slide explains applications of simulation in the realms of business analytics and decision making by testing various scenarios. It covers uses such as testing marketing strategies, evaluating financial impact, assess product impact, managing risk and planning future growth.
User Analysis Kpis And Metrics Dashboard Ppt PowerPoint Presentation Portfolio Summary PDF
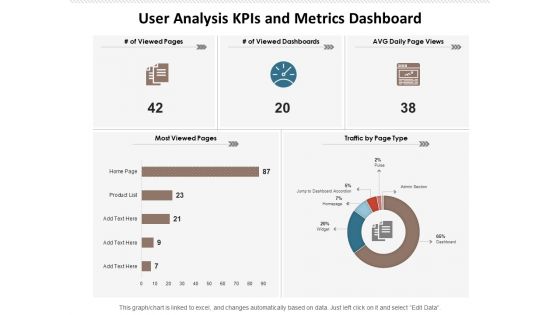
Presenting this set of slides with name user analysis kpis and metrics dashboard ppt powerpoint presentation portfolio summary pdf. The topics discussed in these slides are viewed pages, viewed dashboards, avg daily page views, most viewed pages, traffic by page type. This is a completely editable PowerPoint presentation and is available for immediate download. Download now and impress your audience.

Stopwatch For Speed Calculation Powerpoint Slides
This innovative, stunningly beautiful dashboard has been designed for speed calculation. It contains graphics of stopwatch. This PowerPoint template helps to display your information in a useful, simple and orderly way.


 Continue with Email

 Home
Home


