Snapshot
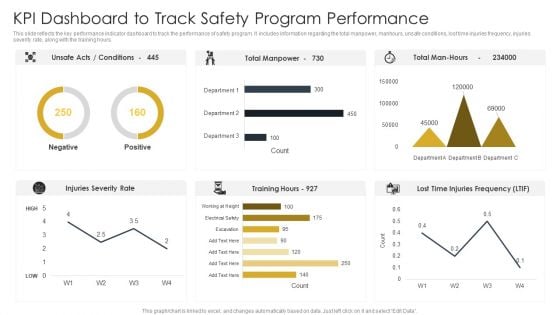
Kpi Dashboard To Track Safety Program Performance Construction Site Safety Plan Summary PDF
This slide reflects the key performance indicator dashboard to track the performance of safety program. It includes information regarding the total manpower, manhours, unsafe conditions, lost time injuries frequency, injuries severity rate, along with the training hours. The Kpi Dashboard To Track Safety Program Performance Construction Site Safety Plan Summary PDF is a compilation of the most recent design trends as a series of slides. It is suitable for any subject or industry presentation, containing attractive visuals and photo spots for businesses to clearly express their messages. This template contains a variety of slides for the user to input data, such as structures to contrast two elements, bullet points, and slides for written information. Slidegeeks is prepared to create an impression.
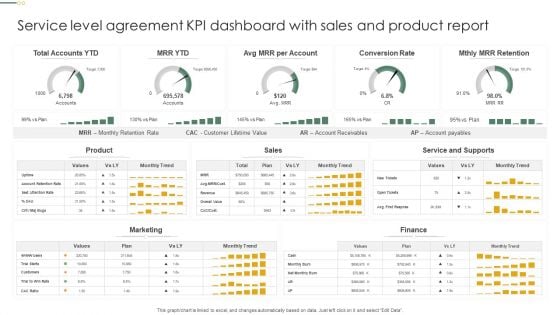
Service Level Agreement KPI Dashboard With Sales And Product Report Clipart PDF
This graph or chart is linked to excel, and changes automatically based on data. Just left click on it and select Edit Data. Showcasing this set of slides titled Service Level Agreement KPI Dashboard With Sales And Product Report Clipart PDF. The topics addressed in these templates are Total Accounts YTD, Conversion Rate, Mthly MRR Retention. All the content presented in this PPT design is completely editable. Download it and make adjustments in color, background, font etc. as per your unique business setting.
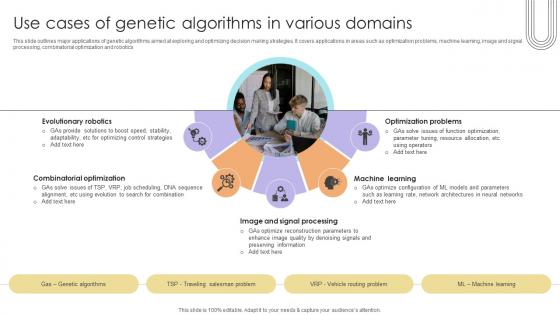
Use Cases Of Genetic Algorithms In Various Domains Data Analytics SS V
This slide outlines major applications of genetic algorithms aimed at exploring and optimizing decision making strategies. It covers applications in areas such as optimization problems, machine learning, image and signal processing, combinatorial optimization and robotics.Are you searching for a Use Cases Of Genetic Algorithms In Various Domains Data Analytics SS V that is uncluttered, straightforward, and original Its easy to edit, and you can change the colors to suit your personal or business branding. For a presentation that expresses how much effort you have put in, this template is ideal With all of its features, including tables, diagrams, statistics, and lists, its perfect for a business plan presentation. Make your ideas more appealing with these professional slides. Download Use Cases Of Genetic Algorithms In Various Domains Data Analytics SS V from Slidegeeks today. This slide outlines major applications of genetic algorithms aimed at exploring and optimizing decision making strategies. It covers applications in areas such as optimization problems, machine learning, image and signal processing, combinatorial optimization and robotics.
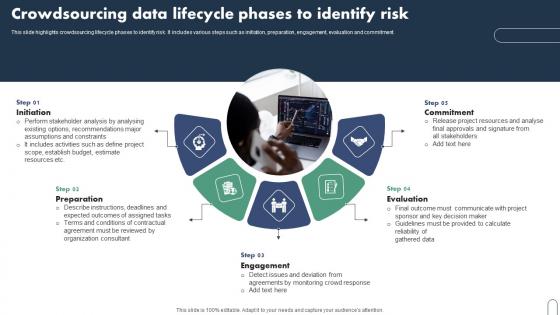
Crowdsourcing Data Lifecycle Phases To Identify Risk Pictures Pdf
This slide highlights crowdsourcing lifecycle phases to identify risk. It includes various steps such as initiation, preparation, engagement, evaluation and commitment. Pitch your topic with ease and precision using this Crowdsourcing Data Lifecycle Phases To Identify Risk Pictures Pdf This layout presents information on Preparation, Engagement, Evaluation, Commitment It is also available for immediate download and adjustment. So, changes can be made in the color, design, graphics or any other component to create a unique layout. This slide highlights crowdsourcing lifecycle phases to identify risk. It includes various steps such as initiation, preparation, engagement, evaluation and commitment.
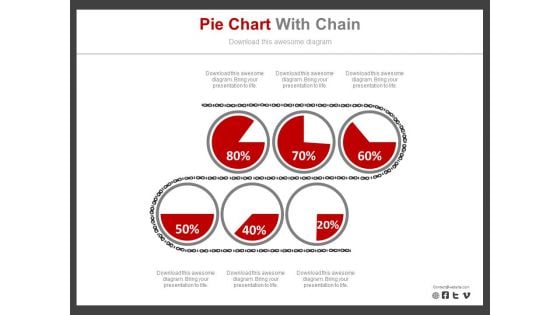
Six Pie Charts For Revenue Analysis Report Powerpoint Slides
Six pie charts have been displayed in this business slide. This business diagram helps to exhibit revenue analysis report. Download this PowerPoint template to build an exclusive presentation.
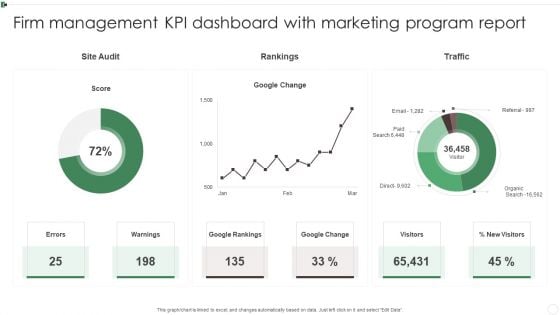
Firm Management KPI Dashboard With Marketing Program Report Ppt Styles Introduction PDF
This graph or chart is linked to excel, and changes automatically based on data. Just left click on it and select Edit Data. Showcasing this set of slides titled Firm Management KPI Dashboard With Marketing Program Report Ppt Styles Introduction PDF. The topics addressed in these templates are Google Rankings, Google Change, Warnings, Visitors. All the content presented in this PPT design is completely editable. Download it and make adjustments in color, background, font etc. as per your unique business setting.
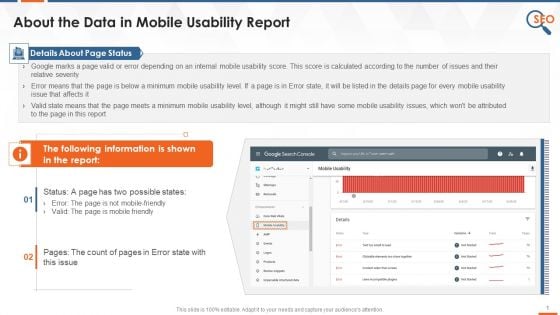
How To Read Data In Mobile Usability Report In Google Search Console Training Ppt
This slide covers details about how to read mobile usability report in google search console. It also includes details about page status such as error and valid.
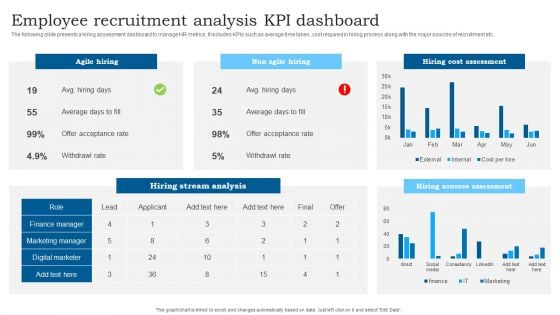
Employee Recruitment Analysis KPI Dashboard Slides PDF
The following slide presents a hiring assessment dashboard to manage HR metrics. It includes KPIs such as average time taken, cost required in hiring process along with the major sources of recruitment etc. Pitch your topic with ease and precision using this Employee Recruitment Analysis KPI Dashboard Slides PDF. This layout presents information on Agile Hiring, Non Agile Hiring, Hiring Cost Assessment. It is also available for immediate download and adjustment. So, changes can be made in the color, design, graphics or any other component to create a unique layout.
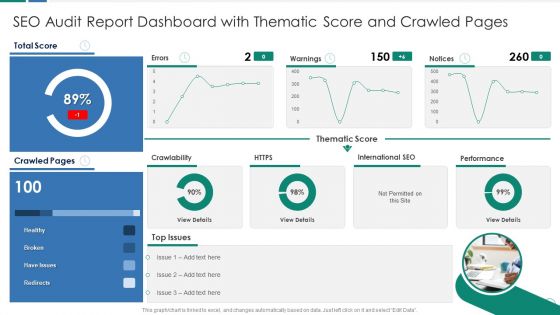
SEO Audit Report Dashboard With Thematic Score And Crawled Pages Download PDF
This graph or chart is linked to excel, and changes automatically based on data. Just left click on it and select Edit Data. Deliver and pitch your topic in the best possible manner with this SEO Audit Report Dashboard With Thematic Score And Crawled Pages Download PDF. Use them to share invaluable insights on Thematic Score Warnings, International SEO Performance, Total Score Healthy and impress your audience. This template can be altered and modified as per your expectations. So, grab it now.
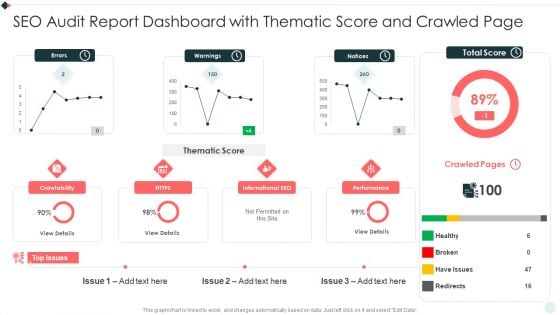
SEO Audit Summary To Increase SEO Audit Report Dashboard With Thematic Score Download PDF
This graph or chart is linked to excel, and changes automatically based on data. Just left click on it and select Edit Data. Deliver an awe inspiring pitch with this creative SEO Audit Summary To Increase SEO Audit Report Dashboard With Thematic Score Download PDF bundle. Topics like Total Score, Crawled Pages, Top Issues can be discussed with this completely editable template. It is available for immediate download depending on the needs and requirements of the user.
Market Penetration Dashboard With Population Metrics Ppt Icon Graphics Design PDF
This slide shows market penetration dashboard with key demographics. It provides information about census population, per capita income, leads to be penetrated and footfall. Showcasing this set of slides titled Market Penetration Dashboard With Population Metrics Ppt Icon Graphics Design PDF. The topics addressed in these templates are Census Population, Per Capita Income, Footfall. All the content presented in this PPT design is completely editable. Download it and make adjustments in color, background, font etc. as per your unique business setting.
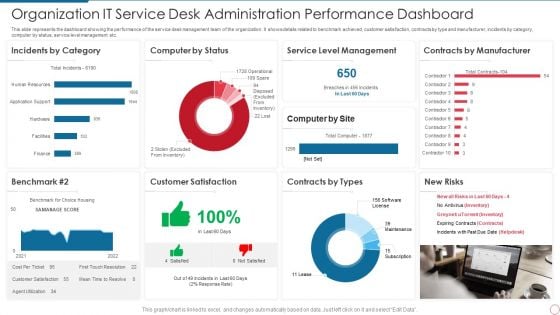
Organization IT Service Desk Administration Performance Dashboard Infographics PDF
This slide represents the dashboard showing the performance of the service desk management team of the organization. It shows details related to benchmark achieved, customer satisfaction, contracts by type and manufacturer, incidents by category, computer by status, service level management etc. Showcasing this set of slides titled Organization IT Service Desk Administration Performance Dashboard Infographics PDF. The topics addressed in these templates are Service, Management, Manufacturer. All the content presented in this PPT design is completely editable. Download it and make adjustments in color, background, font etc. as per your unique business setting.
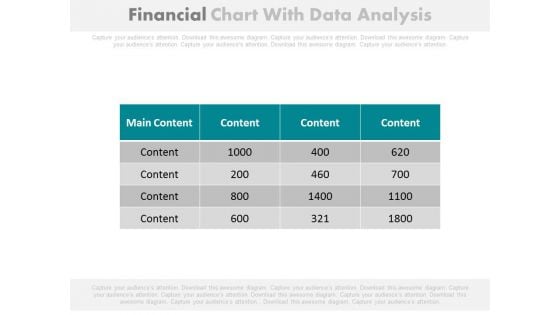
Financial Figures Data Analysis Report Powerpoint Slides
Our above PowerPoint template contains table chart with financial figures. This professional slide may be used to display data analysis report. Enlighten your audience with your breathtaking ideas.
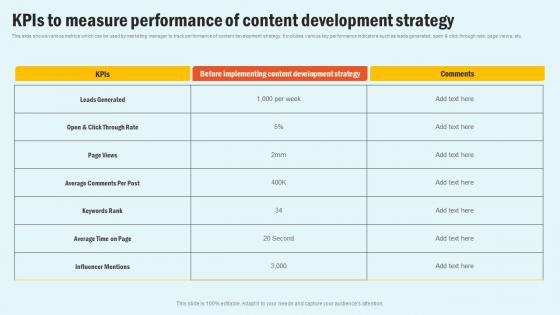
KPIs To Measure Performance Of Enhancing Website Performance With Search Engine Content Elements Pdf
This slide shows various metrics which can be used by marketing manager to track performance of content development strategy. It includes various key performance indicators such as leads generated, open and click through rate, page views, etc. Explore a selection of the finest KPIs To Measure Performance Of Enhancing Website Performance With Search Engine Content Elements Pdf here. With a plethora of professionally designed and pre made slide templates, you can quickly and easily find the right one for your upcoming presentation. You can use our KPIs To Measure Performance Of Enhancing Website Performance With Search Engine Content Elements Pdf to effectively convey your message to a wider audience. Slidegeeks has done a lot of research before preparing these presentation templates. The content can be personalized and the slides are highly editable. Grab templates today from Slidegeeks. This slide shows various metrics which can be used by marketing manager to track performance of content development strategy. It includes various key performance indicators such as leads generated, open and click through rate, page views, etc.
Market Trends Chart With Icons Powerpoint Slides
This PowerPoint template has been designed with business info graphic chart. You may use this business slide design to display market trends. This PPT slide is powerful tool to describe your ideas.
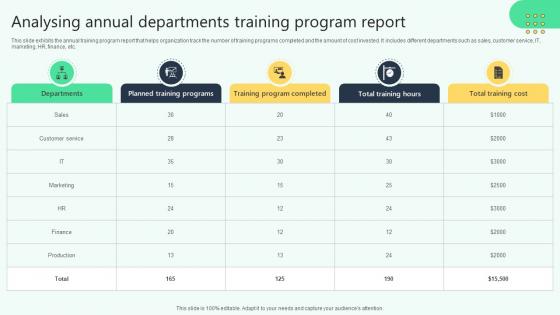
Analysing Annual Departments Training Program Report Analysing Hr Data For Effective Decision Making
This slide exhibits the annual training program report that helps organization track the number of training programs completed and the amount of cost invested. It includes different departments such as sales, customer service, IT, marketing, HR, finance, etc. Slidegeeks is one of the best resources for PowerPoint templates. You can download easily and regulate Analysing Annual Departments Training Program Report Analysing Hr Data For Effective Decision Making for your personal presentations from our wonderful collection. A few clicks is all it takes to discover and get the most relevant and appropriate templates. Use our Templates to add a unique zing and appeal to your presentation and meetings. All the slides are easy to edit and you can use them even for advertisement purposes. This slide exhibits the annual training program report that helps organization track the number of training programs completed and the amount of cost invested. It includes different departments such as sales, customer service, IT, marketing, HR, finance, etc.
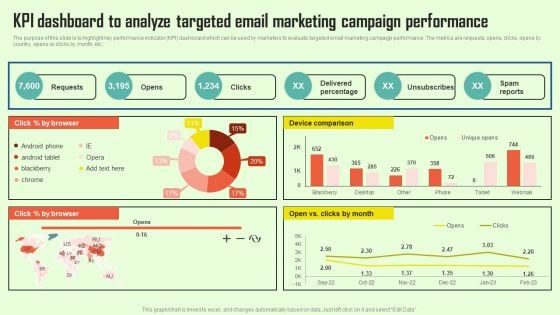
Increasing Consumer Engagement With Database KPI Dashboard To Analyze Targeted Email Infographics PDF
The purpose of this slide is to highlight key performance indicator KPI dashboard which can be used by marketers to evaluate targeted email marketing campaign performance. The metrics are requests, opens, clicks, opens by country, opens vs clicks by month, etc. This modern and well arranged Increasing Consumer Engagement With Database KPI Dashboard To Analyze Targeted Email Infographics PDF provides lots of creative possibilities. It is very simple to customize and edit with the Powerpoint Software. Just drag and drop your pictures into the shapes. All facets of this template can be edited with Powerpoint no extra software is necessary. Add your own material, put your images in the places assigned for them, adjust the colors, and then you can show your slides to the world, with an animated slide included.
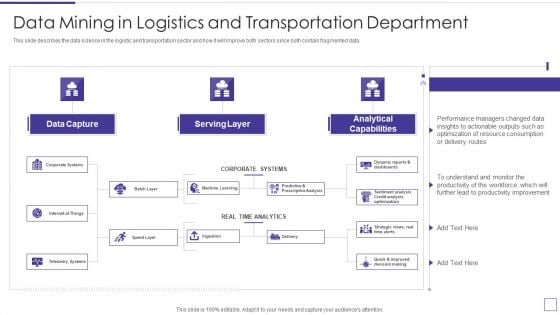
Data Mining Implementation Data Mining In Logistics And Transportation Department Information PDF
This slide describes the data science in the logistic and transportation sector and how it will improve both sectors since both contain fragmented data.Deliver an awe inspiring pitch with this creative data mining implementation data mining in logistics and transportation department information pdf bundle. Topics like dynamic reports and dashboards, predictive and prescriptive analysis, strategic views real time alerts can be discussed with this completely editable template. It is available for immediate download depending on the needs and requirements of the user.
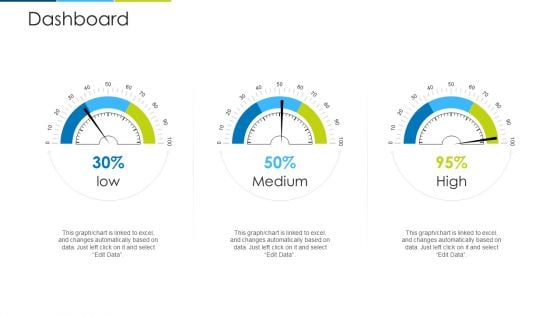
Dashboard Ppt Pictures Example PDF
Deliver an awe inspiring pitch with this creative dashboard ppt pictures example pdf bundle. Topics like dashboard can be discussed with this completely editable template. It is available for immediate download depending on the needs and requirements of the user.
Work From Home Performance Management Dashboard Icons PDF
The following slide outlines a comprehensive key performance indicator KPI dashboard that can be used to showcase employees performance during work from home WFH. Information covered in this slide is related to average result area scores etc. Do you have to make sure that everyone on your team knows about any specific topic. I yes, then you should give Work From Home Performance Management Dashboard Icons PDF a try. Our experts have put a lot of knowledge and effort into creating this impeccable Work From Home Performance Management Dashboard Icons PDF. You can use this template for your upcoming presentations, as the slides are perfect to represent even the tiniest detail. You can download these templates from the Slidegeeks website and these are easy to edit. So grab these today.
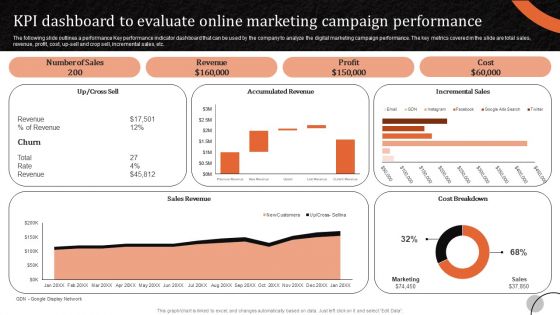
Marketing Tactics To Increase KPI Dashboard To Evaluate Online Marketing Campaign Infographics PDF
The following slide outlines a performance Key performance indicator dashboard that can be used by the company to analyze the digital marketing campaign performance. The key metrics covered in the slide are total sales, revenue, profit, cost, up-sell and crop sell, incremental sales, etc. Want to ace your presentation in front of a live audience Our Marketing Tactics To Increase KPI Dashboard To Evaluate Online Marketing Campaign Infographics PDF can help you do that by engaging all the users towards you. Slidegeeks experts have put their efforts and expertise into creating these impeccable powerpoint presentations so that you can communicate your ideas clearly. Moreover, all the templates are customizable, and easy-to-edit and downloadable. Use these for both personal and commercial use.
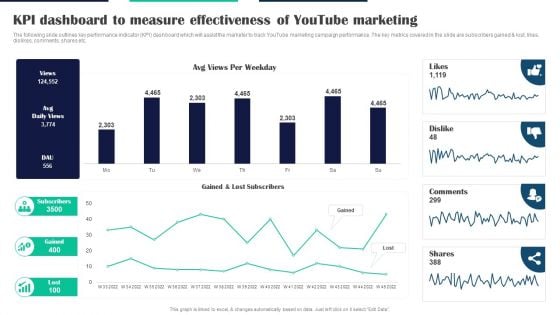
Executing Video Promotional KPI Dashboard To Measure Effectiveness Of Youtube Marketing Professional PDF
The following slide outlines key performance indicator KPI dashboard which will assist the marketer to track YouTube marketing campaign performance. The key metrics covered in the slide are subscribers gained and lost, likes, dislikes, comments, shares etc. Formulating a presentation can take up a lot of effort and time, so the content and message should always be the primary focus. The visuals of the PowerPoint can enhance the presenters message, so our Executing Video Promotional KPI Dashboard To Measure Effectiveness Of Youtube Marketing Professional PDF was created to help save time. Instead of worrying about the design, the presenter can concentrate on the message while our designers work on creating the ideal templates for whatever situation is needed. Slidegeeks has experts for everything from amazing designs to valuable content, we have put everything into Executing Video Promotional KPI Dashboard To Measure Effectiveness Of Youtube Marketing Professional PDF
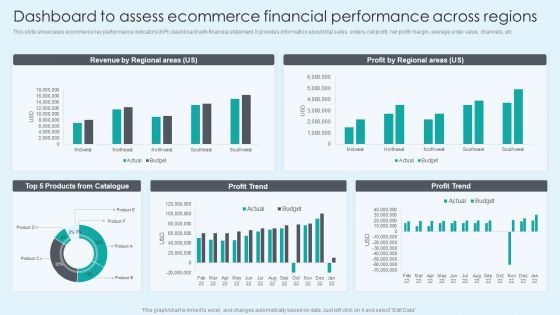
Dashboard To Assess Ecommerce Financial Performance Across Regions Themes PDF
This slide showcases ecommerce key performance indicators KPI dashboard with financial statement. It provides information about total sales, orders, net profit, net profit margin, average order value, channels, etc. Here you can discover an assortment of the finest PowerPoint and Google Slides templates. With these templates, you can create presentations for a variety of purposes while simultaneously providing your audience with an eye catching visual experience. Download Dashboard To Assess Ecommerce Financial Performance Across Regions Themes PDF to deliver an impeccable presentation. These templates will make your job of preparing presentations much quicker, yet still, maintain a high level of quality. Slidegeeks has experienced researchers who prepare these templates and write high quality content for you. Later on, you can personalize the content by editing the Dashboard To Assess Ecommerce Financial Performance Across Regions Themes PDF.
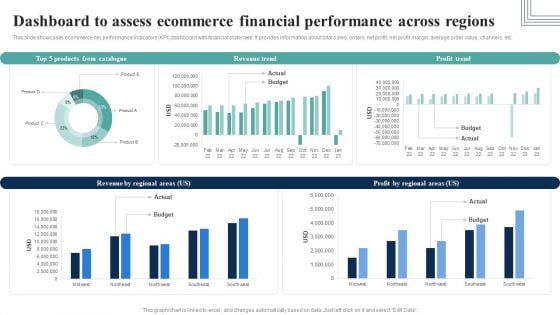
Dashboard To Assess Ecommerce Financial Performance Across Regions Infographics PDF
This slide showcases ecommerce key performance indicators KPI dashboard with financial statement. It provides information about total sales, orders, net profit, net profit margin, average order value, channels, etc.Here you can discover an assortment of the finest PowerPoint and Google Slides templates. With these templates, you can create presentations for a variety of purposes while simultaneously providing your audience with an eye-catching visual experience. Download Dashboard To Assess Ecommerce Financial Performance Across Regions Infographics PDF to deliver an impeccable presentation. These templates will make your job of preparing presentations much quicker, yet still, maintain a high level of quality. Slidegeeks has experienced researchers who prepare these templates and write high-quality content for you. Later on, you can personalize the content by editing the Dashboard To Assess Ecommerce Financial Performance Across Regions Infographics PDF.
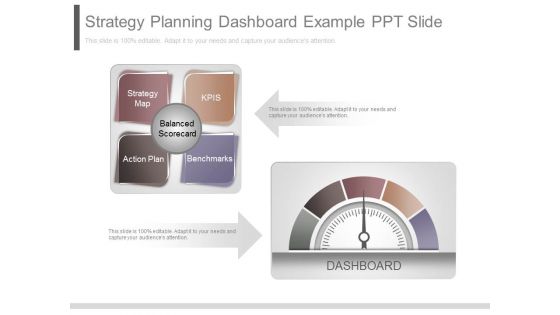
Strategy Planning Dashboard Example Ppt Slide
This is a strategy planning dashboard example ppt slide. This is a two stage process. The stages in this process are strategy map, kpis, balanced scorecard, action plan, benchmarks, dashboard.
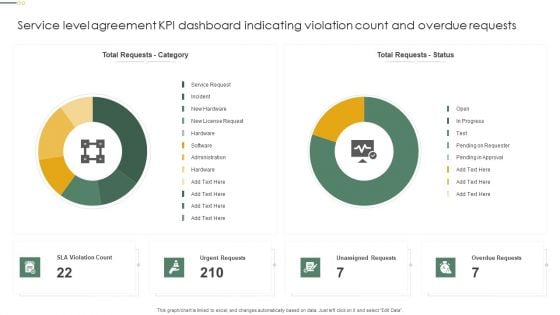
Service Level Agreement KPI Dashboard Indicating Violation Count And Overdue Requests Diagrams PDF
This graph or chart is linked to excel, and changes automatically based on data. Just left click on it and select Edit Data. Showcasing this set of slides titled Service Level Agreement KPI Dashboard Indicating Violation Count And Overdue Requests Diagrams PDF. The topics addressed in these templates are Total Requests Category, Total Requests Status, Urgent Requests. All the content presented in this PPT design is completely editable. Download it and make adjustments in color, background, font etc. as per your unique business setting.
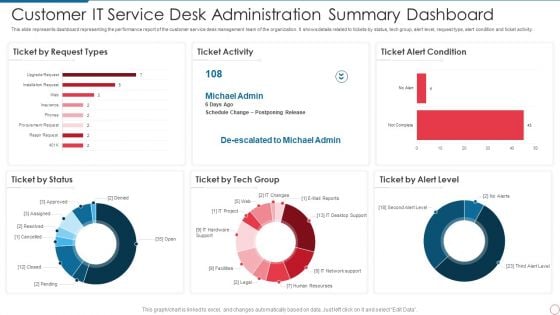
Customer IT Service Desk Administration Summary Dashboard Information PDF
This slide represents dashboard representing the performance report of the customer service desk management team of the organization. It shows details related to tickets by status, tech group, alert level, request type, alert condition and ticket activity. Showcasing this set of slides titled Customer IT Service Desk Administration Summary Dashboard Information PDF. The topics addressed in these templates are Customer It Service Desk Administration Summary Dashboard. All the content presented in this PPT design is completely editable. Download it and make adjustments in color, background, font etc. as per your unique business setting.
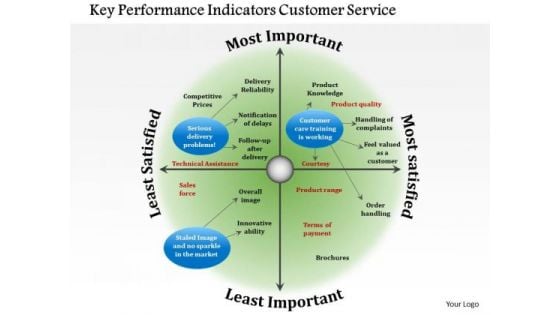
Business Framework Key Performance Indicators Customer Service PowerPoint Presentation
Our above diagram provides framework of key performance indicators for customer service. It contains circular diagram in four segments depicting concepts of delivery problems, customer care training. Download this diagram to make professional presentations on customer service.
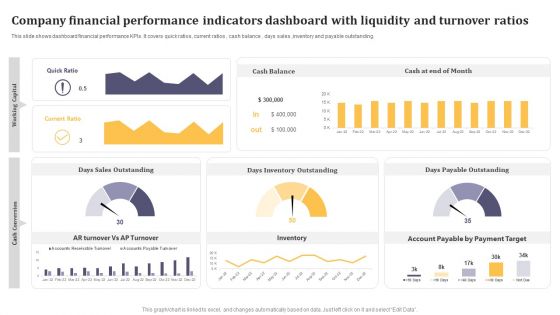
Company Financial Performance Indicators Dashboard With Liquidity And Turnover Ratios Formats PDF
This graph or chart is linked to excel, and changes automatically based on data. Just left click on it and select Edit Data. Pitch your topic with ease and precision using this Company Financial Performance Indicators Dashboard With Liquidity And Turnover Ratios Formats PDF. This layout presents information on Cash Balance, Days Inventory Outstanding, Days Payable Outstanding. It is also available for immediate download and adjustment. So, changes can be made in the color, design, graphics or any other component to create a unique layout.
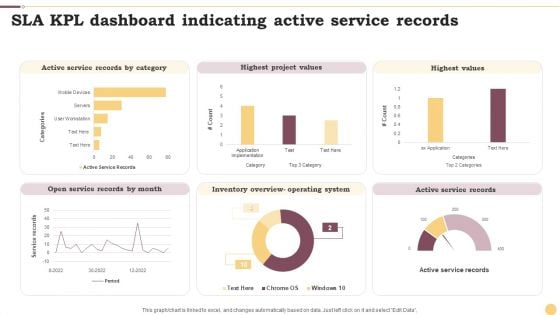
SLA KPL Dashboard Indicating Active Service Records Ppt Professional Graphics Example PDF
This graph or chart is linked to excel, and changes automatically based on data. Just left click on it and select Edit Data. Pitch your topic with ease and precision using this SLA KPL Dashboard Indicating Active Service Records Ppt Professional Graphics Example PDF. This layout presents information on Active Service Records, Highest Project Values, Highest Values. It is also available for immediate download and adjustment. So, changes can be made in the color, design, graphics or any other component to create a unique layout.
Business Audit Report Vector Icon Ppt PowerPoint Presentation Slide
Presenting this set of slides with name business audit report vector icon ppt powerpoint presentation slide. This is a one stage process. The stage in this process is business audit report vector icon. This is a completely editable PowerPoint presentation and is available for immediate download. Download now and impress your audience.
Business Sales Predictive Report Icon Ppt Ideas Portrait PDF
Presenting business sales predictive report icon ppt ideas portrait pdf to dispense important information. This template comprises one stages. It also presents valuable insights into the topics including business sales predictive report icon. This is a completely customizable PowerPoint theme that can be put to use immediately. So, download it and address the topic impactfully.
Market Research Growth Reporting Workflow Icon Formats PDF
Persuade your audience using this Market Research Growth Reporting Workflow Icon Formats PDF. This PPT design covers three stages, thus making it a great tool to use. It also caters to a variety of topics including Market Research Growth, Reporting Workflow Icon. Download this PPT design now to present a convincing pitch that not only emphasizes the topic but also showcases your presentation skills.
Global Benchmark Report Management And Finance Evaluation Icon Ideas PDF
Presenting Global Benchmark Report Management And Finance Evaluation Icon Ideas PDF to dispense important information. This template comprises one stages. It also presents valuable insights into the topics including Global Benchmark Report, Management And Finance, Evaluation Icon. This is a completely customizable PowerPoint theme that can be put to use immediately. So, download it and address the topic impactfully.
Global Employee Engagement Benchmark Report Icon Structure PDF
Presenting Global Employee Engagement Benchmark Report Icon Structure PDF to dispense important information. This template comprises one stages. It also presents valuable insights into the topics including Global Employee Engagement, Benchmark Report Icon. This is a completely customizable PowerPoint theme that can be put to use immediately. So, download it and address the topic impactfully.
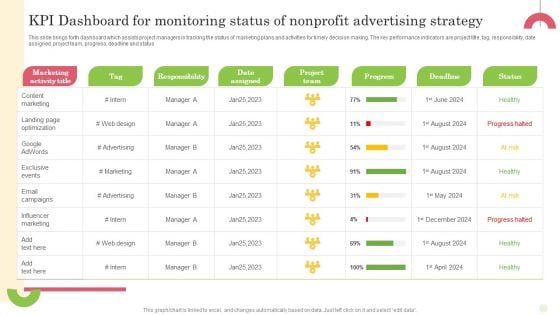
Kpi Dashboard For Monitoring Status Of Nonprofit Advertising Strategy Portrait PDF
This slide brings forth dashboard which assists project managers in tracking the status of marketing plans and activities for timely decision making. The key performance indicators are project title, tag, responsibility, date assigned, project team, progress, deadline and status Pitch your topic with ease and precision using this Kpi Dashboard For Monitoring Status Of Nonprofit Advertising Strategy Portrait PDF. This layout presents information on Tag, Responsibility, Date Assigned. It is also available for immediate download and adjustment. So, changes can be made in the color, design, graphics or any other component to create a unique layout.
Social Media Marketing Strategies To Generate Lead Dashboard For Tracking Social Media Kpis Summary PDF
This slide shows dashboard for tracking social media key performance indicators KPIs. It provides details about average social engagement, reactions, comments, shares, clicks, thumbnail, platform, post message, etc. Want to ace your presentation in front of a live audience Our Social Media Marketing Strategies To Generate Lead Dashboard For Tracking Social Media Kpis Summary PDF can help you do that by engaging all the users towards you. Slidegeeks experts have put their efforts and expertise into creating these impeccable powerpoint presentations so that you can communicate your ideas clearly. Moreover, all the templates are customizable, and easy to edit and downloadable. Use these for both personal and commercial use.
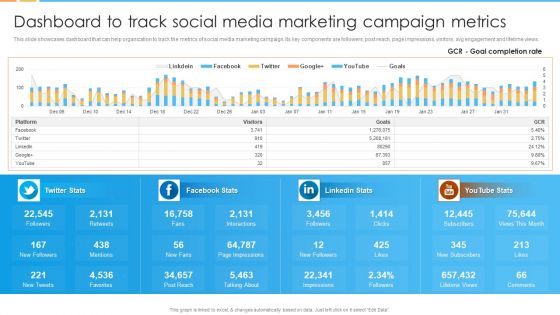
Digital Marketing Guide For B2B Firms Dashboard To Track Social Media Marketing Campaign Metrics Demonstration PDF
This slide showcases dashboard that can help organization to track the metrics of social media marketing campaign. Its key components are followers, post reach, page impressions, visitors, avg engagement and lifetime views.Deliver an awe inspiring pitch with this creative Digital Marketing Guide For B2B Firms Dashboard To Track Social Media Marketing Campaign Metrics Demonstration PDF bundle. Topics like Page Impressions, New Followers, Talking About can be discussed with this completely editable template. It is available for immediate download depending on the needs and requirements of the user.
Application Performance Dashboard Ppt Icon Template PDF
This slide covers application performance in market KPIs and metrics such as impressions, clicks, searches for app, conversion rate etc. This Application Performance Dashboard Ppt Icon Template PDF from Slidegeeks makes it easy to present information on your topic with precision. It provides customization options, so you can make changes to the colors, design, graphics, or any other component to create a unique layout. It is also available for immediate download, so you can begin using it right away. Slidegeeks has done good research to ensure that you have everything you need to make your presentation stand out. Make a name out there for a brilliant performance.
Big Data Real Time Analytics Lifecycle Ppt Icon Clipart Pdf
The following slide depicts big data real time analytics life cycle. It includes various phases such as data definition, acquisition, munging, analysis, visualization and utilization of analysis results. Pitch your topic with ease and precision using this Big Data Real Time Analytics Lifecycle Ppt Icon Clipart Pdf. This layout presents information on Acquisition, Munging, Analysis. It is also available for immediate download and adjustment. So, changes can be made in the color, design, graphics or any other component to create a unique layout. The following slide depicts big data real time analytics life cycle. It includes various phases such as data definition, acquisition, munging, analysis, visualization and utilization of analysis results.
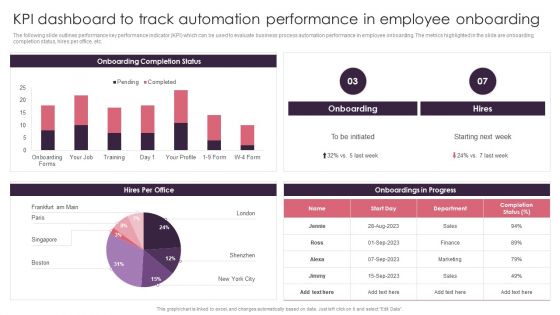
BPA Tools For Process Enhancement And Cost Minimization KPI Dashboard To Track Automation Performance In Employee Onboarding Graphics PDF
The following slide outlines performance key performance indicator KPI which can be used to evaluate business process automation performance in employee onboarding. The metrics highlighted in the slide are onboarding completion status, hires per office, etc. There are so many reasons you need a BPA Tools For Process Enhancement And Cost Minimization KPI Dashboard To Track Automation Performance In Employee Onboarding Graphics PDF. The first reason is you can not spend time making everything from scratch, Thus, Slidegeeks has made presentation templates for you too. You can easily download these templates from our website easily.
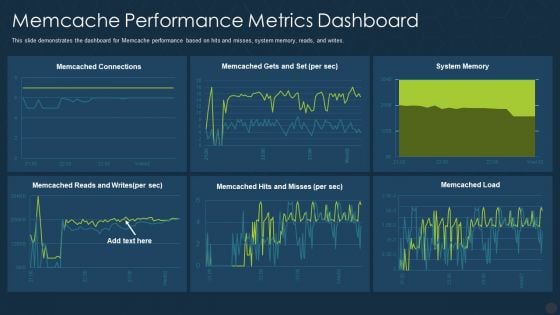
Memcache Performance Metrics Dashboard Ppt Portfolio Aids PDF
This slide demonstrates the dashboard for Memcache performance based on hits and misses, system memory, reads, and writes. Deliver an awe inspiring pitch with this creative memcache performance metrics dashboard ppt portfolio aids pdf bundle. Topics like memcache performance metrics dashboard can be discussed with this completely editable template. It is available for immediate download depending on the needs and requirements of the user.
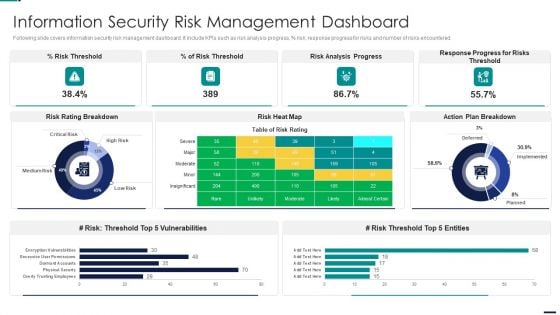
Risk Management Model For Data Security Information Security Risk Management Dashboard Pictures PDF
Following slide covers information security risk management dashboard. It include KPIs such as risk analysis progress, percent risk, response progress for risks and number of risks encountered. Deliver an awe inspiring pitch with this creative Risk Management Model For Data Security Information Security Risk Management Dashboard Pictures PDF bundle. Topics like Risk Threshold, Risk Analysis Progress, Response Progress For Risks Threshold, Action Plan Breakdown can be discussed with this completely editable template. It is available for immediate download depending on the needs and requirements of the user.
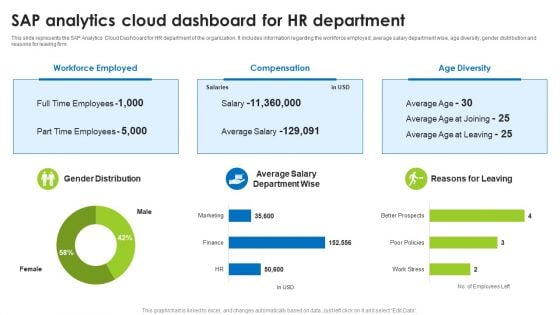
BI Technique For Data Informed Decisions Sap Analytics Cloud Dashboard For HR Department Background PDF
This slide represents the SAP Analytics Cloud Dashboard for HR department of the organization. It includes information regarding the workforce employed, average salary department wise, age diversity, gender distribution and reasons for leaving firm. This modern and well-arranged BI Technique For Data Informed Decisions Sap Analytics Cloud Dashboard For HR Department Background PDF provides lots of creative possibilities. It is very simple to customize and edit with the Powerpoint Software. Just drag and drop your pictures into the shapes. All facets of this template can be edited with Powerpoint no extra software is necessary. Add your own material, put your images in the places assigned for them, adjust the colors, and then you can show your slides to the world, with an animated slide included.
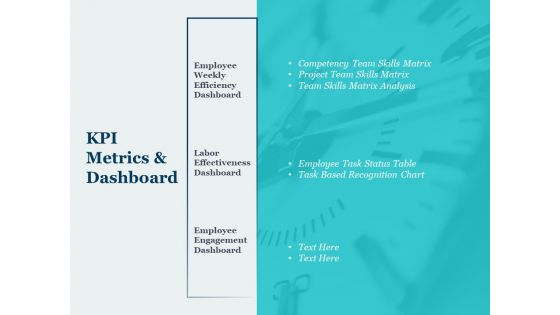
Kpi Metrics And Dashboard Ppt PowerPoint Presentation Inspiration Design Ideas
This is a kpi metrics and dashboard ppt powerpoint presentation inspiration design ideas. This is a three stage process. The stages in this process are business, management, marketing.
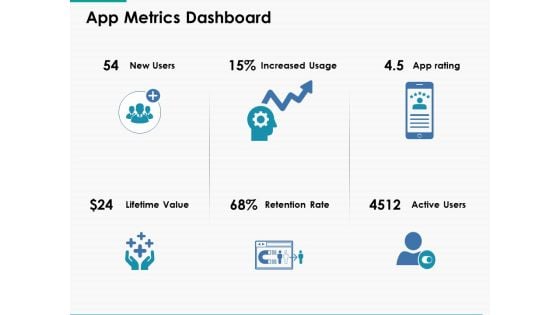
App Metrics Dashboard Ppt Powerpoint Presentation Layouts Portrait
This is a app metrics dashboard ppt powerpoint presentation layouts portrait. This is a six stage process. The stages in this process are business, management, planning, strategy, marketing.

App Metrics Dashboard Ppt PowerPoint Presentation Inspiration Design Inspiration
This is a app metrics dashboard ppt powerpoint presentation inspiration design inspiration. This is a six stage process. The stages in this process are business, management, marketing.
Four Circles With Social Communication Icons Powerpoint Slides
Concept of social communication can be well explained with this power point template. This PPT slide contains the four circles with communication icons. Use this diagram slide to make impressive presentations.
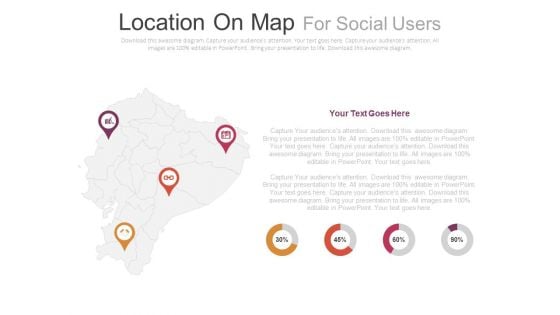
Four Locations On Map With Percentage Analysis Powerpoint Slides
This PowerPoint slide contains diagram of map with location pointers and icons. This professional slide helps to exhibit demographics of social media users. Use this PowerPoint template to make impressive presentations.
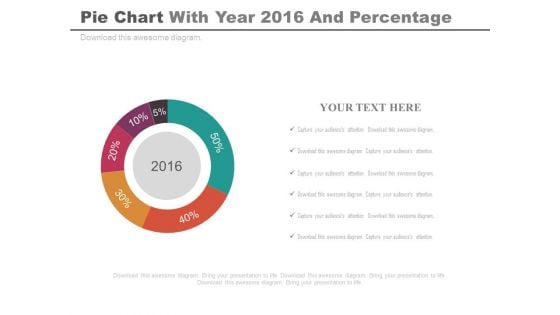
Pie Chart For Projected Profit Of 2016 Powerpoint Slides
Our above PPT slide displays graphics of Pie chart. This PowerPoint template may be used to display projected profit report of 2016. Download this template to leave permanent impression on your audience.
World Map With Location Pointers And Icons Powerpoint Slides
Develop competitive advantage with our above template which contains world map with location pointers. This diagram provides an effective way of displaying geographical information. You can edit text, color, shade and style as per you need.
Circle Diagram With Team Icon Powerpoint Slides
This PowerPoint template has been designed with circle diagram and team icons. You may download this PPT slide to display team planning and strategy. This PowerPoint template helps to display your information in a useful, simple and orderly way.
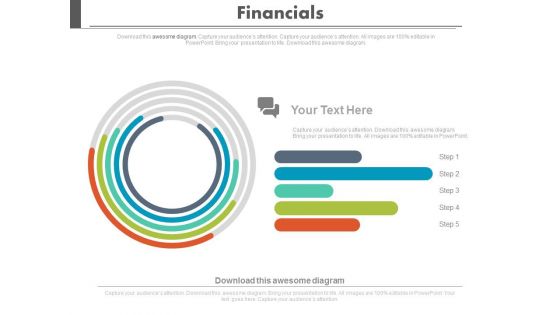
Financial Growth Analysis Circular Chart Powerpoint Slides
Visually support your presentation with our above template containing graphics of circular chart. This diagram slide helps to display financial growth analysis. Etch your views in the brains of your audience with this diagram slide.
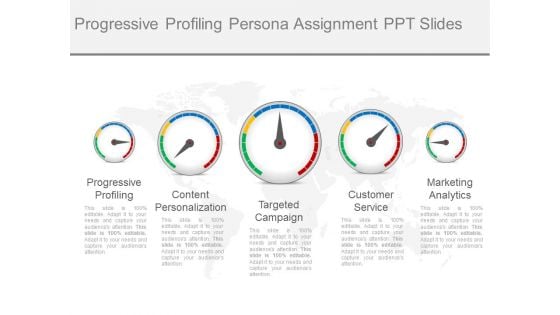
Progressive Profiling Persona Assignment Ppt Slides
This is a progressive profiling persona assignment ppt slides. This is a five stage process. The stages in this process are progressive profiling, content personalization, targeted campaign, customer service, marketing analytics.

Consensus Recommendations General Practitioners Ppt Slide
This is a consensus recommendations general practitioners ppt slide. This is a six stage process. The stages in this process are consensus recommendations, health care professionals, health agencies, professional societies, social media.
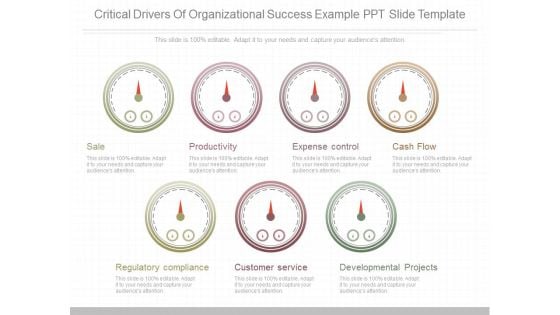
Critical Drivers Of Organizational Success Example Ppt Slide Template
This is a critical drivers of organizational success example ppt slide template. This is a seven stage process. The stages in this process are sale, productivity, expense control, cash flow, regulatory compliance, customer service, developmental projects.
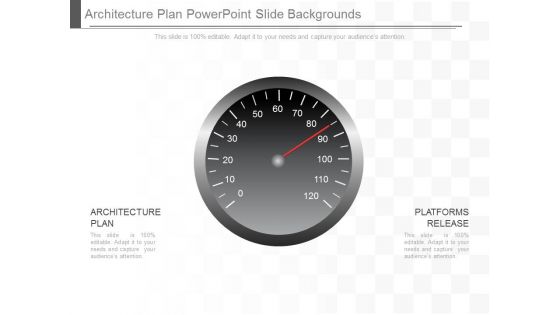
Architecture Plan Powerpoint Slide Backgrounds
This is a architecture plan powerpoint slide backgrounds. This is a two stage process. The stages in this process are architecture plan, platforms release.
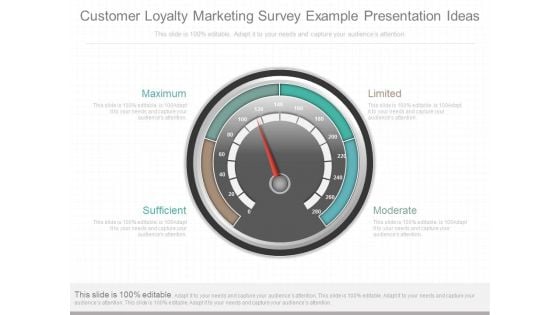
Customer Loyalty Marketing Survey Example Presentation Ideas
This is a customer loyalty marketing survey example presentation ideas. This is a four stage process. The stages in this process are sufficient, maximum, moderate, limited.
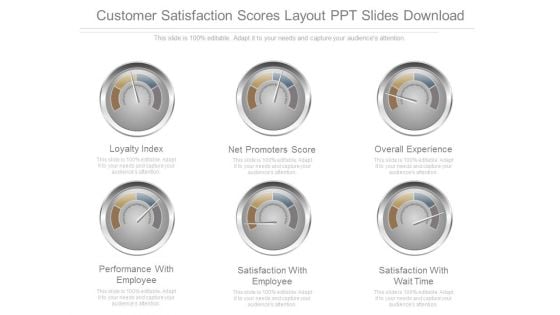
Customer Satisfaction Scores Layout Ppt Slides Download
This is a customer satisfaction scores layout ppt slides download. This is a six stage process. The stages in this process are loyalty index, net promoters score, overall experience, performance with employee, satisfaction with employee, satisfaction with wait time.
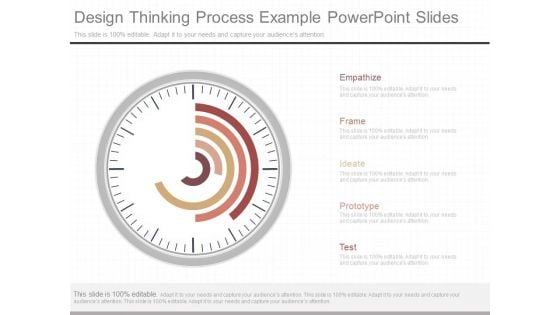
Design Thinking Process Example Powerpoint Slides
This is a design thinking process example powerpoint slides. This is a five stage process. The stages in this process are empathize, frame, ideate, prototype, test.


 Continue with Email

 Home
Home


