Stock Market Prediction
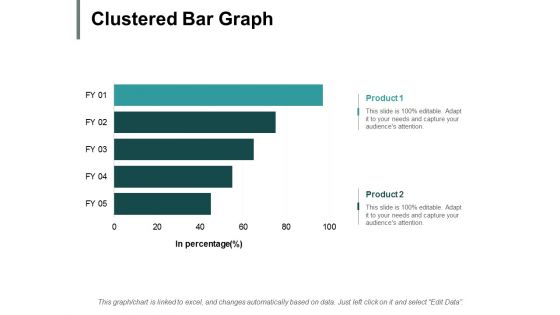
Clustered Bar Graph Ppt PowerPoint Presentation Pictures Example File
This is a clustered bar graph ppt powerpoint presentation pictures example file. This is a two stage process. The stages in this process are finance, marketing, management, investment, analysis.
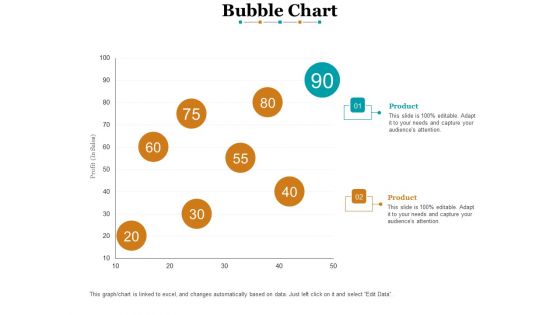
Bubble Chart Finance Ppt PowerPoint Presentation File Graphics
This is a bubble chart finance ppt powerpoint presentation file graphics. This is a two stage process. The stages in this process are bubble chart, finance, marketing, analysis, investment.
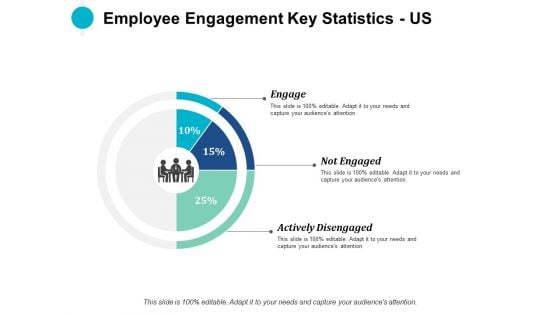
Employee Engagement Key Statistics US Ppt PowerPoint Presentation Infographic Template Graphics Example
This is a employee engagement key statistics us ppt powerpoint presentation infographic template graphics example. This is a three stage process. The stages in this process are finance, marketing, management, investment, analysis.

Employee Engagement Key Statistics Us Ppt Powerpoint Presentation Show Graphic Tips
This is a employee engagement key statistics us ppt powerpoint presentation show graphic tips. This is a three stage process. The stages in this process are finance, marketing, management, investment, analysis.
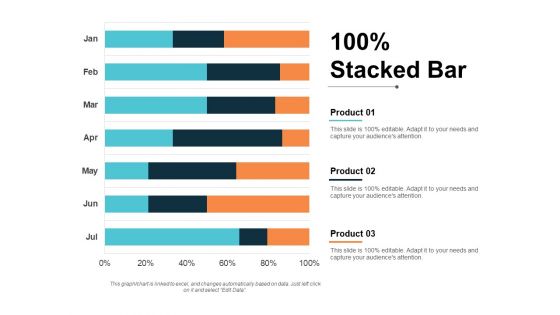
stacked bar finance ppt powerpoint presentation show graphics pictures
This is a stacked bar finance ppt powerpoint presentation show graphics pictures. This is a three stage process. The stages in this process are finance, marketing, management, investment, analysis.

Column Chart Employee Value Proposition Ppt PowerPoint Presentation Slides Graphics Design
This is a column chart employee value proposition ppt powerpoint presentation slides graphics design. This is a two stage process. The stages in this process are business, management, strategy, analysis, marketing.
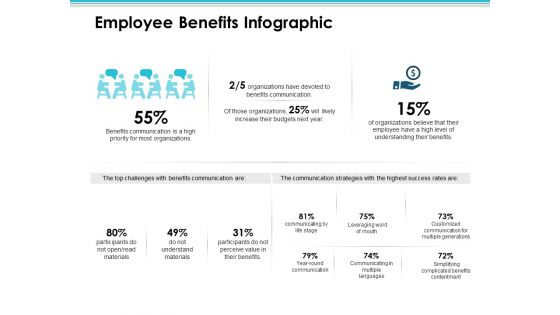
Employee Benefits Infographic Employee Value Proposition Ppt PowerPoint Presentation Styles Diagrams
This is a employee benefits infographic employee value proposition ppt powerpoint presentation styles diagrams. This is a three stage process. The stages in this process are business, management, strategy, analysis, marketing.
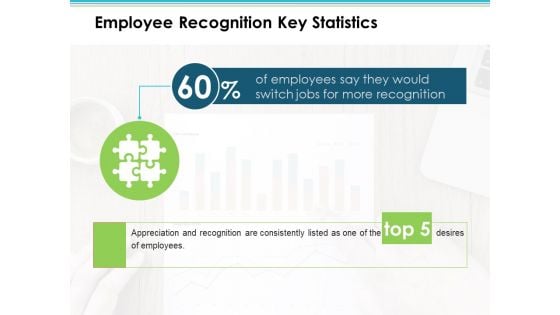
Employee Recognition Key Statistics Employee Value Proposition Ppt PowerPoint Presentation Layouts Mockup
This is a employee recognition key statistics employee value proposition ppt powerpoint presentation layouts mockup. This is a one stage process. The stages in this process are business, management, strategy, analysis, marketing.
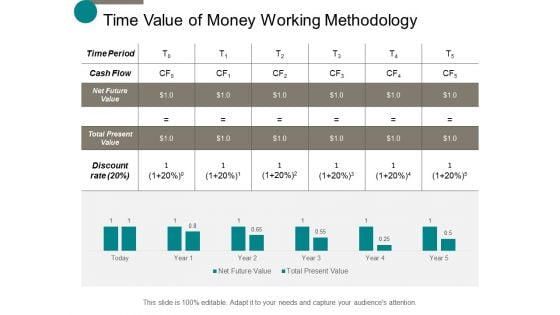
Time Value Of Money Working Methodology Ppt Powerpoint Presentation Professional Slide Download
This is a time value of money working methodology ppt powerpoint presentation professional slide download. This is a five stage process. The stages in this process are finance, marketing, management, investment, analysis.

Time Value Of Money Working Methodology Ppt Powerpoint Presentation Professional Slideshow
This is a time value of money working methodology ppt powerpoint presentation professional slideshow. This is a two stage process. The stages in this process are finance, marketing, management, investment, analysis.
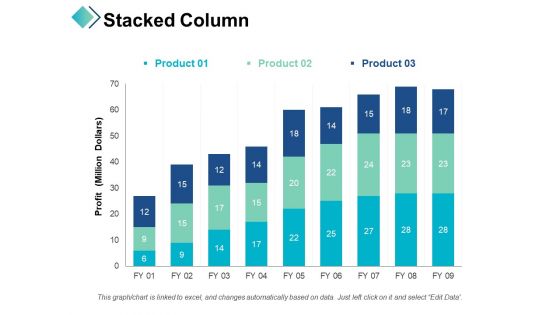
Stacked Column Profit Business Ppt PowerPoint Presentation Infographics Master Slide
This is a stacked column profit business ppt powerpoint presentation infographics master slide. This is a three stage process. The stages in this process are finance, strategy, analysis, business, marketing.
Types Of Common Size Statement Ppt PowerPoint Presentation Model Example
This is a types of common size statement ppt powerpoint presentation model example. This is a three stage process. The stages in this process are business, management, analysis, strategy, marketing.
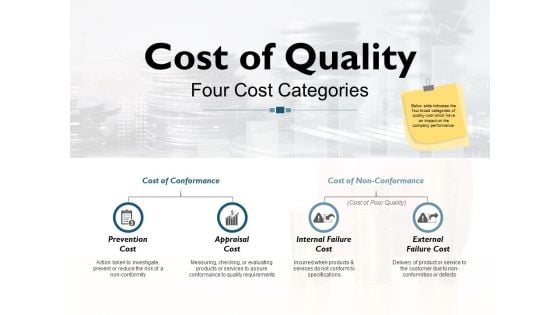
Cost Of Quality Four Cost Categories Ppt PowerPoint Presentation Infographics Design Ideas
This is a cost of quality four cost categories ppt powerpoint presentation infographics design ideas. This is a four stage process. The stages in this process are business, icons, analysis, strategy, marketing.
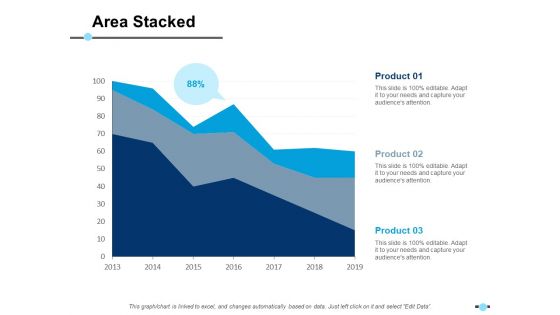
Area Stacked Product Finance Ppt PowerPoint Presentation Ideas Skills
This is a area stacked product finance ppt powerpoint presentation ideas skills. This is a three stage process. The stages in this process are finance, management, strategy, analysis, marketing.
Clustered Column Line Product Finance Ppt PowerPoint Presentation Icon Infographics
This is a clustered column line product finance ppt powerpoint presentation icon infographics. This is a three stage process. The stages in this process are finance, management, strategy, analysis, marketing.

Donut Pie Chart Product Finance Ppt PowerPoint Presentation Diagram Ppt
This is a donut pie chart product finance ppt powerpoint presentation diagram ppt. This is a three stage process. The stages in this process are finance, management, strategy, analysis, marketing.
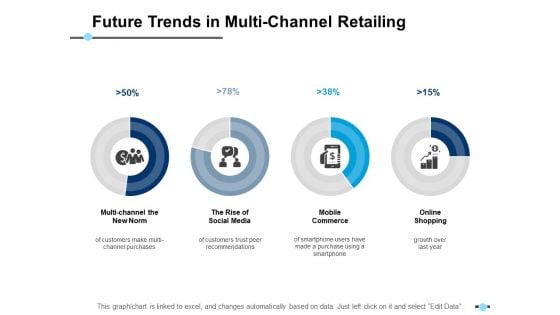
Future Trends In Multi Channel Retailing Multi Channel The New Norm Ppt PowerPoint Presentation Pictures Background Images
This is a future trends in multi channel retailing multi channel the new norm ppt powerpoint presentation pictures background images. This is a four stage process. The stages in this process are finance, management, strategy, analysis, marketing.
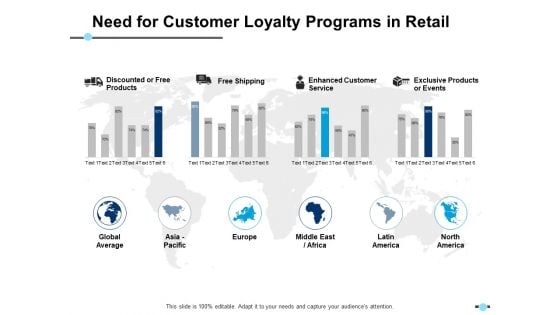
Need For Customer Loyalty Programs In Retail Enhanced Customer Service Ppt PowerPoint Presentation Outline Graphics Pictures
This is a need for customer loyalty programs in retail enhanced customer service ppt powerpoint presentation outline graphics pictures. This is a four stage process. The stages in this process are finance, strategy, analysis, marketing.
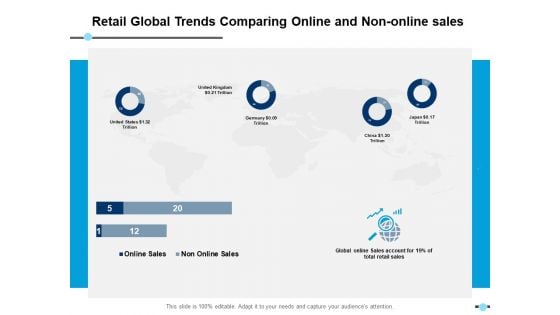
Retail Global Trends Comparing Online And Non Online Sales Donut Ppt PowerPoint Presentation Infographic Template Images
This is a retail global trends comparing online and non online sales donut ppt powerpoint presentation infographic template images. This is a four stage process. The stages in this process are finance, strategy, analysis, marketing.
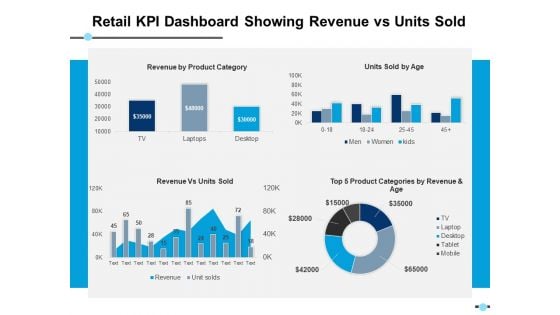
Retail Kpi Dashboard Showing Revenue Vs Units Sold Top 5 Product Categories Ppt PowerPoint Presentation Layouts Designs Download
This is a retail kpi dashboard showing revenue vs units sold top 5 product categories ppt powerpoint presentation layouts designs download. This is a four stage process. The stages in this process are finance, strategy, analysis, marketing.
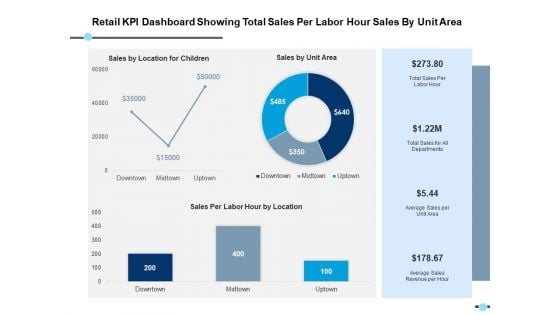
Retail Kpi Dashboard Showing Total Sales Per Labor Hour Sales By Unit Area Ppt PowerPoint Presentation Model Format
This is a retail kpi dashboard showing total sales per labor hour sales by unit area ppt powerpoint presentation model format. This is a three stage process. The stages in this process are finance, strategy, analysis, marketing.
Retail Sales By Product Category Icons Ppt PowerPoint Presentation Pictures Layout Ideas
This is a retail sales by product category icons ppt powerpoint presentation pictures layout ideas. This is a two stage process. The stages in this process are finance, strategy, analysis, marketing.
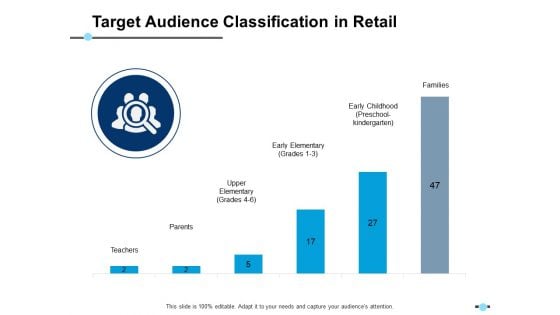
Target Audience Classification In Retail Early Elementary Ppt PowerPoint Presentation Infographics Maker
This is a target audience classification in retail early elementary ppt powerpoint presentation infographics maker. This is a two stage process. The stages in this process are finance, strategy, analysis, marketing.
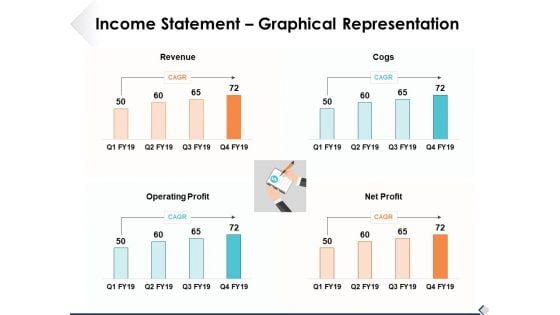
Income Statement Graphical Representation Ppt PowerPoint Presentation Inspiration Graphics
This is a income statement graphical representation ppt powerpoint presentation inspiration graphics. This is a four stage process. The stages in this process are analysis, marketing, icons, finance, strategy.
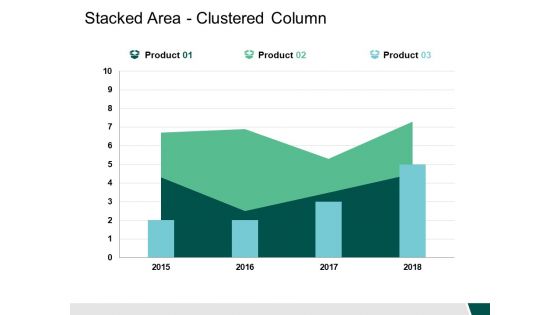
Stacked Area Clustered Column Ppt PowerPoint Presentation Model Graphics Example
This is a stacked area clustered column ppt powerpoint presentation model graphics example. This is a three stage process. The stages in this process are finance, management, strategy, analysis, marketing.
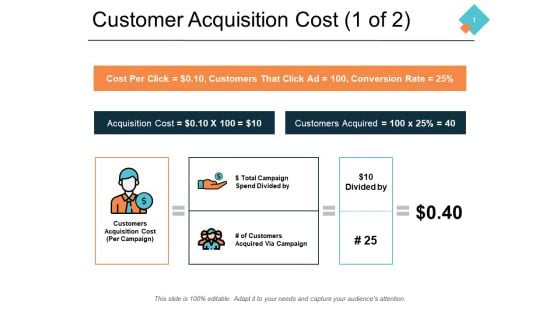
Customer Acquisition Cost 1 Of 2 Ppt PowerPoint Presentation Infographics Outline
This is a customer acquisition cost 1 of 2 ppt powerpoint presentation infographics outline. This is a three stage process. The stages in this process are icons, management, strategy, analysis, marketing.
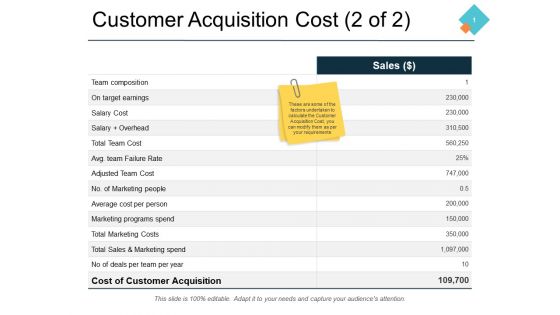
Customer Acquisition Cost 2 Of 2 Slide2 Ppt PowerPoint Presentation Professional Example
This is a customer acquisition cost 2 of 2 slide2 ppt powerpoint presentation professional example. This is a three stage process. The stages in this process are finance, management, strategy, analysis, marketing.
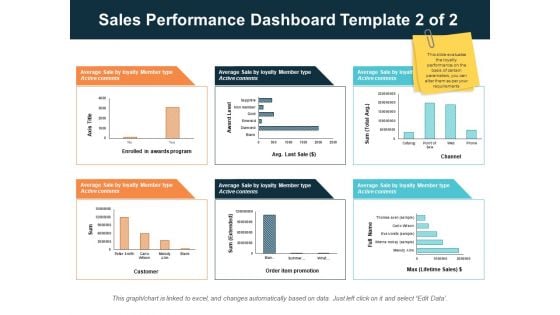
Sales Performance Dashboard Template 2 Of 2 Ppt PowerPoint Presentation Infographics Design Inspiration
This is a sales performance dashboard template 2 of 2 ppt powerpoint presentation infographics design inspiration. This is a three stage process. The stages in this process are finance, management, strategy, analysis, marketing.
Social Media And Word Of Mouth Metrics Ppt PowerPoint Presentation Model Icon
This is a social media and word of mouth metrics ppt powerpoint presentation model icon. This is a two stage process. The stages in this process are finance, management, strategy, analysis, marketing.

Donut Pie Chart Finance Ppt PowerPoint Presentation Portfolio Model
This is a donut pie chart finance ppt powerpoint presentation portfolio model. This is a three stage process. The stages in this process are finance, management, strategy, analysis, marketing.
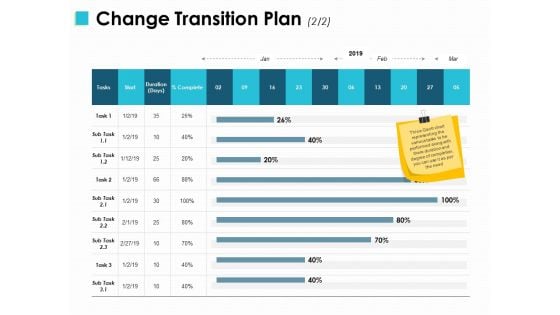
Change Transition Plan Compare Ppt PowerPoint Presentation File Rules
This is a change transition plan compare ppt powerpoint presentation file rules. This is a two stage process. The stages in this process are finance, marketing, management, investment, analysis.
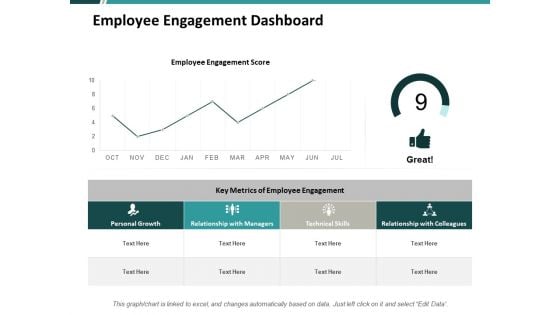
Employee Engagement Dashboard Ppt PowerPoint Presentation Professional File Formats
This is a employee engagement dashboard ppt powerpoint presentation professional file formats. This is a four stage process. The stages in this process are finance, marketing, management, investment, analysis.
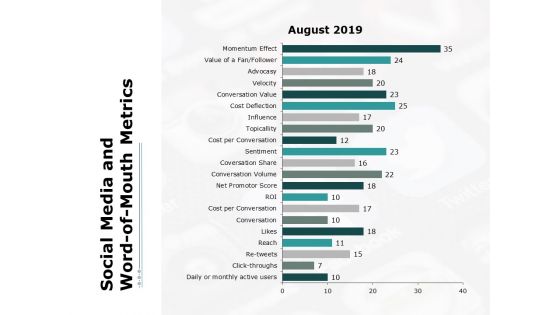
Social Media And Word Of Mouth Metrics Ppt PowerPoint Presentation Layouts Graphics
This is a social media and word of mouth metrics ppt powerpoint presentation layouts graphics. This is a three stage process. The stages in this process are finance, marketing, management, investment, analysis.
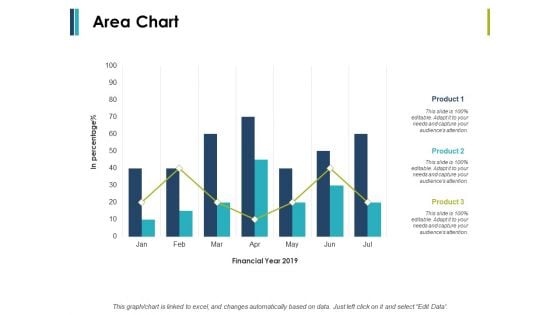
Area Chart Finance Ppt PowerPoint Presentation Infographic Template Model
This is a area chart finance ppt powerpoint presentation infographic template model. This is a two stage process. The stages in this process are finance, marketing, management, investment, analysis.
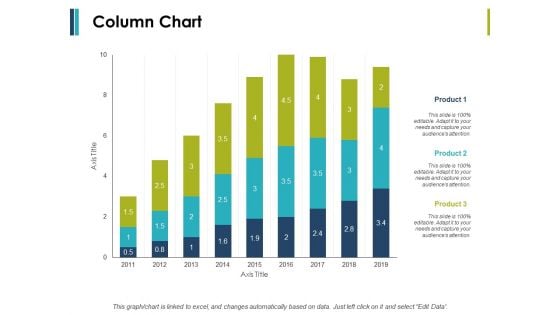
Column Chart And Graph Ppt PowerPoint Presentation File Introduction
This is a column chart and graph ppt powerpoint presentation file introduction. This is a three stage process. The stages in this process are finance, marketing, management, investment, analysis.
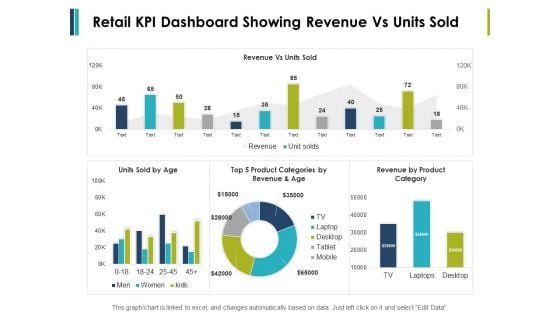
Retail Kpi Dashboard Showing Revenue Vs Units Sold Ppt PowerPoint Presentation File Formats
This is a retail kpi dashboard showing revenue vs units sold ppt powerpoint presentation file formats. This is a three stage process. The stages in this process are finance, marketing, management, investment, analysis.
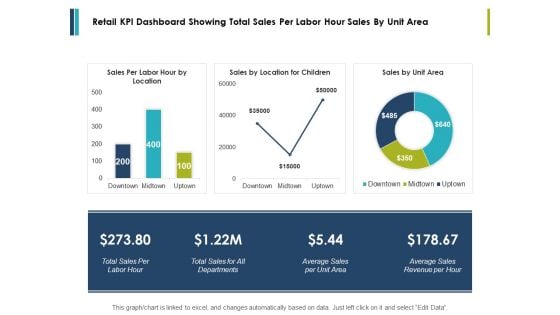
Retail Kpi Dashboard Showing Total Sales Per Labor Hour Sales By Unit Area Ppt PowerPoint Presentation Styles Influencers
This is a retail kpi dashboard showing total sales per labor hour sales by unit area ppt powerpoint presentation styles influencers. This is a three stage process. The stages in this process are finance, marketing, management, investment, analysis.
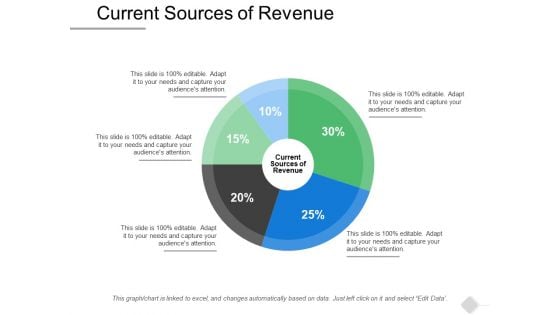
Current Sources Of Revenue Ppt PowerPoint Presentation File Design Inspiration
This is a current sources of revenue ppt powerpoint presentation file design inspiration. This is a five stage process. The stages in this process are finance, marketing, management, investment, analysis.
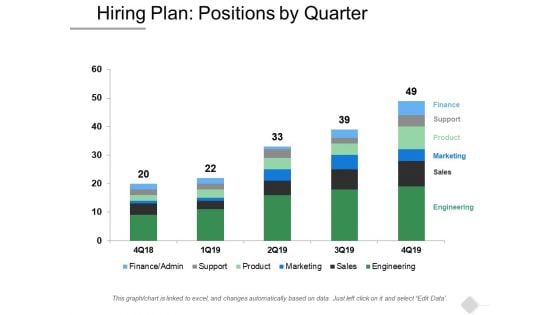
Hiring Plan Positions By Quarter Ppt PowerPoint Presentation Styles Visual Aids
This is a hiring plan positions by quarter ppt powerpoint presentation styles visual aids. This is a six stage process. The stages in this process are finance, marketing, management, investment, analysis.
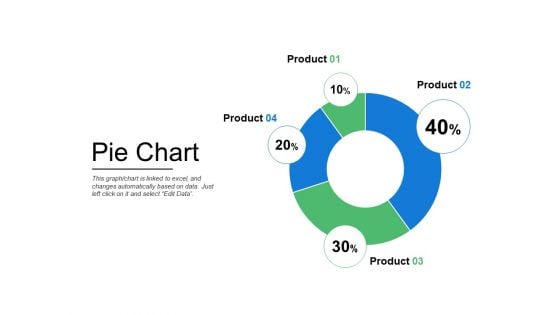
Pie Chart Finance Ppt PowerPoint Presentation Infographics Mockup
This is a pie chart finance ppt powerpoint presentation infographics mockup . This is a four stage process. The stages in this process are finance, marketing, management, investment, analysis.
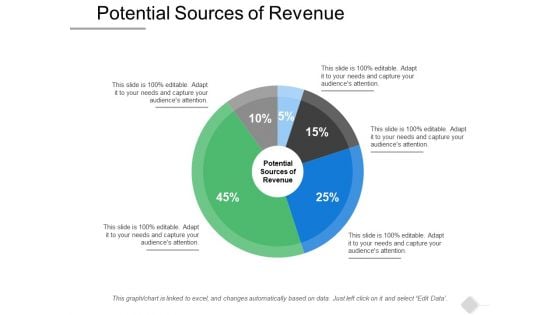
Potential Sources Of Revenue Ppt PowerPoint Presentation Outline Themes
This is a potential sources of revenue ppt powerpoint presentation outline themes. This is a five stage process. The stages in this process are finance, marketing, management, investment, analysis.
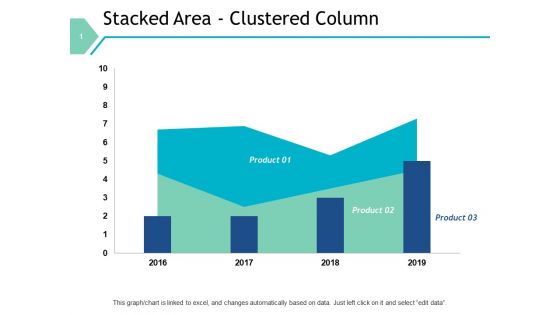
Stacked Area Clustered Column Graph Ppt PowerPoint Presentation File Designs Download
This is a stacked area clustered column graph ppt powerpoint presentation file designs download. This is a three stage process. The stages in this process are finance, marketing, management, investment, analysis.
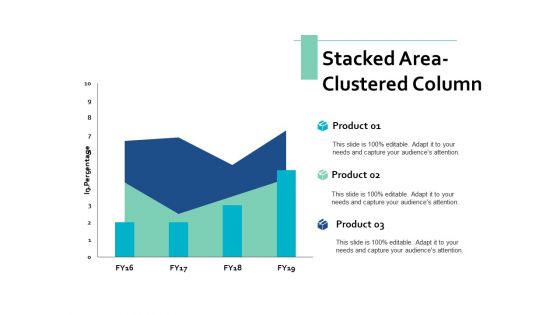
Stacked Area Clustered Column Ppt PowerPoint Presentation Pictures Professional
This is a stacked area clustered column ppt powerpoint presentation pictures professional. This is a three stage process. The stages in this process are finance, marketing, management, investment, analysis.
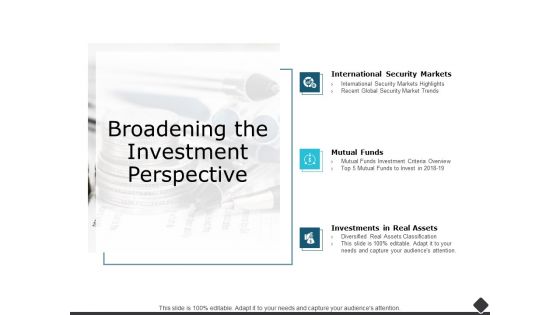
Broadening The Investment Perspective Ppt PowerPoint Presentation Pictures Rules
This is a broadening the investment perspective ppt powerpoint presentation pictures rules. This is a one stage process. The stages in this process are finance, marketing, management, investment, analysis.
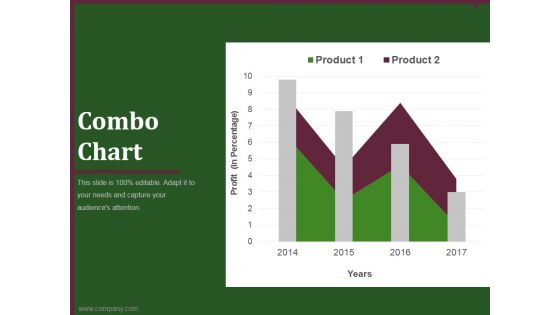
combo chart template 2 ppt powerpoint presentation background images
This is a combo chart template 2 ppt powerpoint presentation background images. This is a four stage process. The stages in this process are business, marketing, finance, timeline, product.
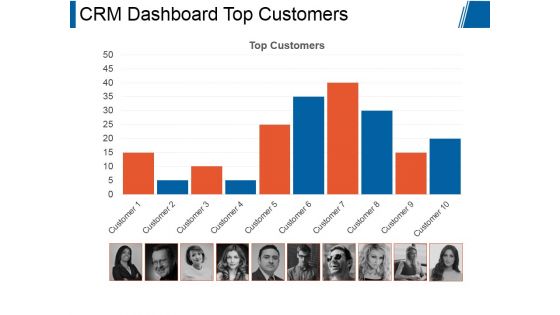
Crm Dashboard Top Customers Ppt PowerPoint Presentation Graphics
This is a crm dashboard top customers ppt powerpoint presentation graphics. This is a ten stage process. The stages in this process are top customers, business, marketing, process, management.
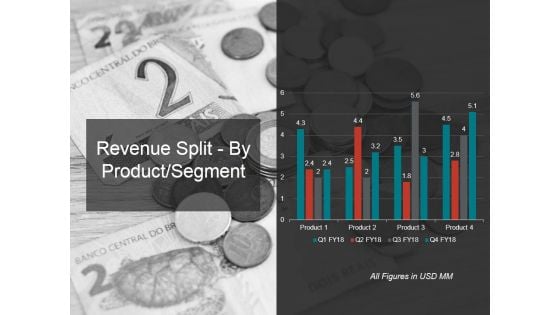
Revenue Split By Product Segment Template 1 Ppt PowerPoint Presentation Infographics Example
This is a revenue split by product segment template 1 ppt powerpoint presentation infographics example. This is a four stage process. The stages in this process are revenue, segment, business, marketing, success.
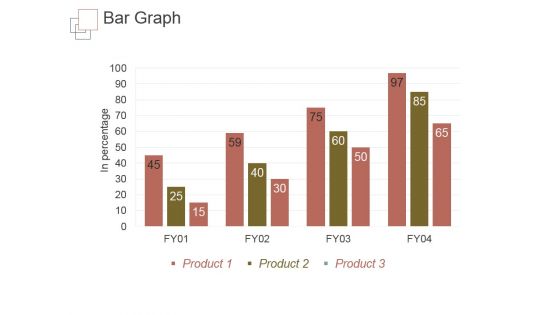
Bar Graph Ppt PowerPoint Presentation Gallery Skills
This is a bar graph ppt powerpoint presentation gallery skills. This is a four stage process. The stages in this process are in percentage, bar graph, business, marketing, product.
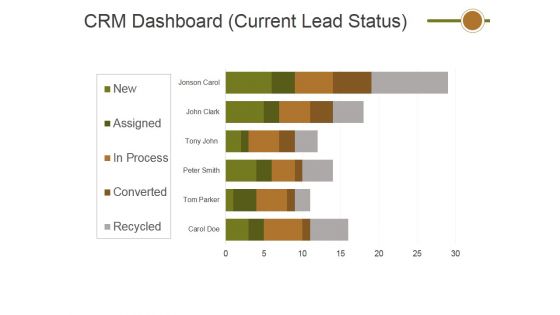
Crm Dashboard Current Lead Status Ppt PowerPoint Presentation Show Slide Portrait
This is a crm dashboard current lead status ppt powerpoint presentation show slide portrait. This is a six stage process. The stages in this process are crm dashboard, current lead status, business, marketing.
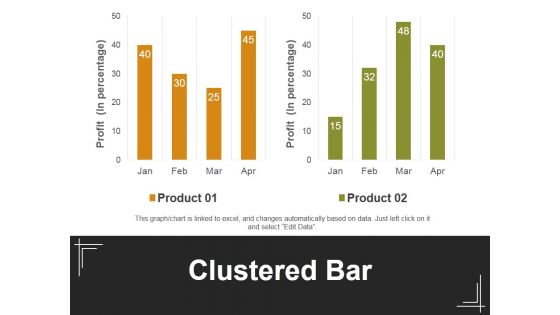
Clustered Bar Ppt PowerPoint Presentation Summary Design Inspiration
This is a clustered bar ppt powerpoint presentation summary design inspiration. This is a two stage process. The stages in this process are product, clustered bar, profit, business, marketing.
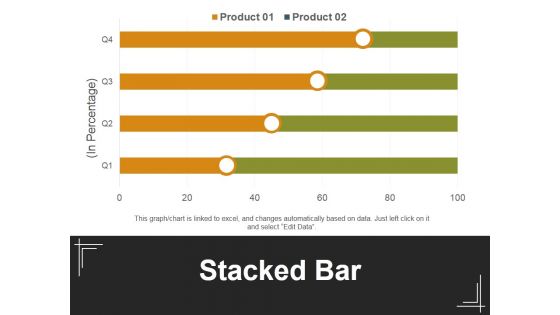
Stacked Bar Template 1 Ppt PowerPoint Presentation Inspiration Background Designs
This is a stacked bar template 1 ppt powerpoint presentation inspiration background designs. This is a four stage process. The stages in this process are in percentage, stacked bar, product, business, marketing.
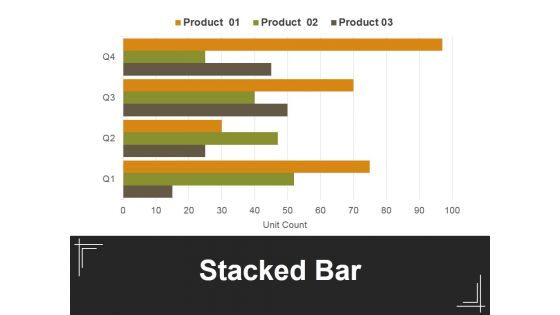
Stacked Bar Template 2 Ppt PowerPoint Presentation Professional Example
This is a stacked bar template 2 ppt powerpoint presentation professional example. This is a four stage process. The stages in this process are in percentage, stacked bar, product, business, marketing.
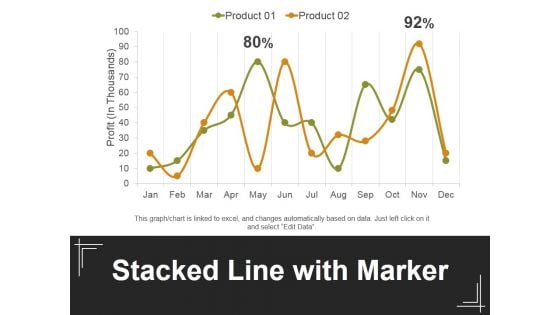
Stacked Line With Marker Ppt PowerPoint Presentation Ideas Themes
This is a stacked line with marker ppt powerpoint presentation ideas themes. This is a two stage process. The stages in this process are profit, stacked bar, product, business, marketing.
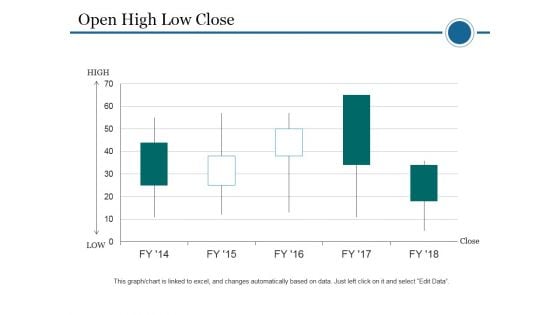
Open High Low Close Ppt PowerPoint Presentation Pictures Example Introduction
This is a open high low close ppt powerpoint presentation pictures example introduction. This is a five stage process. The stages in this process are high, low, close, business, marketing.
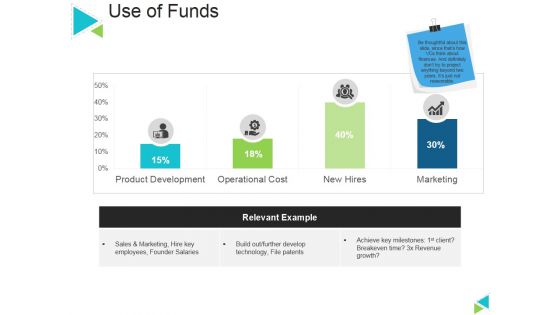
Use Of Funds Ppt PowerPoint Presentation Layouts Graphics Template
This is a use of funds ppt powerpoint presentation layouts graphics template. This is a four stage process. The stages in this process are relevant example, marketing, business, product development, new hires.
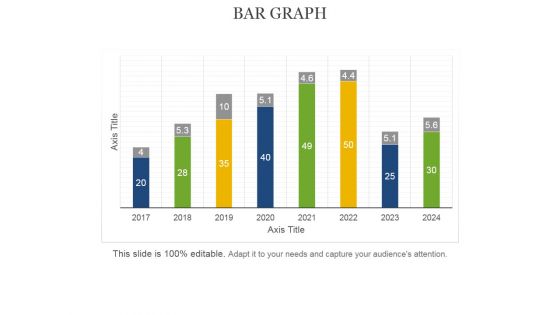
Bar Graph Ppt PowerPoint Presentation Professional Guide
This is a bar graph ppt powerpoint presentation professional guide. This is a eight stage process. The stages in this process are axis title, bar graph, business, marketing, management.
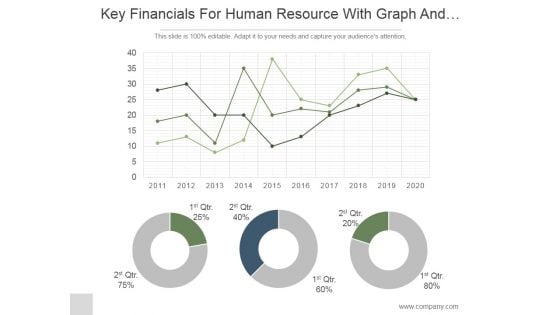
Key Financials For Human Resource With Graph And Pie Chart Ppt PowerPoint Presentation Ideas
This is a key financials for human resource with graph and pie chart ppt powerpoint presentation ideas. This is a three stage process. The stages in this process are business, strategy, marketing, analysis, donut, growth.
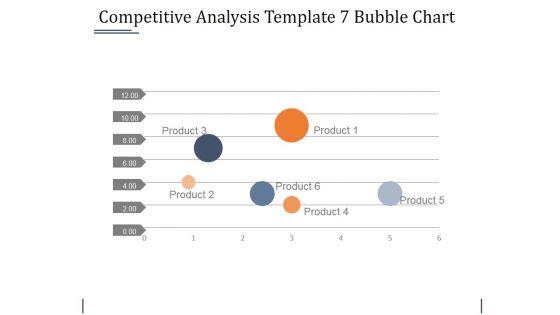
Competitive Analysis Template 7 Bubble Chart Ppt PowerPoint Presentation Summary Guidelines
This is a competitive analysis template 7 bubble chart ppt powerpoint presentation summary guidelines. This is a six stage process. The stages in this process are business, bubble, management, strategy, marketing.
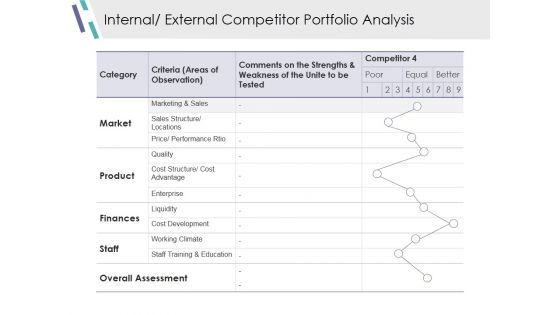
Internal External Competitor Portfolio Analysis Ppt PowerPoint Presentation Model Infographic Template
This is a internal external competitor portfolio analysis ppt powerpoint presentation model infographic template. This is a five stage process. The stages in this process are market, product, finances, staff, overall assessment.
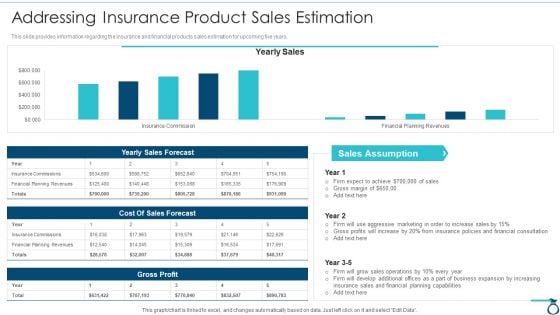
Financial Services Advisory Business Plan Addressing Insurance Product Sales Estimation Diagrams PDF
This slide provides information regarding the insurance and financial products sales estimation for upcoming five years. Deliver an awe inspiring pitch with this creative Financial Services Advisory Business Plan Addressing Insurance Product Sales Estimation Diagrams PDF bundle. Topics like Gross Profit, Cost Of Sales, Sales Assumption, Aggressive Marketing, Increasing Insurance can be discussed with this completely editable template. It is available for immediate download depending on the needs and requirements of the user.


 Continue with Email

 Home
Home


